
visualize-my-expenses


Turn a month of budget rows into a Sankey diagram you can share as a PNG.
pip install vme-py
vme render budget.csv -c PLN -o august.png --month 2026-08
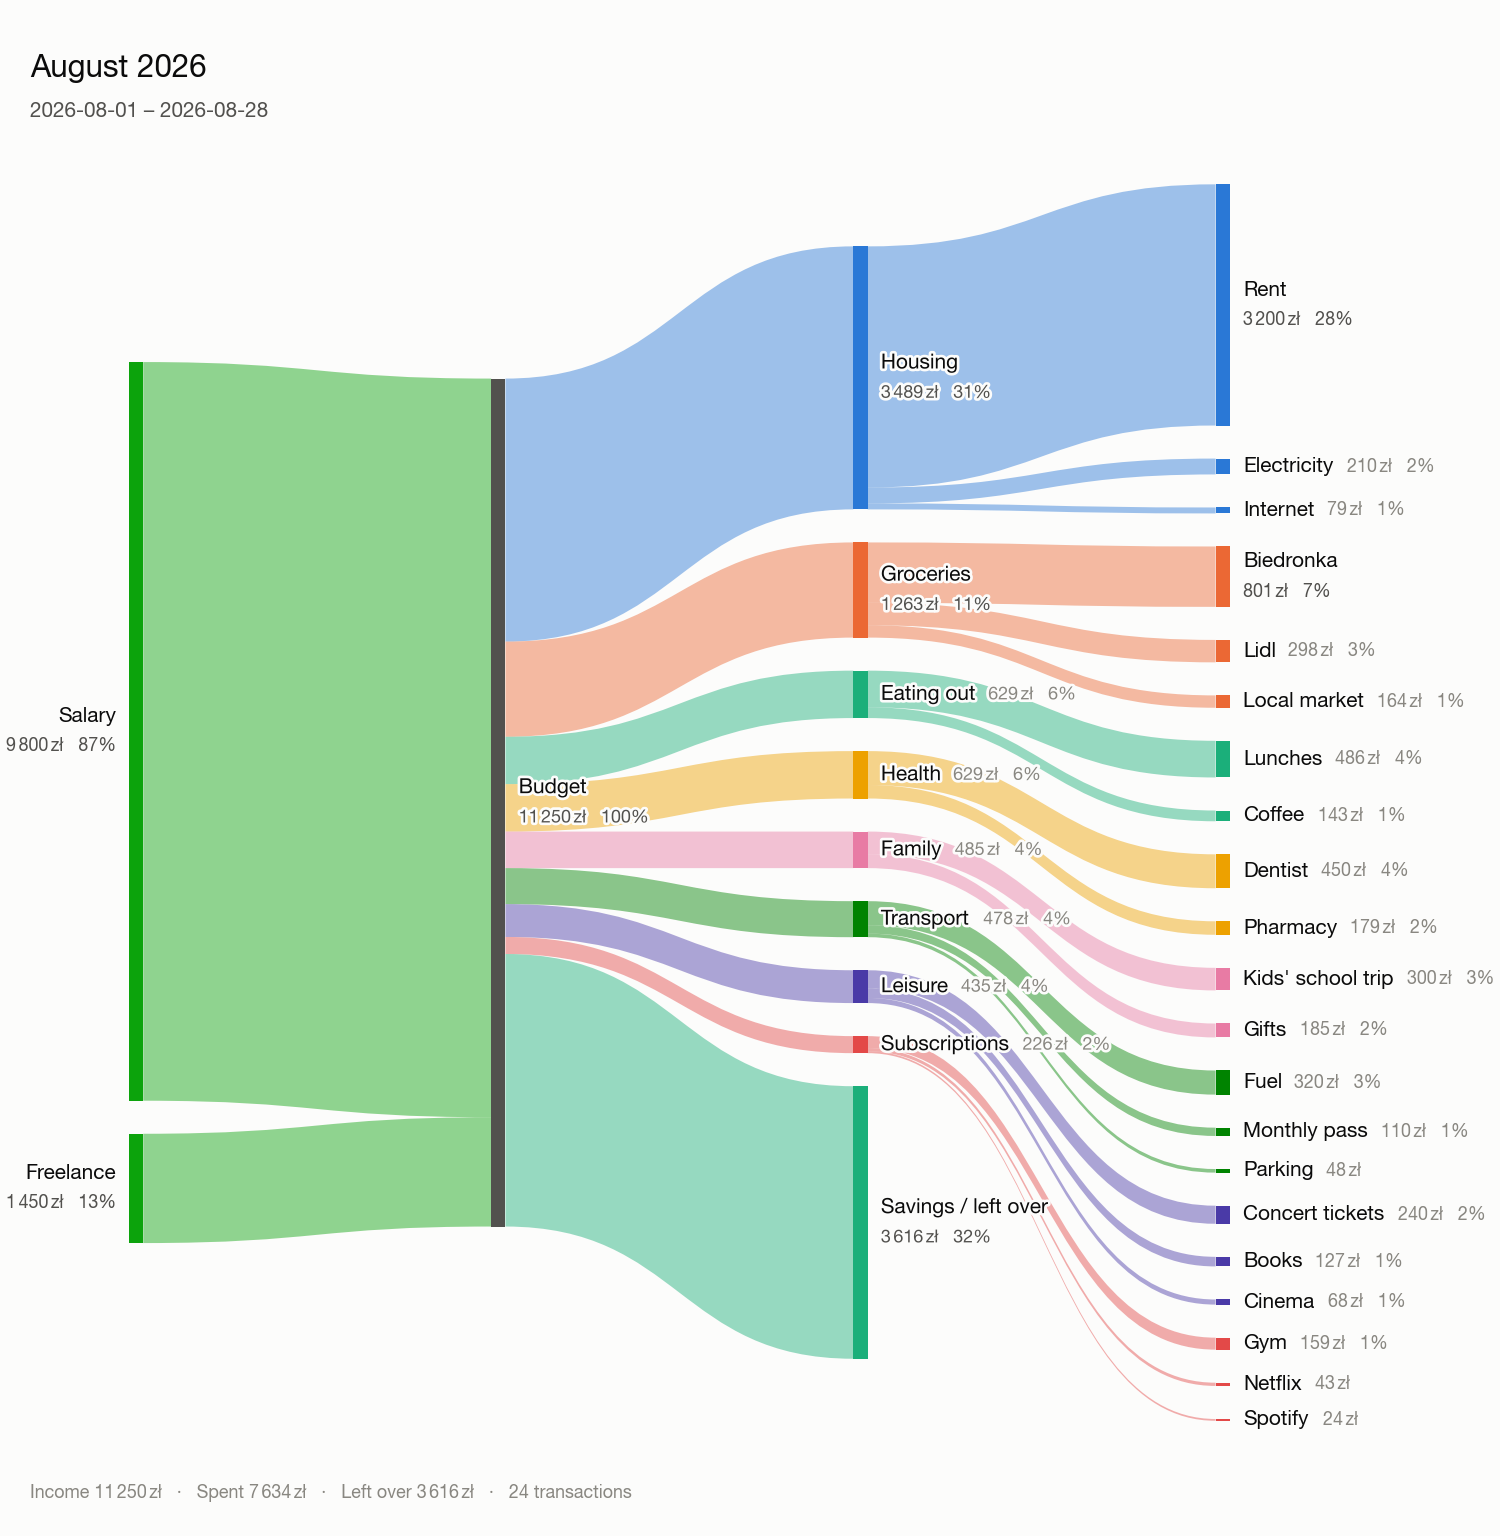
Money flows left to right: income sources → your budget → categories → what you actually bought. Whatever you did not spend leaves as Savings / left over, so the picture always balances.
Install
pip install vme-py
The package is called vme-py on PyPI; the command it installs and the module
you import are both vme. If you only want the command, give it an environment
of its own:
uv tool install vme-py # or: pipx install vme-py
Python 3.9 or newer. The core needs only click and matplotlib — no browser,
no headless Chrome, no network. Two optional extras:
| Extra | Adds | For |
|---|---|---|
vme-py[excel] |
openpyxl |
reading .xlsx workbooks |
vme-py[html] |
plotly |
writing an interactive .html version |
vme-py[all] |
both |
pip install "vme-py[all]"
To work on the code, install from a clone instead:
git clone https://github.com/oskar-j/visualize-my-expenses
cd visualize-my-expenses
uv sync                       # .venv as pinned by uv.lock: the package, both extras, the dev tools
# or: python -m venv .venv && source .venv/bin/activate && pip install -e ".[all]"
Try it in 30 seconds
vme sample budget.csv                       # writes an example file
vme render budget.csv -c PLN -o august.png  # draws it
Input formats
Point vme at whatever your bank or budget app exports; the format is guessed
from the file name, and --format overrides the guess.
| Format | Extensions | Notes |
|---|---|---|
| CSV / TSV | .csv .tsv .txt |
separator and encoding are sniffed |
| JSON | .json |
an array of rows, or {"expenses": [...]} |
| JSON Lines | .jsonl .ndjson |
one row per line |
| OFX / QFX | .ofx .qfx |
most US banks, Quicken, MS Money |
| QIF | .qif |
older Quicken exports |
| ISO 20022 camt | .xml .camt |
camt.052/053/054 SEPA statements |
| Excel | .xlsx .xlsm |
needs the excel extra |
vme formats prints the same list.
Column names are matched loosely, so a bank export usually works untouched —
Posted Date, Description, Transaction Amount, Debit/Credit, kwota and
waluta are all understood. Amounts written as 1,234.56, 1.234,56,
1 234,56, (12.00), 120.00- or $1,234.56 all parse.
The minimum a CSV needs is an amount:
date,category,label,amount,currency,kind
2026-08-01,Income,Salary,9800.00,PLN,income
2026-08-02,Housing,Rent,3200.00,PLN,expense
2026-08-04,Groceries,Biedronka,412.85,PLN,expense
category groups, label is the detail inside the group, kind is income or
expense. Leave kind out and the direction is inferred: if any amount is
negative the file is read as a bank statement (negative = money out); if none
is, every row is spending.
Multiple currencies
Each row carries its own currency, and -c/--currency says which one the
picture is drawn in. Anything else needs a rate — one unit of that currency
expressed in the report currency:
vme render trip.csv -c PLN --rate EUR=4.30 --rate UAH=0.095 --rate USD=3.95
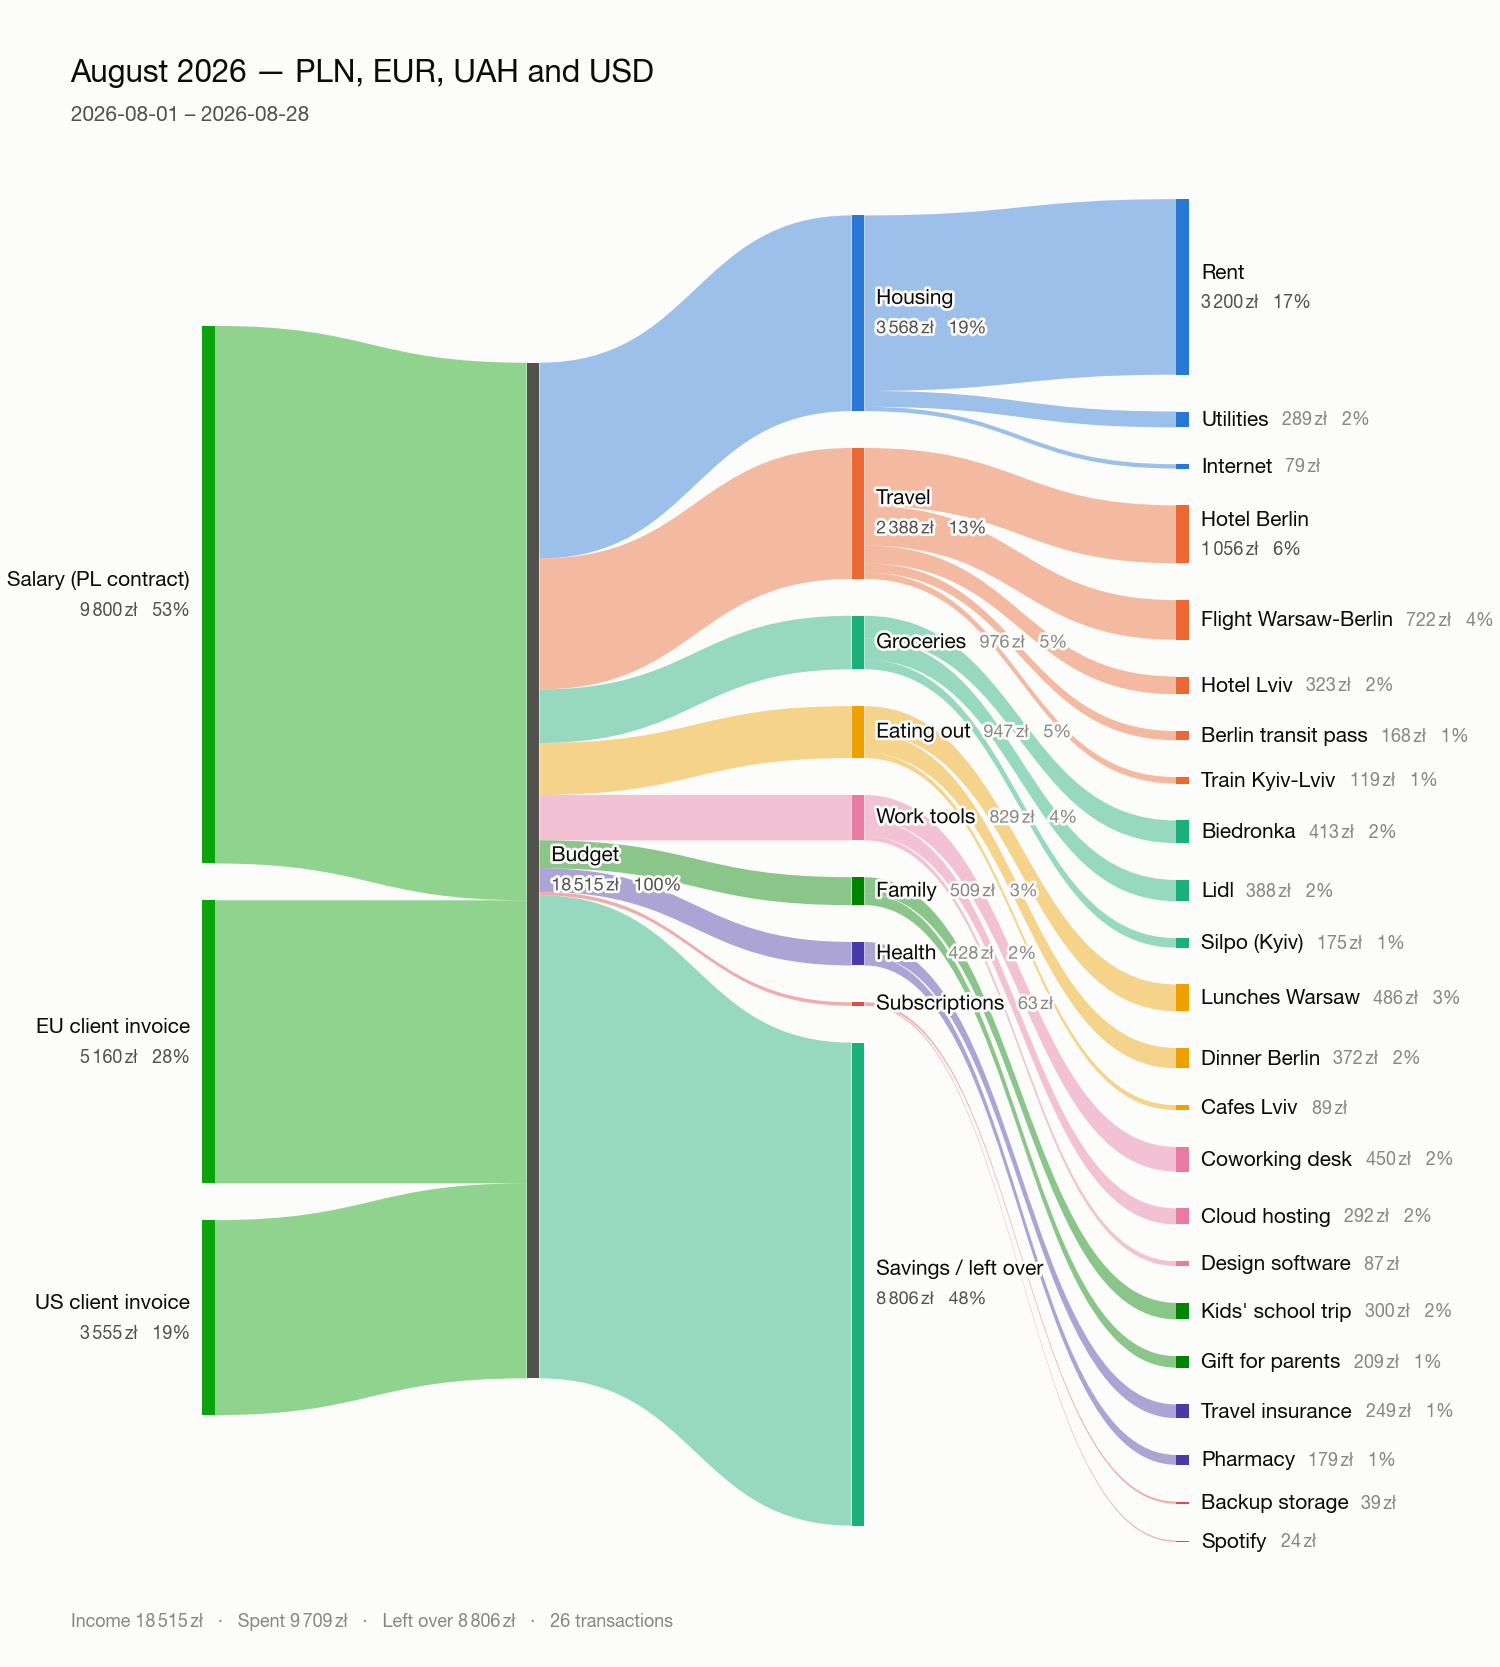
Rates can live in a file instead (--rates rates.json), as JSON or CSV:
{ "base": "PLN", "rates": { "EUR": 4.30, "USD": 3.95, "UAH": 0.095 } }
currency,rate
EUR,4.30
UAH,0.095
A --rate flag overrides the same currency in the file. Rates are never fetched
from the internet: the same input has to draw the same picture next month, and a
rate that quietly changes between two runs would break that.
Around 50 currencies — including EUR, PLN, UAH, CZK, GBP, USD, JPY and BTC —
know their own symbol, decimal places and separators, so amounts are written the
way that currency is normally written (1 234,50 zł, €1,234.50, ¥1,235).
Anything else still works and prints its ISO code. vme currencies lists them.
Forget a rate and the error tells you what to add:
error: rows are in EUR (Euro), UAH (Ukrainian hryvnia) but the report is in PLN.
Give a rate for each one, for example:  --rate EUR=4.30   (one EUR is worth 4.30 PLN)
Command line
vme render   SOURCE   draw a Sankey diagram
vme summary  SOURCE   print the same breakdown as a table
vme check    SOURCE   report anything that would stop it being plotted
vme formats           list the input formats
vme currencies        list the known currencies
vme sample   FILE     write an example file to start from
Useful render options:
| Option | Does |
|---|---|
-o out.png |
.png, .svg, .pdf or .html — picked by extension |
-c PLN |
currency the report is drawn in |
-m 2026-08 |
one month; also -y 2026 and -p START..END |
--top 8 |
keep the 8 biggest categories, fold the rest into "Other" |
--min-share 1 |
fold anything under 1% of the total |
--max-labels 6 |
most detail rows to show inside one category |
--no-detail |
stop at categories, skip the label column |
--theme dark |
dark background |
--width 1600 --dpi 200 |
image size; height scales with the row count |
--transparent |
transparent background |
--sign statement |
force how a negative amount is read |
--open |
open the file when it is done |
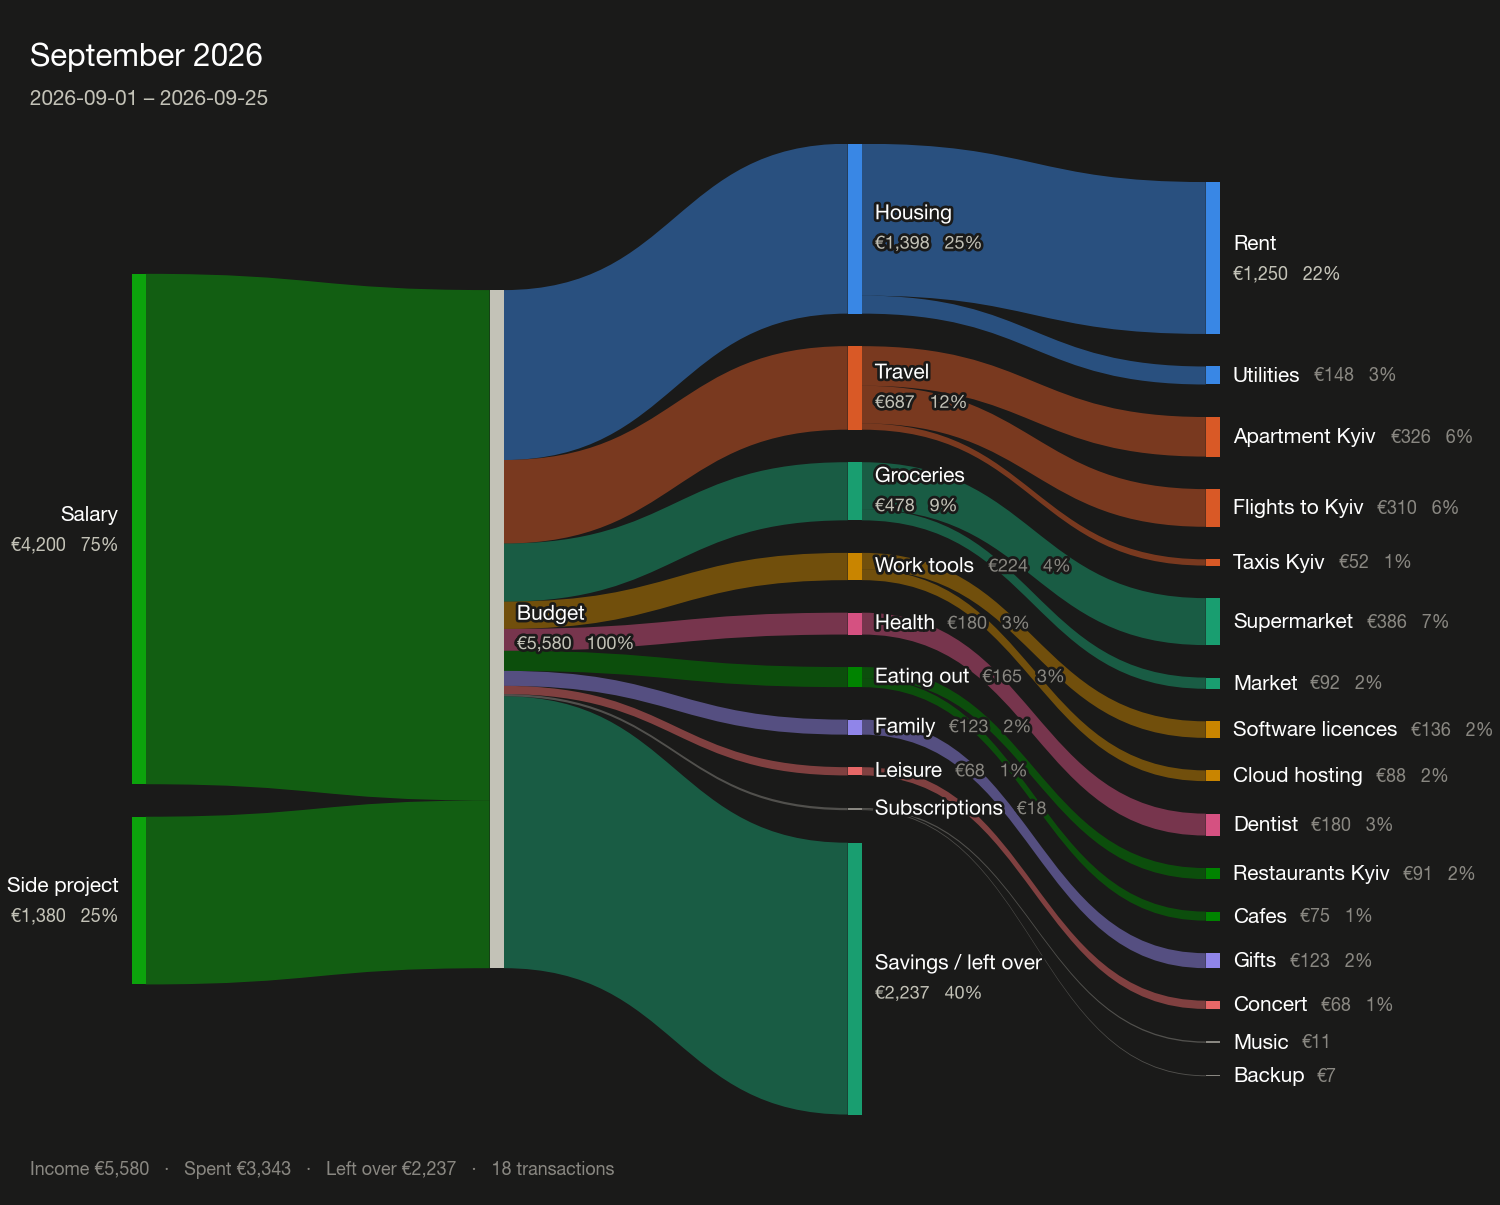
Sharing a picture in a chat app: the defaults (1600px wide, 200 dpi, light
theme) are already sized for it. For a dark-mode chat, add --theme dark.
Python API
Visualizer is the whole public surface.
from vme import Visualizer

Visualizer.from_file("august.csv", currency="PLN").create_png("august.png")
Or build the rows yourself — dicts, namedtuples and Expense objects all work:
from vme import Expense, Visualizer

rows = [
    Expense(category="Income",  label="Salary", amount=9800, currency="PLN", kind="income"),
    Expense(category="Housing", label="Rent",   amount=3200, currency="PLN"),
    Expense(category="Food",    label="Lidl",   amount=412,  currency="PLN"),
]

v = Visualizer(rows, currency="PLN", title="August 2026", theme="light")
v.print_to_console()
v.create_png("august.png", width=1600, dpi=200)
| Method | Does |
|---|---|
Visualizer.from_file(path, fmt=None, ...) |
read any supported file |
create_png(path) |
write a PNG (also .svg, .pdf) |
create_html(path) |
write an interactive plotly page — needs the html extra |
save(path) |
pick the writer from the extension |
show_plot() |
open an interactive window |
print_to_console() |
the breakdown as text |
graph() |
the SankeyGraph, if you want to draw it yourself |
problems() |
what is wrong with the rows, as a list |
Constructor arguments: currency, rates, period, sign, title,
subtitle, theme, top_categories, max_labels, min_share, detail,
show_savings, group_income, verbose.
Below Visualizer sit vme.io (loading), vme.sankey (rows → graph),
vme.plotting (graph → picture) and vme.currencies; each is usable on its own.
Development
uv sync                 # or: pip install -e ".[all]" pytest ruff
uv run pytest
uv run ruff check src tests
uv.lock pins the development environment, and CI installs from it with
--locked, so after changing a dependency in pyproject.toml run uv lock and
commit both files. The lock never reaches PyPI — pip install vme-py gets the
version ranges from pyproject.toml — and working from a clone with pip simply
ignores it.
Layout:
src/vme/
  models.py       Expense, Node, Link, SankeyGraph
  currencies.py   currency metadata, formatting, rate files
  tools.py        amount/date/direction parsing, row coercion
  io/             one module per input format, self-registering
  data_store.py   row storage, sign conventions, conversion, validation
  sankey.py       rows -> graph (folding, savings branch)
  plotting.py     layout + the matplotlib and plotly backends
  theme.py        light and dark palettes
  cli.py          the click commands
The colour palettes are checked for colour-blind separation and for contrast against their own background, and every node carries a visible label, so no reading of the chart depends on telling two colours apart.
Releasing
Every pull request is linted, tested (Linux on Python 3.9–3.14, plus macOS and
Windows) and built into a wheel that is installed and run. A merge to master
does all of that again and then publishes to PyPI — but only if the version in
pyproject.toml is not on PyPI yet. So a release is three steps:
- in the pull request, bump the version with
uv version --bump patch(orminor), which updatespyproject.tomlanduv.locktogether — editpyproject.tomlby hand and you needuv lockas well, or CI fails; - describe it in
CHANGELOG.md: a## [x.y.z]section at the top and its release link at the bottom. The tests fail without them, and the PR'sversion checkrun shows the notes as they will be published; - merge it.
CI uploads through PyPI's trusted publishing, so no API token is stored
anywhere; then it tags the commit vX.Y.Z and creates a GitHub release whose
notes are that changelog section, with the built files attached. A merge that
leaves the version alone publishes nothing. PyPI never takes the same version
twice, so a broken release is fixed by the next one.
Licence
MIT — see LICENSE.
1 maintainer

Release files for vme-py 0.1.1
For a detailed explanation of source distributions (sdists) and built distributions (wheels), please see the package formats documentation.
Source distribution (sdist)
| File | Size | Uploaded | |
|---|---|---|---|
| vme_py-0.1.1.tar.gz | 61.3 kB | Details |
Built distribution (wheel)
| File | Interpreter | ABI | Platform | Reset |
|---|---|---|---|---|
| vme_py-0.1.1-py3-none-any.whl | Python 3 | none | any | Details |
Total release size: 114.8 kB
Release files / vme_py-0.1.1.tar.gz
| Download URL | vme_py-0.1.1.tar.gz |
|---|---|
| Size | 61.3 kB |
| Tags | Source |
|
SHA-256 checksum How to use checksums |
eb4839a28990e7acd706c69abf046a97971bfe2e573de6e5edfce907c5f34eaa
|
|
BLAKE2b-256 checksum How to use checksums |
077500893341024f8f356fba2aec42cb22b688798129ee3541153c30e2043022
|
| Upload date | |
|
Uploaded using Trusted Publishing? What is trusted publishing? |
Yes |
| Uploaded via |
twine/7.0.0 CPython/3.13.14
|
Provenance
Provenance describes where a file came from. On PyPI, provenance is shared via attestations, which provide a verifiable record of the build or publishing details. View details, limitations and caveats.


PyPI Publish Attestation
PyPI verified that this artifact, at this checksum, originated from the publisher listed below.
Signed by GitHub Actions, verified by PyPI on Sep 24, 2026.
Transparency logRelease files / vme_py-0.1.1-py3-none-any.whl
| Download URL | vme_py-0.1.1-py3-none-any.whl |
|---|---|
| Size | 53.5 kB |
| Tags | Python 3 |
|
SHA-256 checksum How to use checksums |
b5c0da9fa5657d7c74c42ddf06af69eef496f08e7024e3d65133c5fcb1d1f6e7
|
|
BLAKE2b-256 checksum How to use checksums |
fb037db41bea5fe63a84ae59dc54aa97b82b24ef50dcd5ae0bd0549734ad95b3
|
| Upload date | |
|
Uploaded using Trusted Publishing? What is trusted publishing? |
Yes |
| Uploaded via |
twine/7.0.0 CPython/3.13.14
|
Provenance
Provenance describes where a file came from. On PyPI, provenance is shared via attestations, which provide a verifiable record of the build or publishing details. View details, limitations and caveats.
PyPI Publish Attestation
PyPI verified that this artifact, at this checksum, originated from the publisher listed below.
Signed by GitHub Actions, verified by PyPI on Sep 24, 2026.
Transparency log













