
vpcatlas






Website · Documentation · Releases · Docker Hub · MIT licence
Read-only AWS network discovery. vpcatlas connects to one AWS account with auditor
permissions, maps its whole network (accounts, regions, VPCs, subnets, routing, gateways, endpoints,
load balancers, firewalls, DNS resolver, shared resources, the DNS and edge layer (Route 53, CloudFront, WAF, ACM, Shield), compute (ECS, EKS, EC2 instance groups, Lambda, API Gateway), data stores (RDS, ElastiCache, EFS, S3, DynamoDB) and account services (CloudTrail, GuardDuty, Config, CloudWatch, KMS, ECR)) and produces:
- a detailed inventory (JSON, Markdown and HTML), with a section for every external account that is linked to yours;
- architecture diagrams in draw.io (
.drawio) and Lucidchart (.lucid) with the AWS Architecture Icons look, following the layout of the AWS Managed Services multi-account landing zone network reference: https://docs.aws.amazon.com/managedservices/latest/onboardingguide/malz-network-arch.html; - a live dashboard (FastAPI) that refreshes the diagrams periodically and exports them.
Cross-account links are tracked as well: Transit Gateways shared through AWS RAM, VPC peering with accounts you do not own, endpoints and Resolver rules shared with you. They show up as external accounts in the diagrams and in the inventory.
What it looks like

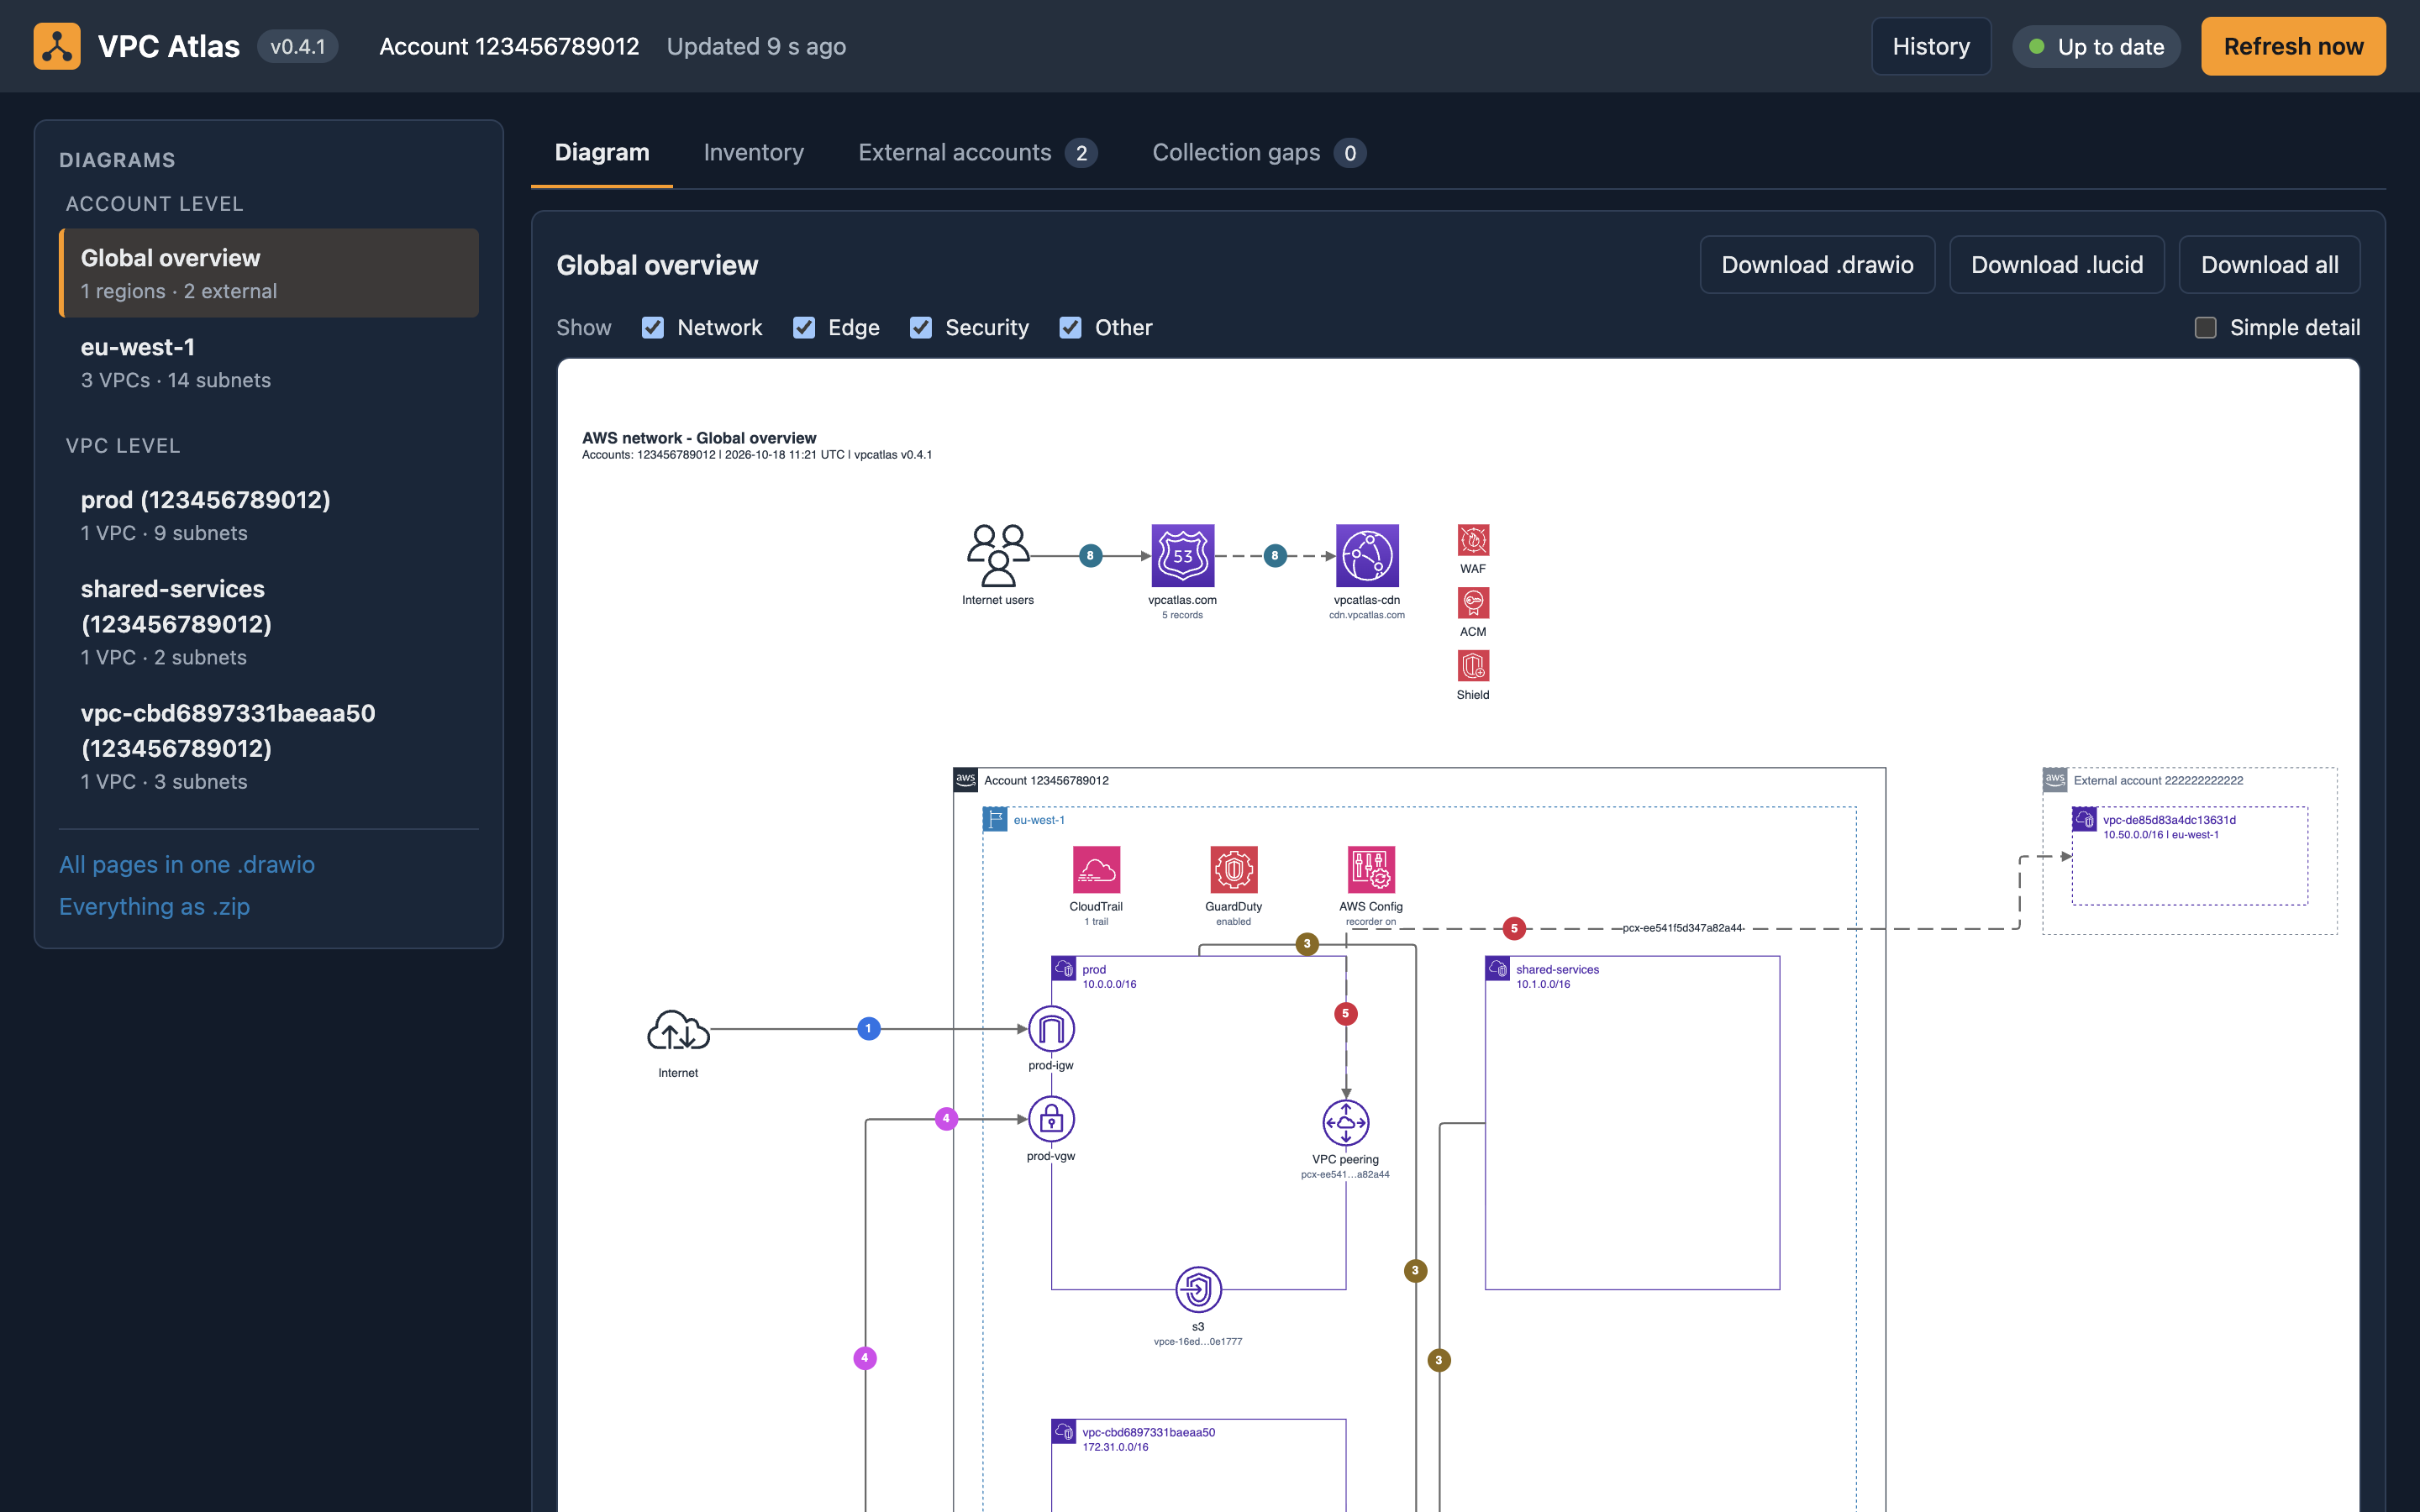
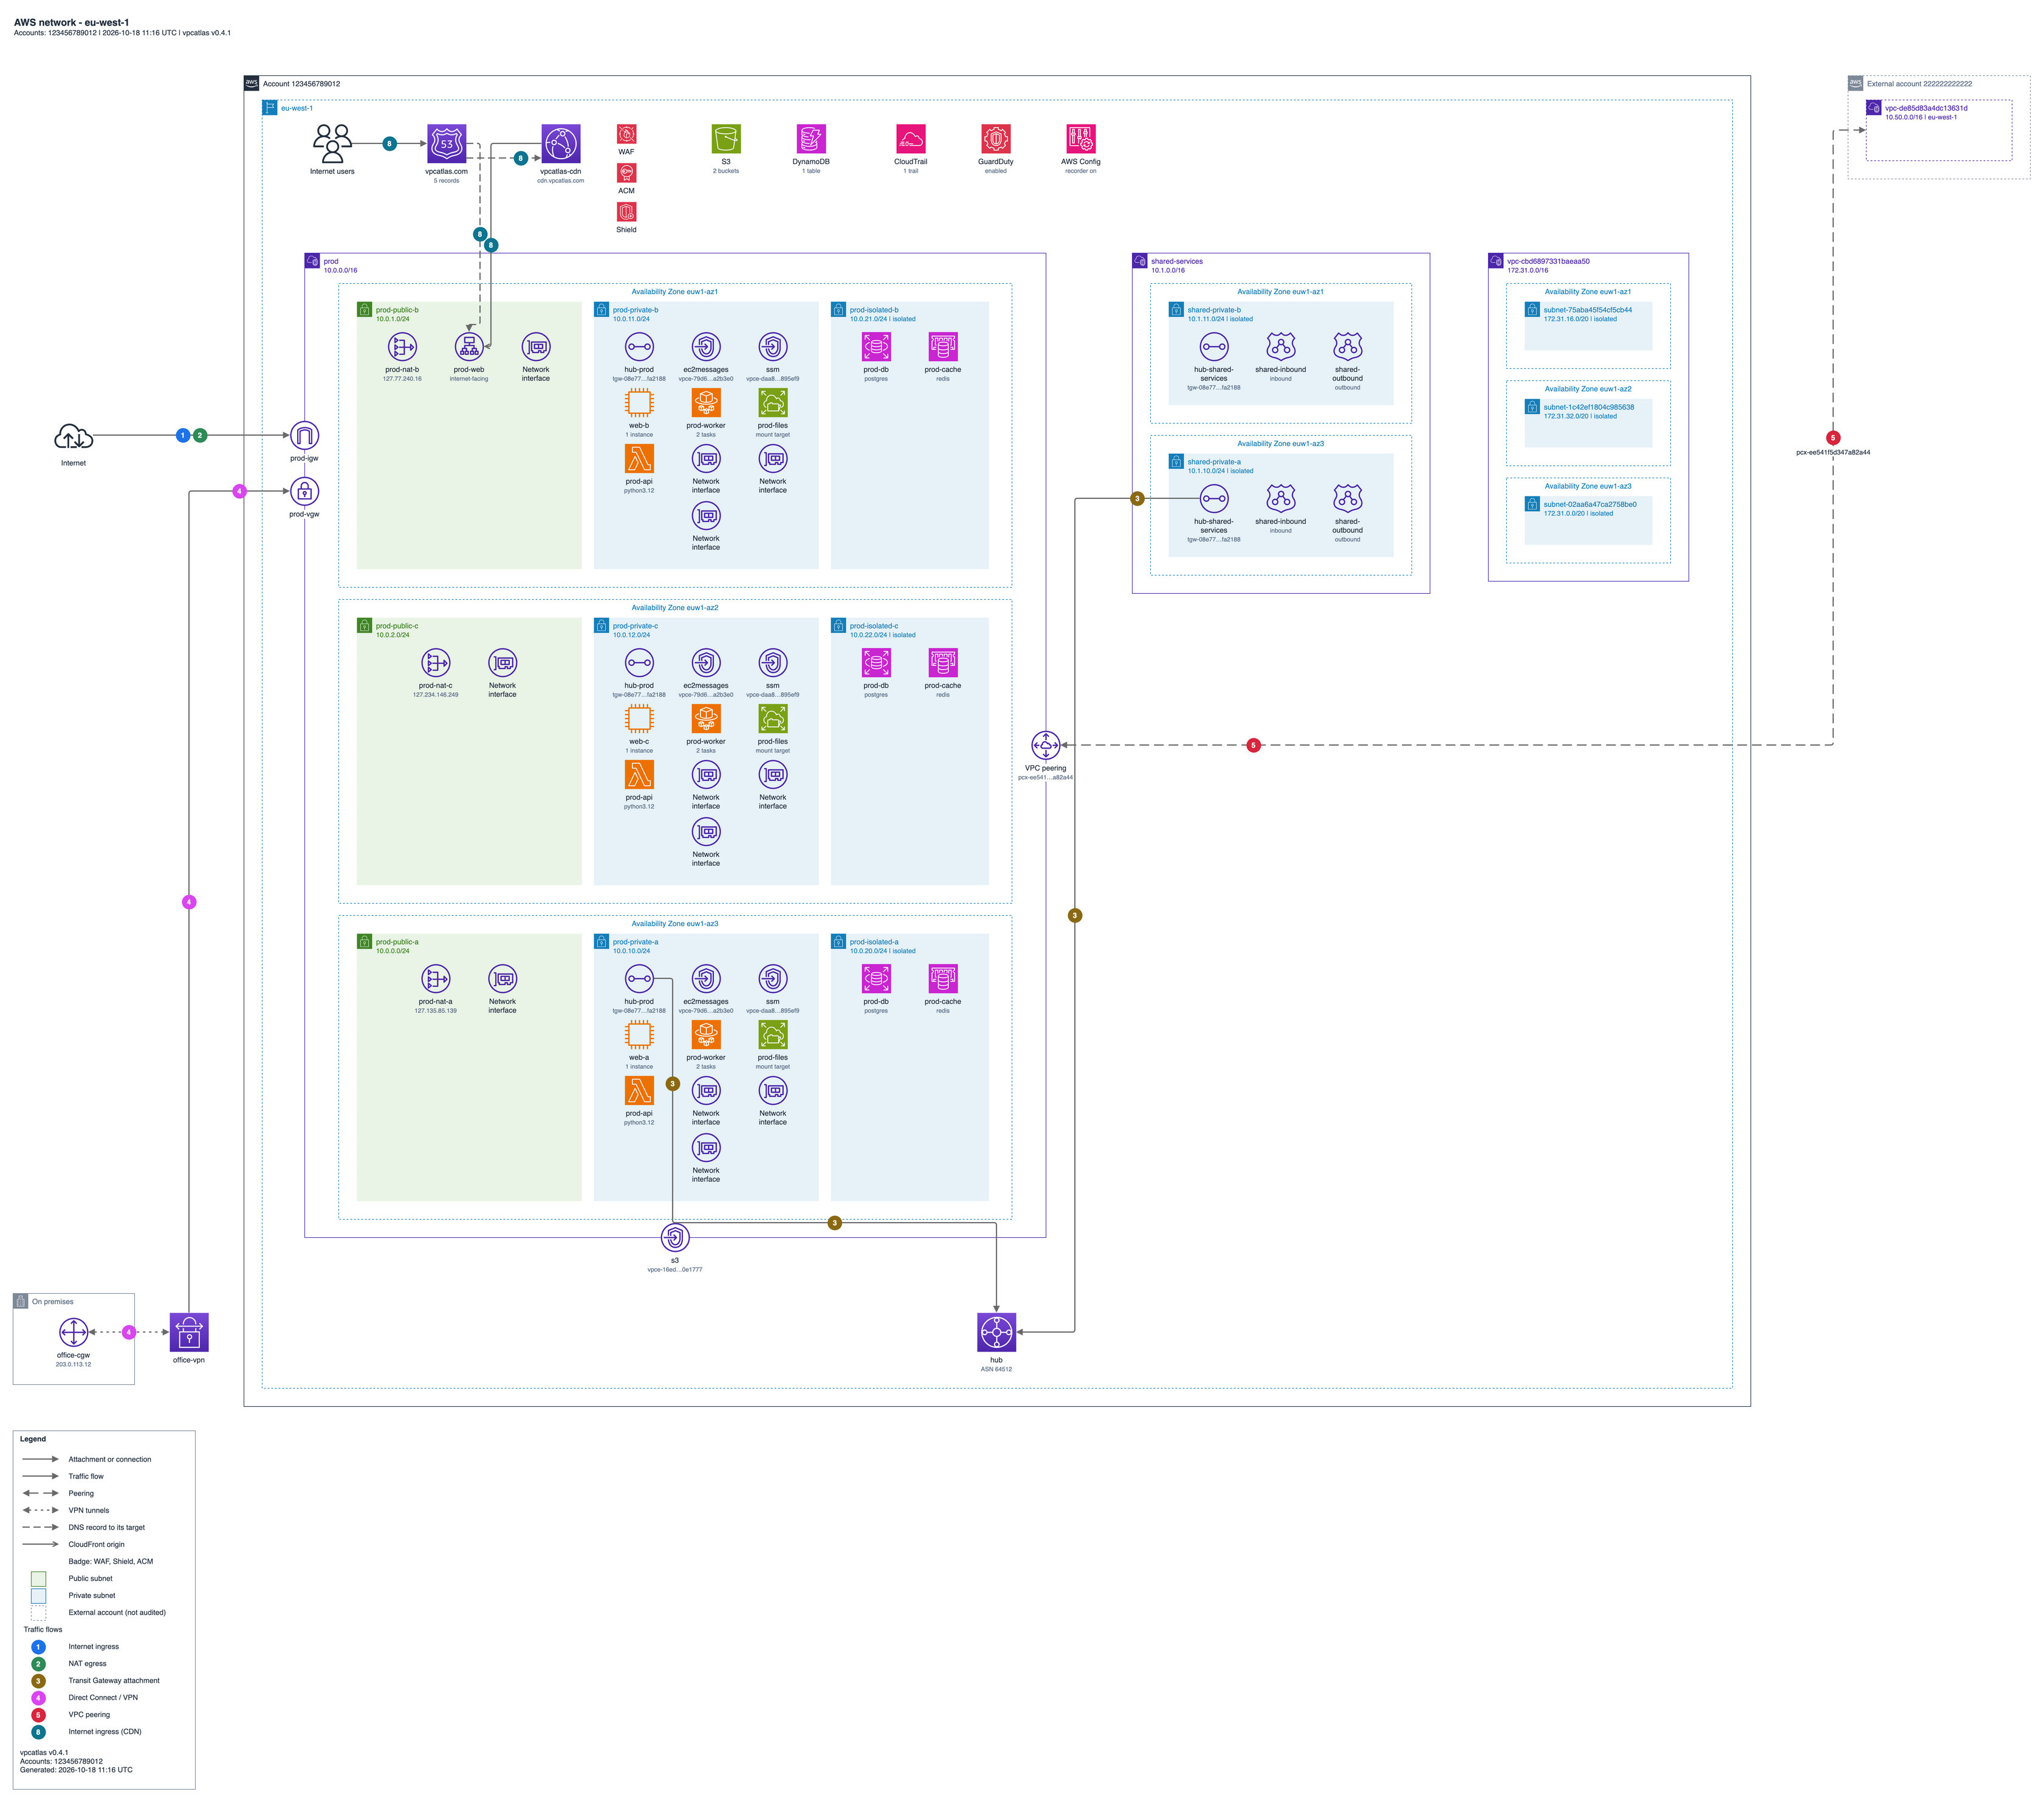
| Dashboard | Region diagram (eu-west-1) |
|---|---|
 |
 |
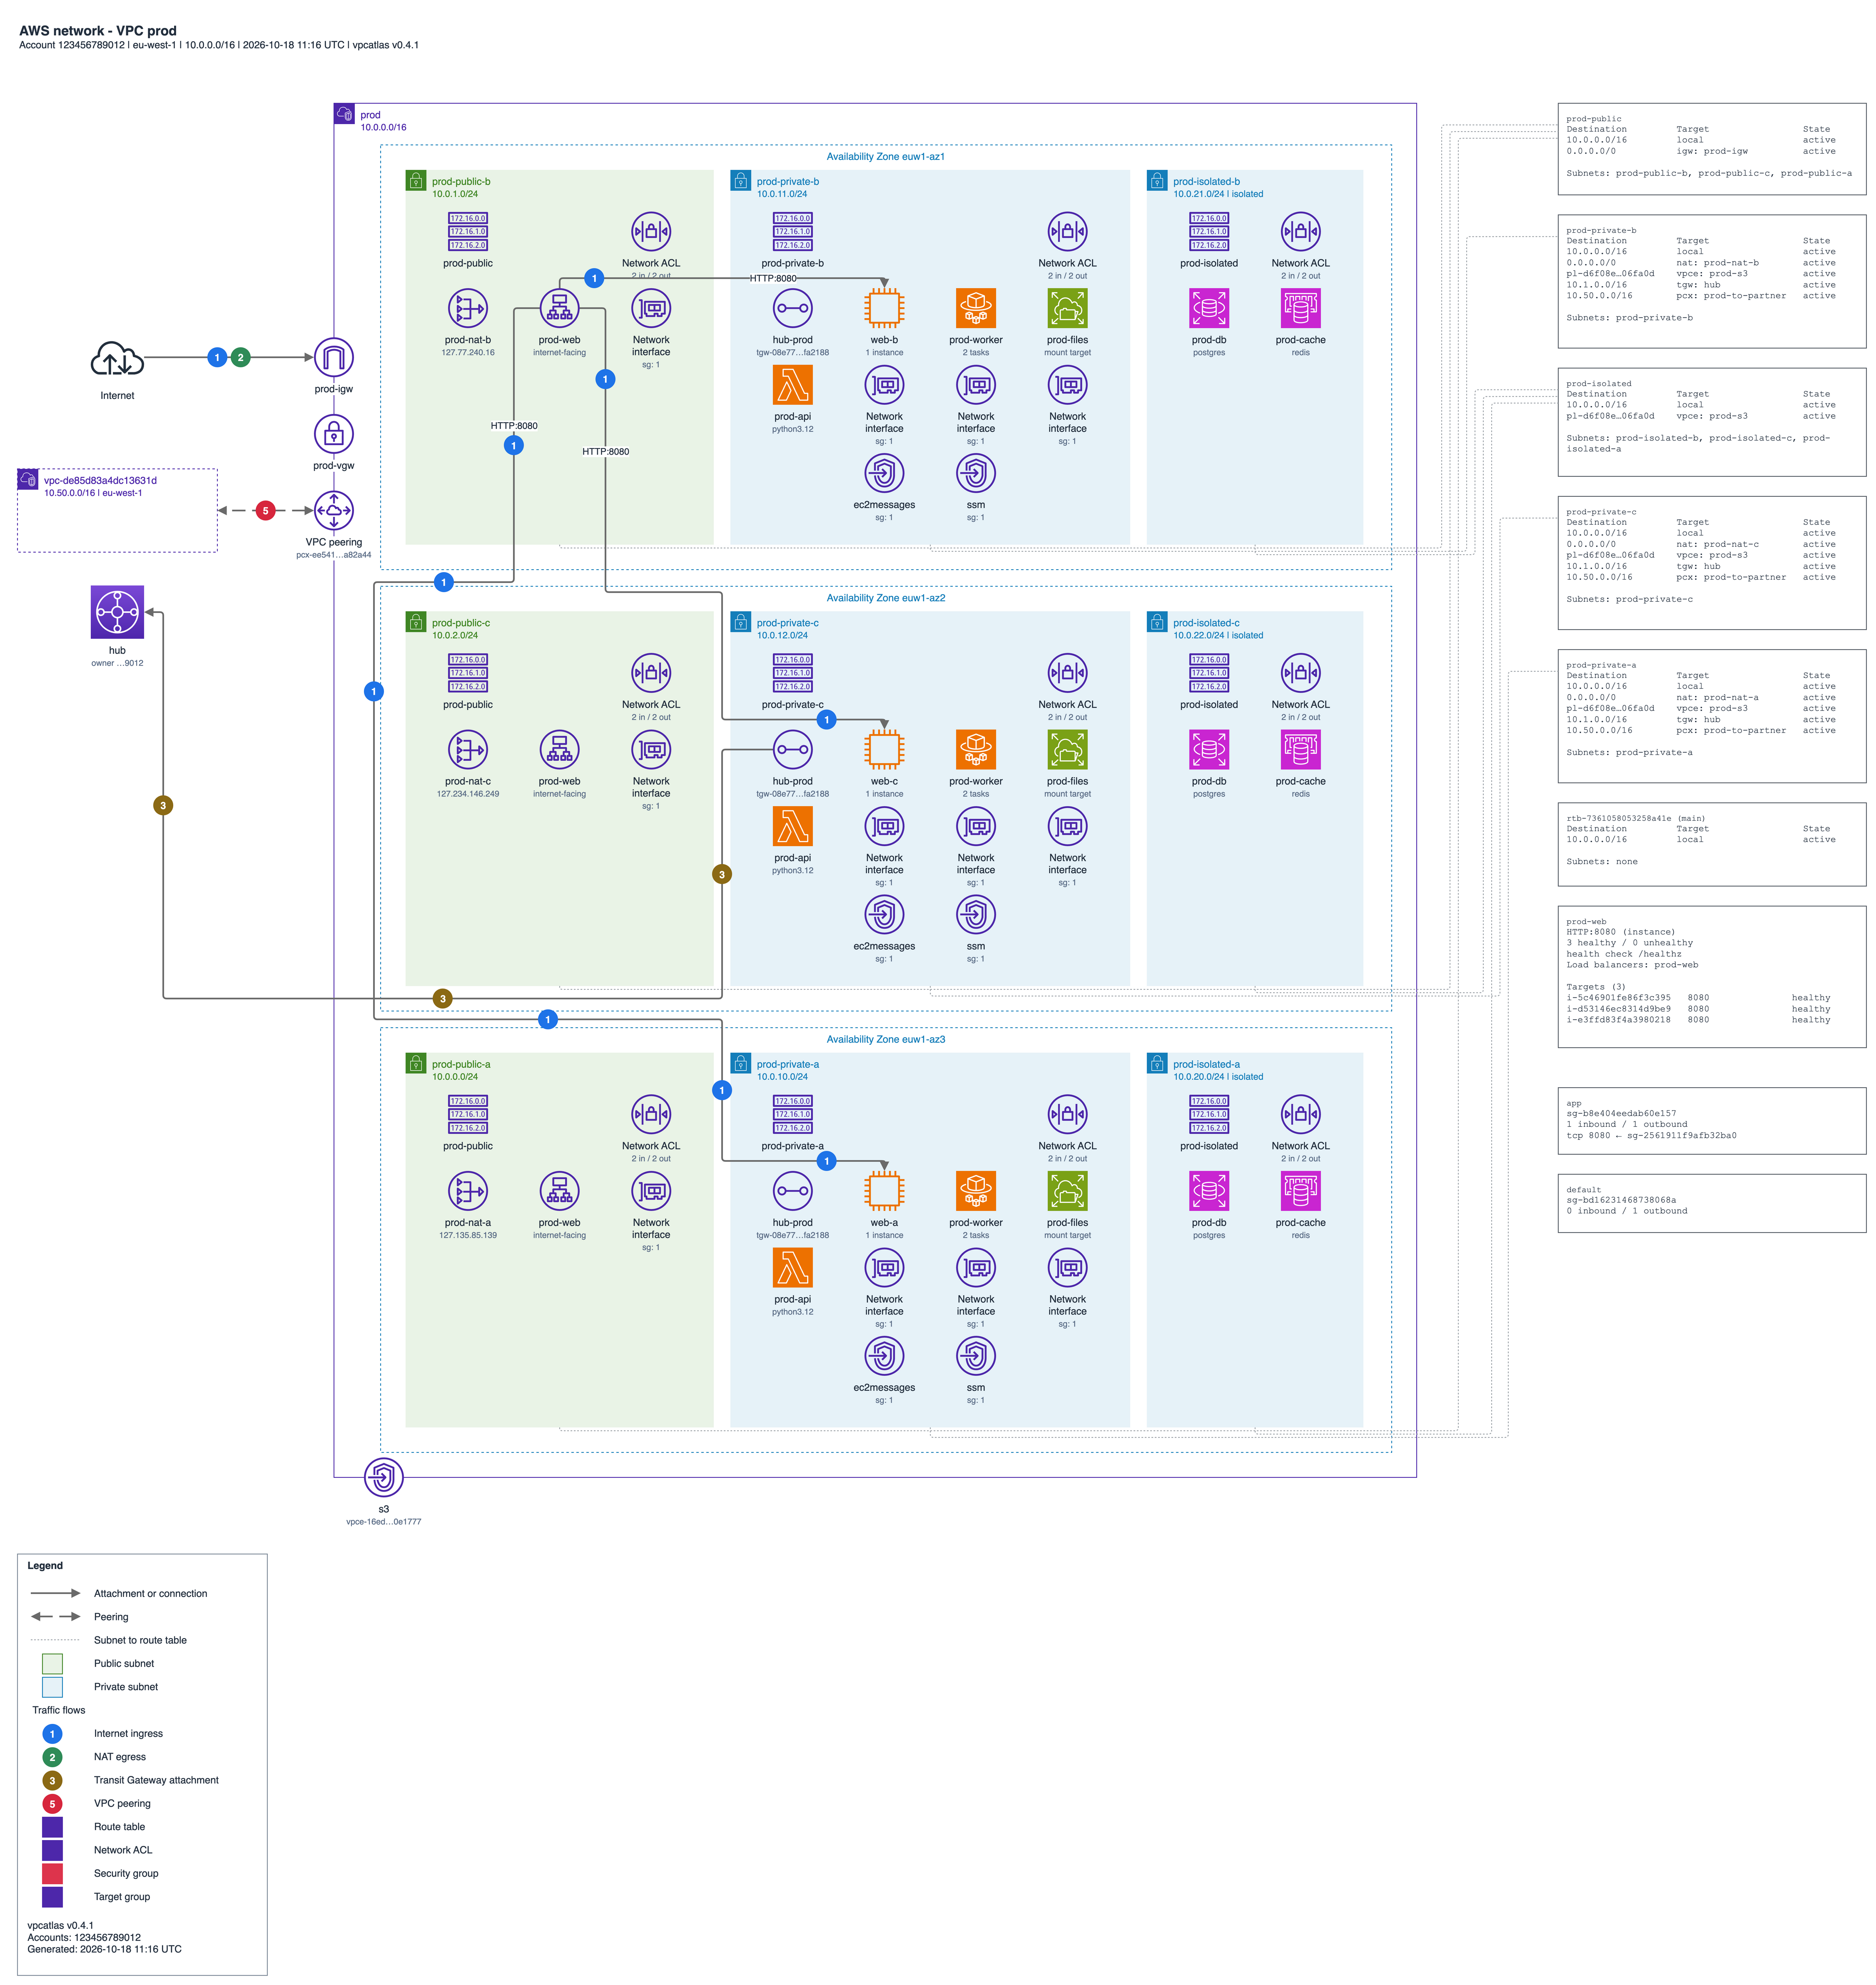
One VPC page: subnets, routing and numbered flows.
The recording and the diagrams come from scripts/demo.sh running against a simulated AWS account (moto), and the dashboard image is a capture of vpcatlas serve on the same account, so the ids you see are examples. See demo/README.md.
Status: alpha. Only read API calls are made. Nothing is created, changed or deleted in AWS.
Install
Every channel includes the dashboard (vpcatlas serve), so there is nothing extra to install for it.
Binary (Linux and macOS, x86_64 and arm64; Windows x86_64). A folder with Python and every dependency inside, so no Python is needed, and it starts in a few seconds. The script checks the SHA-256 of the download against the release before it installs anything:
curl -fsSL https://vpcatlas.com/install.sh | sh
vpcatlas --version
On Windows, in PowerShell:
irm https://vpcatlas.com/install.ps1 | iex
vpcatlas --version
On Linux and macOS it puts the folder in ~/.local/share/vpcatlas/<version>/ and links vpcatlas to it from
/usr/local/bin when that is writable and from ~/.local/bin otherwise. Set VPCATLAS_INSTALL_DIR to choose the
directory of the link, VPCATLAS_HOME to choose where the folder goes and VPCATLAS_VERSION (for example 0.1.0)
to pin a version. On Windows it puts the folder in %LOCALAPPDATA%\vpcatlas\<version>\, writes the launcher
vpcatlas.cmd in %LOCALAPPDATA%\Programs\vpcatlas and adds that directory to your user PATH; the same variables
work there, for example $env:VPCATLAS_INSTALL_DIR.
The archives, including the Windows one, are also on the releases page
with a SHA256SUMS file.
Python package (Python 3.12 or newer):
pipx install git+https://github.com/karina-pp/vpcatlas
vpcatlas --help
Docker (linux/amd64 and linux/arm64). The image runs the vpcatlas command; with no arguments it serves the
dashboard on port 8080:
# Dashboard on http://127.0.0.1:8080, reading AWS with the profile "audit"
docker run --rm -p 127.0.0.1:8080:8080 -v "$HOME/.aws:/home/atlas/.aws:ro" \
  vpcatlas/vpcatlas serve --host 0.0.0.0 --profile audit

# Any other command, with the diagrams written to ./vpcatlas-out
docker run --rm -v "$HOME/.aws:/home/atlas/.aws:ro" -v "$PWD/vpcatlas-out:/data" \
  vpcatlas/vpcatlas discover --profile audit --regions eu-west-1 --output-dir /data
On Linux add --user "$(id -u):$(id -g)" -e HOME=/home/atlas so the container can read ~/.aws and write to the
output folder. A credential_process profile needs its helper binary, which the image does not contain. An SSO profile
works from the mounted cache while its token is valid; for a long run, or when the token may expire, pass short-lived keys
instead with -e AWS_ACCESS_KEY_ID -e AWS_SECRET_ACCESS_KEY -e AWS_SESSION_TOKEN.
CLI
# Discover the account and write every output format
vpcatlas discover --profile audit --regions eu-west-1,us-east-1 --output-dir ./out --format all

# Assume a role in the target account instead of using a profile
vpcatlas discover --role-arn arn:aws:iam::111122223333:role/AtlasAuditor --regions eu-west-1 \
  --output-dir ./out --format drawio

# Inventory and diagrams from a previous discovery
vpcatlas inventory --cache ./out/vpcatlas-graph.json --format md
vpcatlas diagram --cache ./out/vpcatlas-graph.json --format lucid

# Print the minimal auditor policy
vpcatlas iam-policy > auditor-policy.json
vpcatlas discover accepts --format drawio|lucid|json|md|html|all. Progress is shown with Rich.
Service filters
A large account draws hundreds of nodes, and one repeated icon (API Gateway, say) can take most of the page.
vpcatlas discover, vpcatlas inventory and vpcatlas diagram take a service filter, a comma separated
list of service keys. The VPC core (regions, VPCs, subnets, route tables, gateways, interfaces, security
groups and network ACLs) is always kept.
| Option | Commands | Effect |
|---|---|---|
--exclude-services apigateway,lambda |
discover, inventory, diagram |
Leave these services out. discover skips their AWS calls, so the scan is shorter. |
--include-services lambda,s3 |
discover, inventory, diagram |
Keep only these services besides the VPC core. |
The two options exclude each other, and an unknown key is an error that lists the valid ones:
acm, apigateway, cloudfront, cloudtrail, cloudwatch, config, directconnect, dynamodb, ec2
(the instances), ecr, ecs, efs, eks, elasticache, elbv2 (load balancers and target groups),
endpoints, guardduty, kms, lambda, network-firewall, peering, prefix-lists, ram, rds,
route53, route53resolver, s3, shield, tgw, vpn and wafv2.
# A scan and diagrams without API Gateway and Lambda
vpcatlas discover --exclude-services apigateway,lambda

# The same filter on a graph that was discovered in full
vpcatlas diagram --cache ./out/vpcatlas-graph.json --exclude-services apigateway
The filter is recorded in the metadata of vpcatlas-graph.json (excluded_services). Drawing from a graph
that lacks services prints a warning on stderr, so a partial diagram is not mistaken for a complete one.
Diagram levels
Diagrams come at two levels. vpcatlas discover and vpcatlas diagram pick them with
--level account|vpc|all (default all).
| Level | Pages | Files |
|---|---|---|
account |
The Global overview and one page per Region: VPCs, subnets, gateways, peerings and the Transit Gateway topology | vpcatlas-global, vpcatlas-<region> |
vpc |
One page per VPC, in more detail: route tables with their routes and associations, network ACLs per subnet, security groups, the subnets in full and every interface endpoint by name | vpcatlas-vpc-<id> |
# Only the VPC pages, as draw.io files
vpcatlas diagram --cache ./out/vpcatlas-graph.json --level vpc --format drawio
The summary prints how many pages each level produced. The dashboard lists both levels in its sidebar,
under "Account level" and "VPC level", and serves the very files vpcatlas diagram writes. On its History
page, "View changes on diagram" draws the changes between two snapshots on those pages
(/diff/<older>/<newer>): what was added is framed in green and what changed in orange.
Layers and simple detail
Every draw.io page has one layer per family of services: Network (the containers and the VPC plumbing), Edge (CloudFront, Route 53, ACM, WAF, Shield, load balancers), API Gateway, Compute, Data and Security; a family the page does not use has no layer. Open the file in diagrams.net and use the layers panel (Ctrl+Shift+L) to hide a family with one click, no new scan or render. An edge sits on the layer of its source, except an edge that ends on API Gateway, which sits with it, so hiding API Gateway hides its edges too. Boxes carry absolute coordinates, so a container does not drag its contents along when you move it.
vpcatlas diagram --detail simple draws a card instead of a crowd: inside a container, more than 3 resources
of one service become one icon captioned API Gateway ×77, and their edges are merged into one per pair,
labelled with the count. The default, --detail full, draws every resource. The edge lane (APIs, distributions)
is folded before the page is laid out, so the page is smaller and quicker to draw; Lucid files fold the lane
too, but not the crowds inside the VPCs.
vpcatlas diagram --cache ./out/vpcatlas-graph.json --format drawio --detail simple
Credentials
vpcatlas reads credentials the way the AWS CLI does, and secret keys are never command flags: keys come from the standard credential chain, so they stay out of your shell history and process list.
# 1. Default chain: AWS_ACCESS_KEY_ID / AWS_SECRET_ACCESS_KEY (and AWS_SESSION_TOKEN) in the environment,
#    or the shared files ~/.aws/credentials and ~/.aws/config
export AWS_ACCESS_KEY_ID=... AWS_SECRET_ACCESS_KEY=...
vpcatlas discover --regions eu-west-1

# 2. A named profile, including SSO profiles (run "aws sso login --profile audit" first)
vpcatlas discover --profile audit

# 3. Assume a role, with an external ID when the trust policy asks for one
vpcatlas discover --role-arn arn:aws:iam::111122223333:role/AtlasAuditor --external-id my-external-id

# 4. A role that requires MFA
vpcatlas discover --role-arn arn:aws:iam::111122223333:role/AtlasAuditor \
  --mfa-serial arn:aws:iam::999988887777:mfa/alice --mfa-token 123456

# 5. Length and name of the assumed-role session (900 to 43200 seconds, default 3600; name default "vpcatlas")
vpcatlas discover --role-arn arn:aws:iam::111122223333:role/AtlasAuditor \
  --session-duration 7200 --role-session-name audit-2026

# 6. Several accounts into one graph: repeat --profile, or repeat --role-arn
vpcatlas discover --profile prod --profile staging
vpcatlas discover --profile hub --role-arn arn:aws:iam::111122223333:role/AtlasAuditor \
  --role-arn arn:aws:iam::444455556666:role/AtlasAuditor
Roles that come with the runtime need no option at all, because the chain finds them: the instance profile
on EC2, the task role on ECS and Fargate, the pod role on EKS (IRSA through web identity, or EKS Pod
Identity) and the execution role of a Lambda function. Run vpcatlas serve or vpcatlas discover there
as is, and add --role-arn only to reach other accounts from that identity.
--external-id, --session-duration and --role-session-name also read VPCATLAS_EXTERNAL_ID,
VPCATLAS_SESSION_DURATION and VPCATLAS_ROLE_SESSION_NAME, which is how the dashboard container is
configured. --mfa-serial and --mfa-token belong to discover, inventory and diagram: a one-time code
cannot be reused, so the long-running vpcatlas serve does not take them.
Dashboard
vpcatlas serve --port 8080
# or with a periodic refresh every 15 minutes
VPCATLAS_REFRESH_SECONDS=900 vpcatlas serve --port 8080
Routes:
| Route | Content |
|---|---|
GET / |
List of diagrams and an interactive viewer (diagrams.net viewer) |
GET /api/graph |
Network graph as JSON |
GET /api/inventory |
Inventory as JSON |
GET /export/{region}.drawio |
Regional diagram, draw.io format (?detail=simple folds crowded services into cards) |
GET /export/{region}.lucid |
Regional diagram, Lucidchart format |
POST /refresh |
Run a discovery now |
Above each diagram, one check box per family of services the page draws (Network, Edge, API Gateway, Compute,
Data, Security) hides or shows that family in the browser, with no new scan; the choice is remembered in the
browser, and "Simple detail" draws and downloads the page with detail=simple.
Permissions
The tool needs read-only access. Use the policy this project publishes in
deploy/iam/auditor-policy.json (printed by vpcatlas iam-policy); the AWS managed
ReadOnlyAccess also works for a short run of the CLI in a sandbox account, but it reads far more than the tool needs.
Details, including cross-account AssumeRole trust policies, are in docs/iam.md.
Access denied on a single service is logged and skipped, so the rest of the discovery still runs.
Output formats
| Format | File | Use |
|---|---|---|
| JSON | vpcatlas-graph.json, vpcatlas-inventory.json |
Versioned schema, for automation |
| Markdown | vpcatlas-inventory.md |
Review and pull requests |
| HTML | vpcatlas-inventory.html |
Browsable inventory |
| draw.io | diagrams/vpcatlas-<region>.drawio, diagrams/vpcatlas-global.drawio, diagrams/vpcatlas-vpc-<id>.drawio |
Editable diagrams in diagrams.net |
| Lucidchart | diagrams/vpcatlas-<region>.lucid, diagrams/vpcatlas-global.lucid, diagrams/vpcatlas-vpc-<id>.lucid |
Import with Lucid Standard Import |
One diagram is produced per region, plus a global diagram with the Transit Gateway and peering topology (account level), and one per VPC (VPC level, see Diagram levels).
Documentation
- Architecture: pipeline and modules
- Diagram style: AWS look rules for draw.io and Lucid
- Coverage: AWS APIs read by each collector
- IAM: permissions and cross-account access
- Deploy: Docker, Lambda, Kubernetes and ECS
How it is built and released
Every change goes through the same public pipeline, and you can check what comes out of it.
- On every change: lint (ruff, actionlint, zizmor), type check (mypy), the tests on Linux, macOS and Windows with a coverage gate, the docs and the Python package build, both Docker images with their smoke tests (the Lambda one through the Runtime Interface Emulator) and a Trivy scan, the installers on three systems, and a dependency review.
- On every release: binaries for five platforms,
SHA256SUMS, an SBOM, signed and attested images, a Trivy gate before anything is pushed, and a last job that installs the published release with the live installers. - Every night:
pip-audit, a link check, the layout benchmark and a scan of the published image. CodeQL, OpenSSF Scorecard and Dependabot run weekly.
Verify what you install
gh attestation verify vpcatlas-X.Y.Z-linux-x86_64.tar.gz --owner karina-pp
gh attestation verify SHA256SUMS --owner karina-pp
gh attestation verify oci://index.docker.io/vpcatlas/vpcatlas:X.Y.Z --owner karina-pp
cosign verify index.docker.io/vpcatlas/vpcatlas:X.Y.Z --certificate-identity-regexp '^https://github.com/karina-pp/vpcatlas/' --certificate-oidc-issuer https://token.actions.githubusercontent.com
Images and SBOMs are signed and attested from 0.4.1 on, the first release made by this pipeline; earlier releases
carry only the attestations of the archives and SHA256SUMS. Verifying the image signature needs cosign 3 or newer.
More in How VPC Atlas is built and released; the runs are on the Actions page. To report a vulnerability, see SECURITY.md; to contribute, see CONTRIBUTING.md.
Roadmap
v1 (0.x): discovery of networking resources and cross-account links, JSON/Markdown/HTML inventory, draw.io and Lucid diagrams, CLI, FastAPI dashboard, container images for Lambda, Kubernetes and ECS.
v2: Network Manager and Cloud WAN topologies, Direct Connect and VPN path tracing, drift between two snapshots, diagram diffs in pull requests, multi-account runs from an AWS Organizations list.
License
MIT. Copyright Karina Pérez.
1 maintainer

Metadata
1 maintainer
Release files for vpcatlas 0.4.2
For a detailed explanation of source distributions (sdists) and built distributions (wheels), please see the package formats documentation.
Source distribution (sdist)
| File | Size | Uploaded | |
|---|---|---|---|
| vpcatlas-0.4.2.tar.gz | 5.0 MB | Details |
Built distribution (wheel)
| File | Interpreter | ABI | Platform | Reset |
|---|---|---|---|---|
| vpcatlas-0.4.2-py3-none-any.whl | Python 3 | none | any | Details |
Total release size: 6.3 MB
Release files / vpcatlas-0.4.2.tar.gz
| Download URL | vpcatlas-0.4.2.tar.gz |
|---|---|
| Size | 5.0 MB |
| Tags | Source |
|
SHA-256 checksum How to use checksums |
3f59ab8f917de5b9bd664e1cd4302b99dfc95cf4dde04fe6c77f5ce84e3db9d5
|
|
BLAKE2b-256 checksum How to use checksums |
8bf409ce44f0124f18e479eecb5f20986cb10ffbbb0f4c752d99ca301b3962f4
|
| Upload date | |
|
Uploaded using Trusted Publishing? What is trusted publishing? |
Yes |
| Uploaded via |
twine/7.0.0 CPython/3.13.14
|
Provenance
Provenance describes where a file came from. On PyPI, provenance is shared via attestations, which provide a verifiable record of the build or publishing details. View details, limitations and caveats.


PyPI Publish Attestation
PyPI verified that this artifact, at this checksum, originated from the publisher listed below.
Signed by GitHub Actions, verified by PyPI on Oct 18, 2026.
Transparency logRelease files / vpcatlas-0.4.2-py3-none-any.whl
| Download URL | vpcatlas-0.4.2-py3-none-any.whl |
|---|---|
| Size | 1.3 MB |
| Tags | Python 3 |
|
SHA-256 checksum How to use checksums |
da4710be679a9f207625eba48af9538bf2066a8fa7ec21567f3a6bf6917747bb
|
|
BLAKE2b-256 checksum How to use checksums |
d5607e1bb9e7683961ed665cbe9f9480b25e16a62059d1d14163c614d959aef0
|
| Upload date | |
|
Uploaded using Trusted Publishing? What is trusted publishing? |
Yes |
| Uploaded via |
twine/7.0.0 CPython/3.13.14
|
Provenance
Provenance describes where a file came from. On PyPI, provenance is shared via attestations, which provide a verifiable record of the build or publishing details. View details, limitations and caveats.
PyPI Publish Attestation
PyPI verified that this artifact, at this checksum, originated from the publisher listed below.
Signed by GitHub Actions, verified by PyPI on Oct 18, 2026.
Transparency log













