

VueGen is a Python package that automates the creation of scientific reports.
| Information | Links |
|---|---|
| Package |      |
| Documentation |     |
| Build |   |
| Examples |   |
| Discuss on GitHub |   |
| Cite |  |
Table of contents:
- About the project
- Installation
- Example for Earth Microbiome Project data
- Starting from a folder
- Running VueGen in Docker or nextflow
- GUI
- Case studies
- Web application deployment
- License
- Contributing
- Credits and acknowledgements
- Citation
- Contact and feedback
- FAQ
About the project
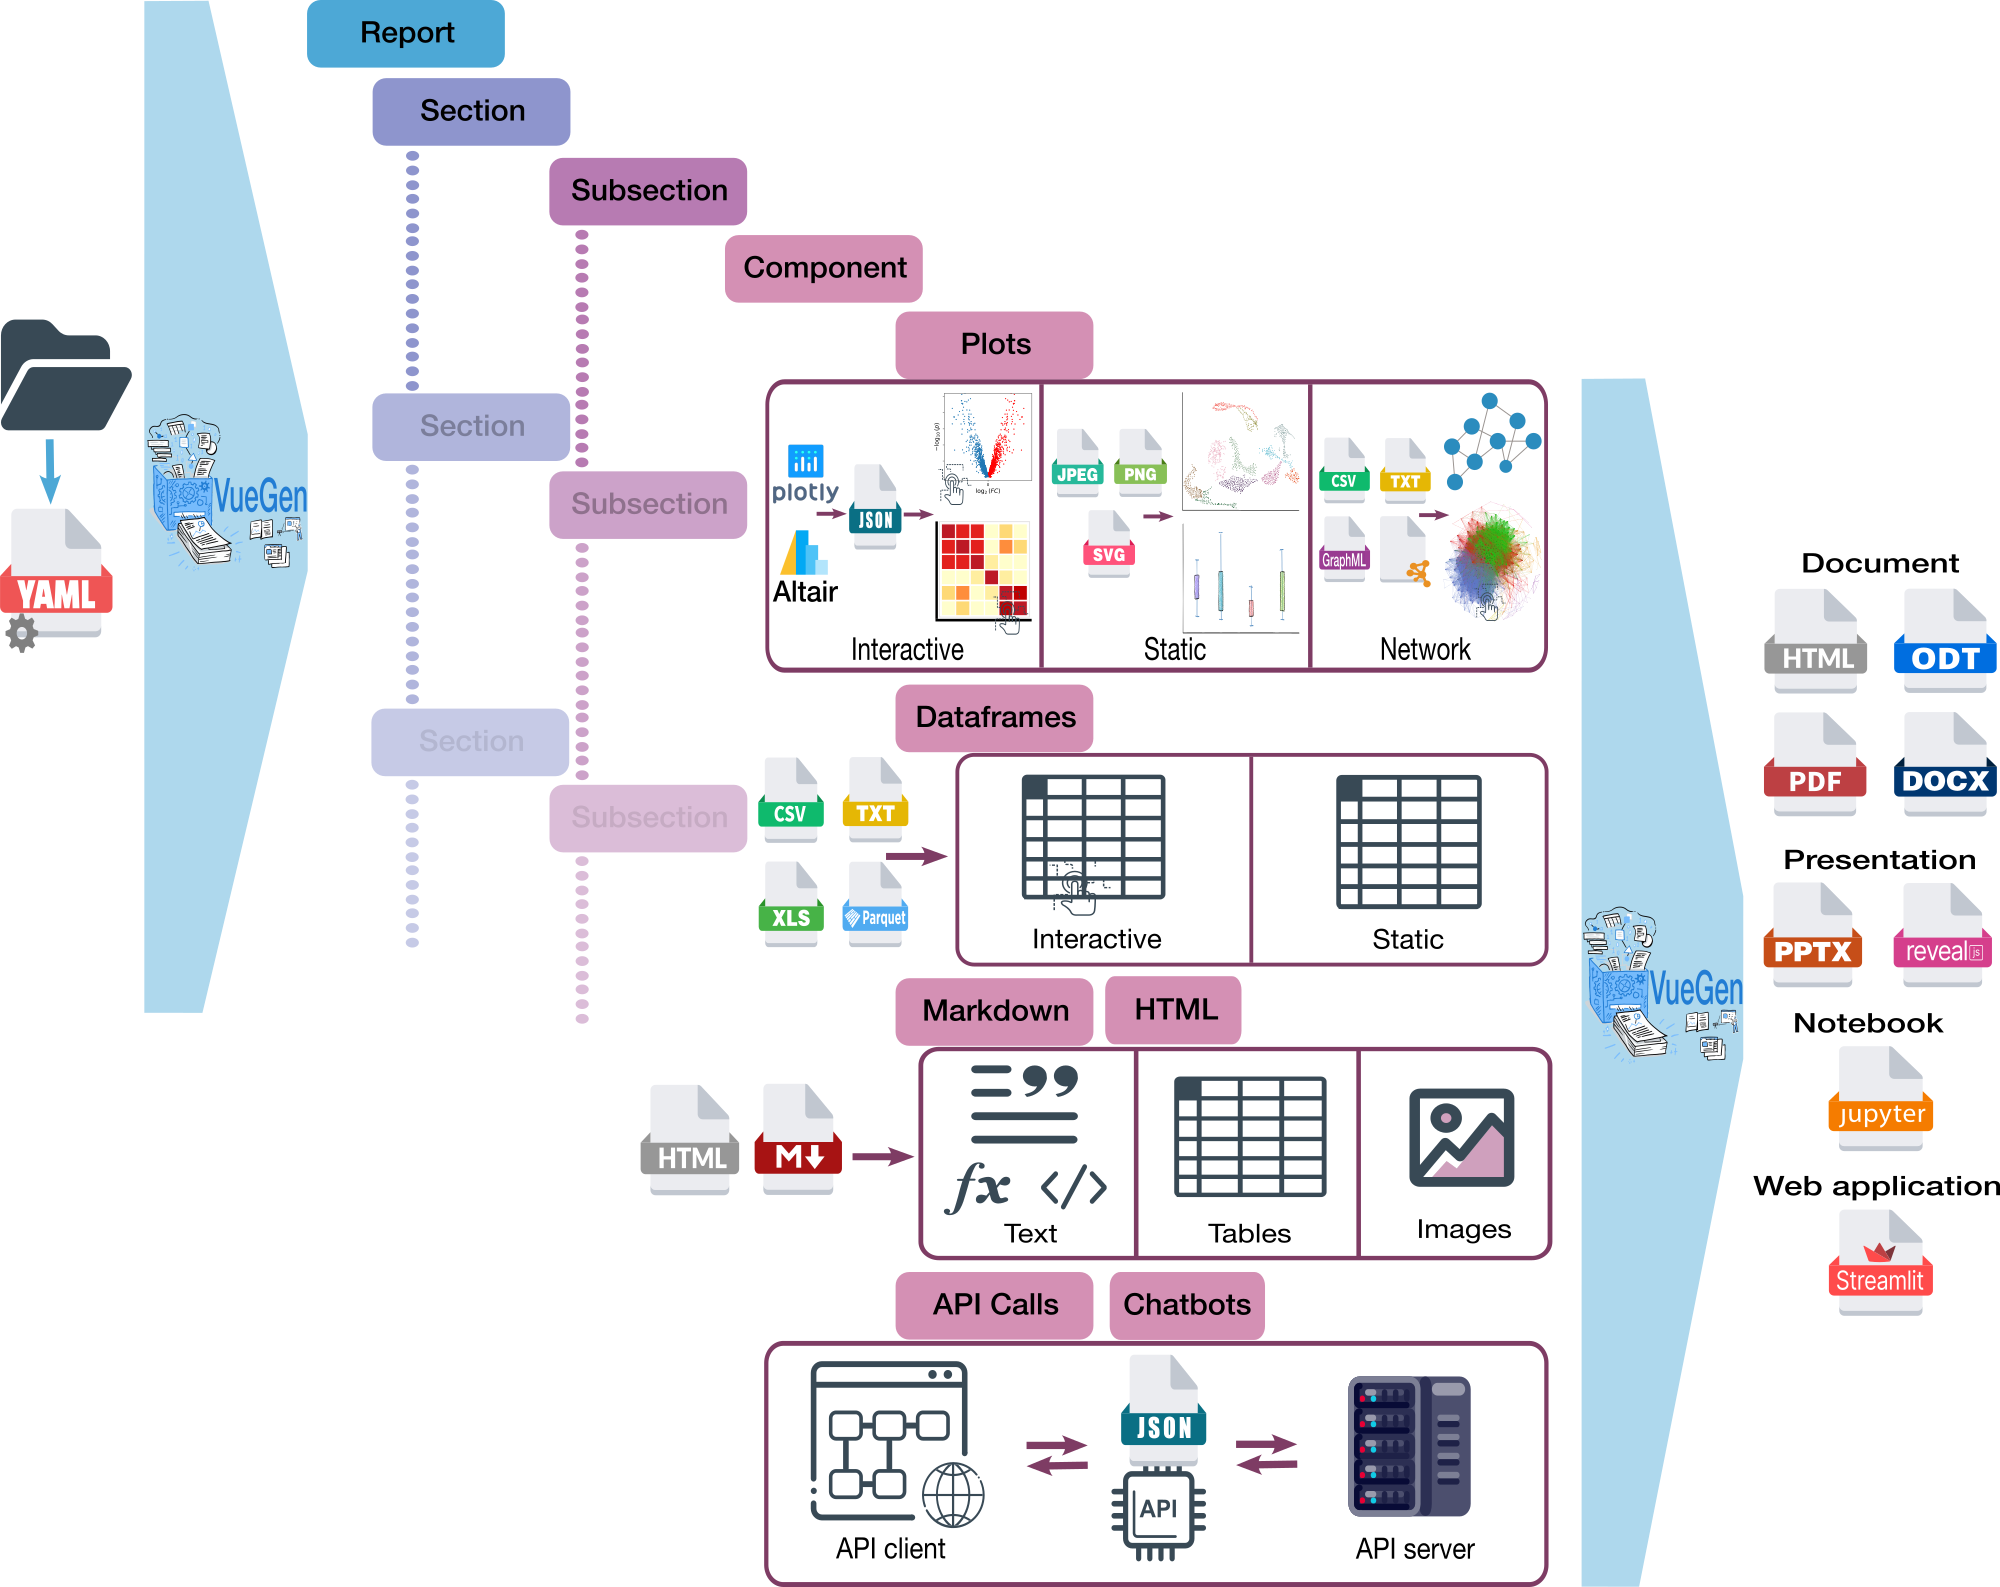
VueGen is a tool that automates the creation of reports from bioinformatics outputs, allowing researchers with minimal coding experience to communicate their results effectively. With VueGen, users can produce reports by simply specifying a directory containing output files, such as plots, tables, networks, Markdown text, HTML components, and API calls, along with the report format. Supported formats include documents (PDF, HTML, DOCX, ODT), presentations (PPTX, Reveal.js), Jupyter notebooks, and Streamlit web applications.
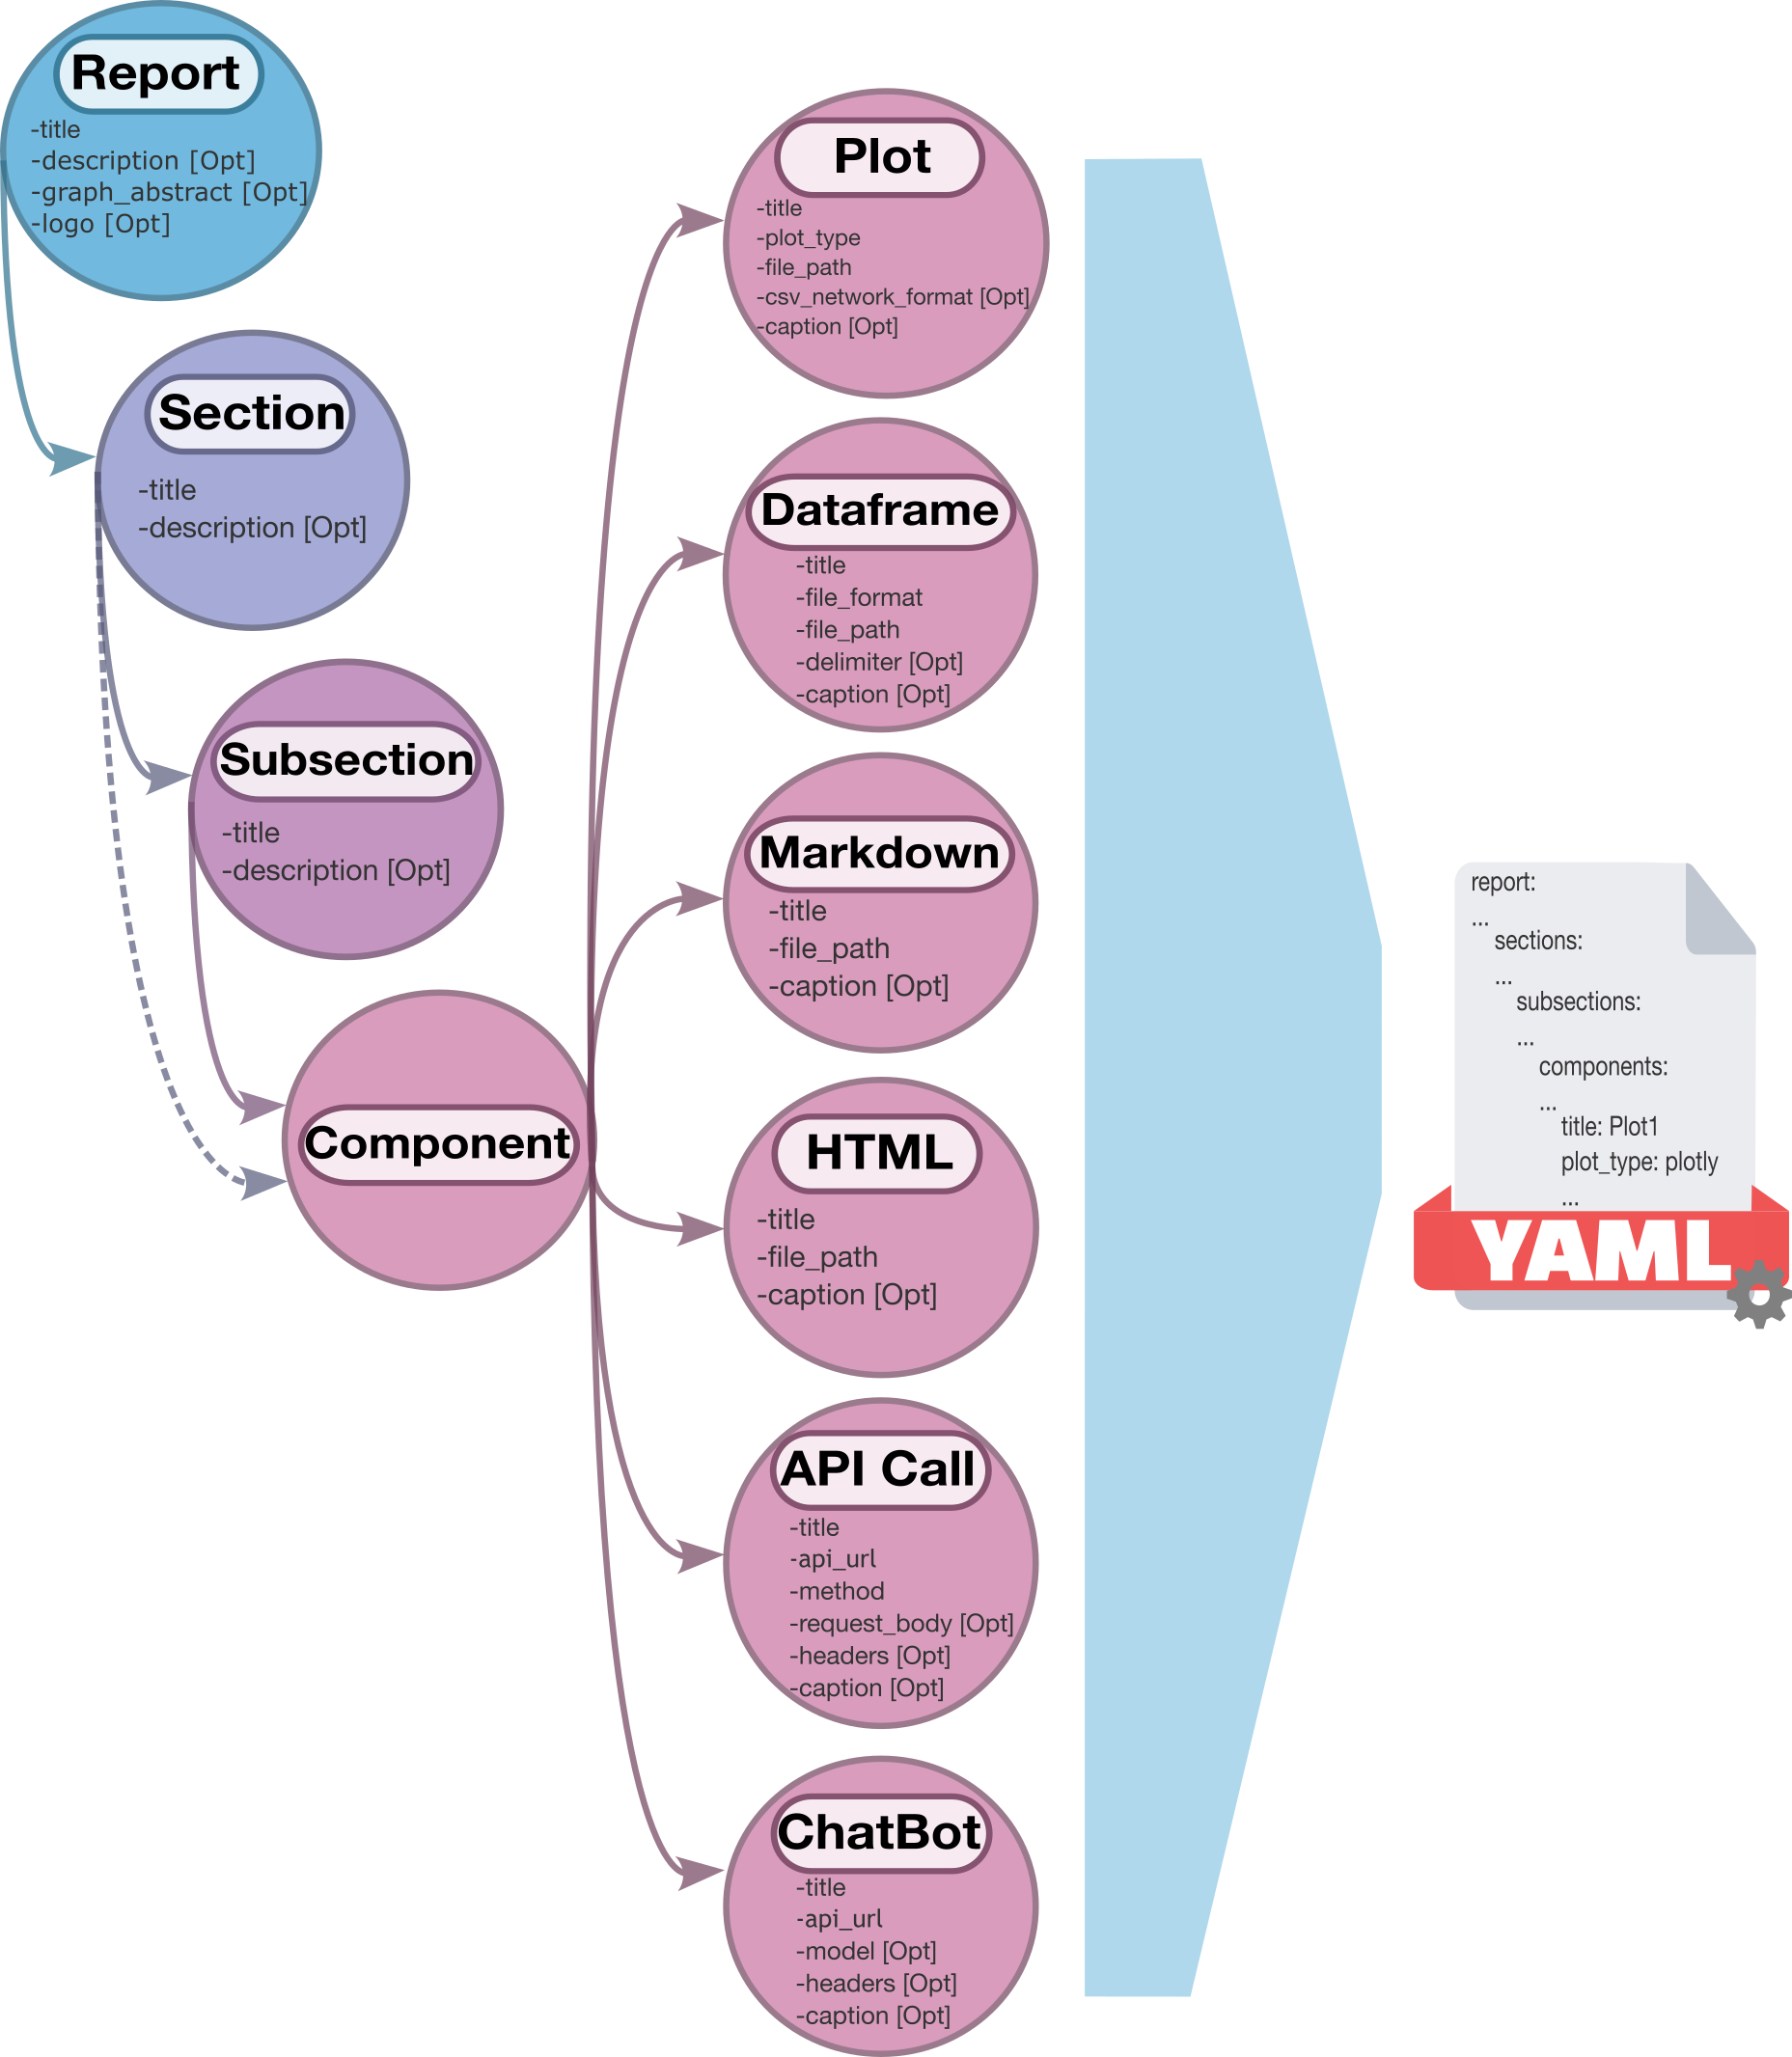
A YAML configuration file is generated from the directory to define the structure of the report. Users can customize the report by modifying the configuration file, or they can create their own configuration file instead of passing a directory as input. The configuration file specifies the structure of the report, including sections, subsections, and various components such as plots, dataframes, markdown, html, and API calls.
An overview of the VueGen workflow is shown in the figure below:
We created a schema diagram to illustrates the structure of the configuration file and the relationships between its elements:
Also, the class diagram for the project's current version is presented below to show the architecture and relationships between classes:
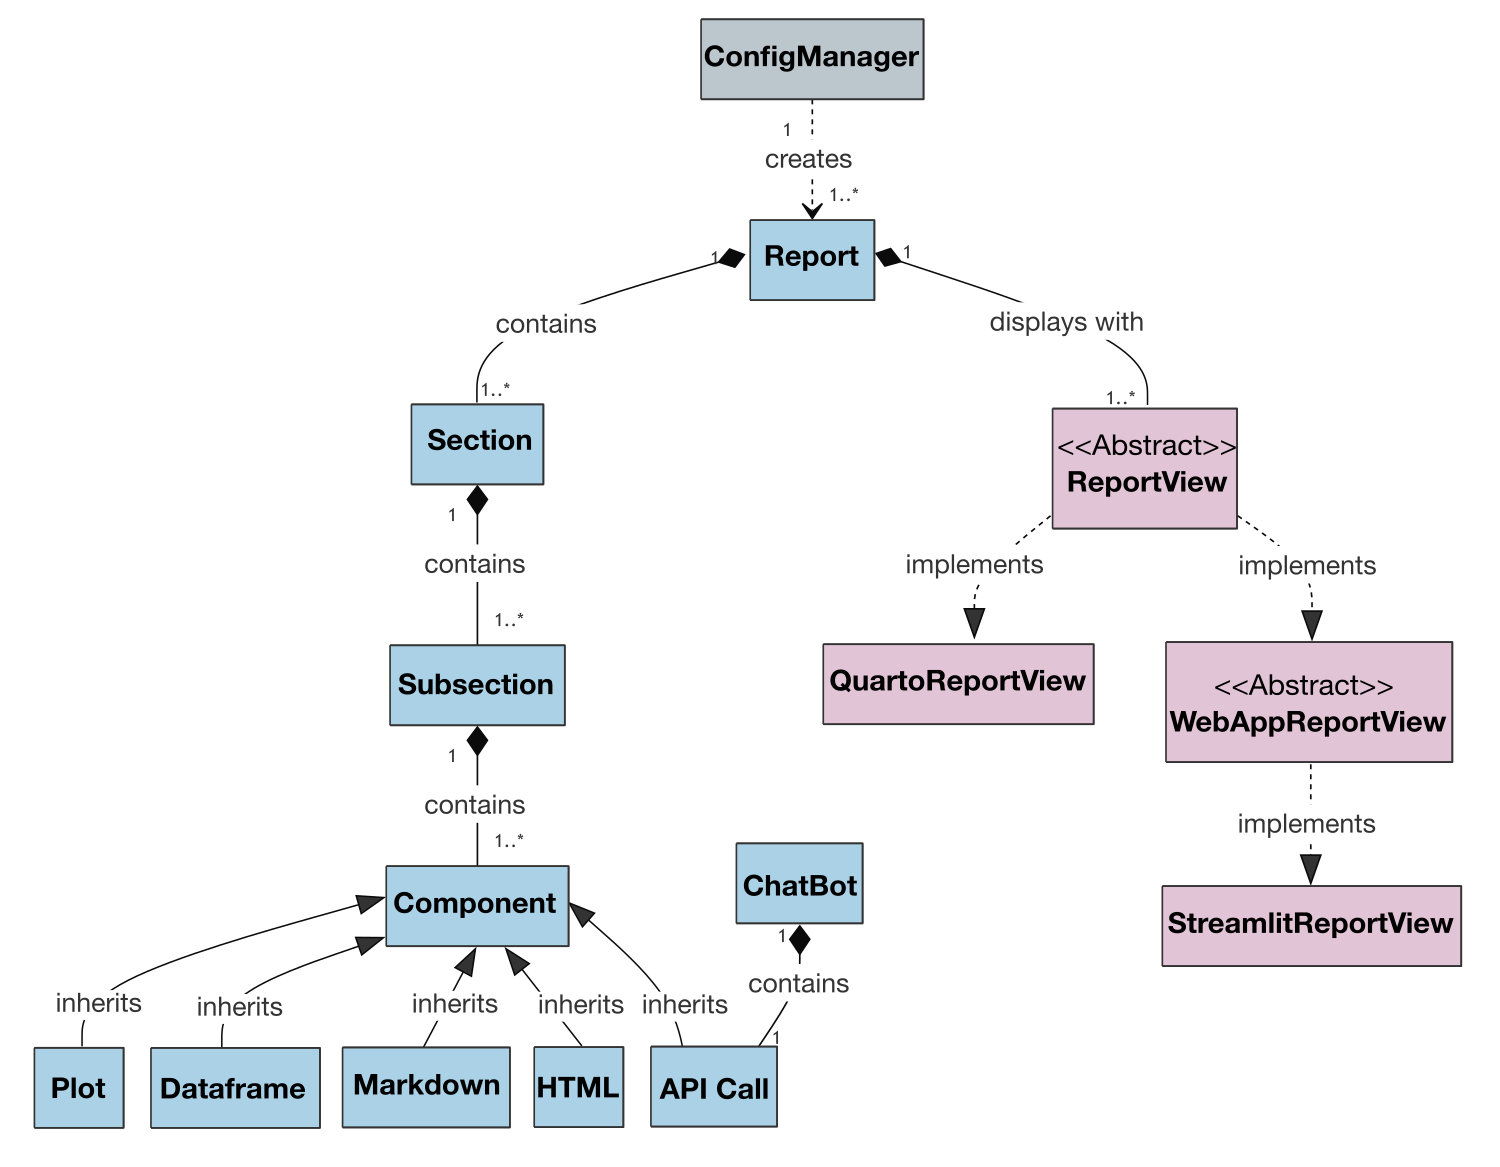
An extended version of the class diagram with attributes and methods is available here.
The VueGen documentation is available at vuegen.readthedocs.io, where you can find detailed information of the package’s classes and functions, installation and execution instructions, and case studies to demonstrate its functionality.
Installation
Pip
VueGen is available on PyPI and can be installed using pip:
pip install vuegen
You can also install the package for development by cloning this repository and running the following command:
pip install -e .
Conda
VueGen is also available on Bioconda and can be installed using conda:
conda install -c bioconda -c conda-forge vuegen
Dependencies
VueGen uses Quarto to generate various report types. The pip insallation includes quarto using the quarto-cli Python library. To test if quarto is installed in your computer, run the following command:
quarto check
For PDF reports, you need to have a LaTeX distribution installed. This can be done with quarto using the following command:
quarto install tinytex
Docker
If you prefer not to install VueGen on your system, a pre-configured Docker container is available. It includes all dependencies, ensuring a fully reproducible execution environment. See the Execution section for details on running VueGen with Docker. The official Docker images are available at quay.io/dtu_biosustain_dsp/vuegen. The Dockerfiles to build the images are available here.
Nextflow and nf-core
VueGen is also available as a nf-core module, customised for compatibility with the Nextflow environment. This module is designed to automate report generation from outputs produced by other modules, subworkflows, or pipelines. Asumming that you have nextflow and nf-core installed, you can use the following command to install the nf-core module:
nf-core modules install vuegen
Example for Earth Microbiome Project data
Run VueGen using a directory with the following command:
vuegen --directory docs/example_data/Earth_microbiome_vuegen_demo_notebook --report-type streamlit
Starting from a folder
Your input directory should follow a nested folder structure, where first-level folders are treated as sections and second-level folders as subsections, containing the components (plots, tables, networks, Markdown text, and HTML files). If the component files are in the first-level folders, an overview subsection will be created automatically. It's good practice to include a description.md file in each section and subsection to provide context and explanations for the contents. The description.md files are rendered as the section or subsection description, and they are not added as components in the report.
Here is an example layout:
report_folder/
├── section1/
│   ├── description.md
│   ├── table1.tsv
│   └── subsection1/
│       ├── chart.json
│       ├── description.md
│       ├── image1.png
│       └── table2.csv
├── section2/
│   ├── description.md
│   ├── image2.jpg
│   ├── subsection1/
│   │   ├── description.md
│   │   ├── network_plot.graphml
│   │   └── summary_table.xls
│   └── subsection2/
│       ├── description.md
│       ├── report.html
│       └── summary.md
├── description.md
└── home_image.png
The titles for sections, subsections, and components are extracted from the corresponding folder and file names, and afterward, users can add descriptions, captions, and other details to the configuration file. Component types are inferred from the file extensions and names. The order of sections, subsections, and components can be defined using numerical suffixes in folder and file names.
Run for an initial html report the following command.
vuegen --directory report_folder --report-type html
This will create a config file which is used to build the report.
Configuration file
It's also possible to provide a configuration file instead of a directory. Most likely, you will want to create a configuration file from a directory, and then modify it to customize the report. The configuration file is in YAML format, which is human-readable and easy to edit. You can specify titles and descriptions for sections and subsections, as well as component paths and required attributes, such as file format and delimiter for dataframes, plot types, and other details.
vuegen --config docs/example_config_files/Earth_microbiome_vuegen_demo_notebook.yaml --report-type streamlit
If a configuration file is given, users can specify titles and descriptions for sections and subsections, as well as component paths and required attributes, such as file format and delimiter for dataframes, plot types, and other details.
The component paths in the configuration file can be absolute or relative to the execution directory. In the examples, we assume that the working directory is the docs folder, so the paths are relative to it. If you run VueGen from another directory, you need to adjust the paths accordingly.
The current report types supported by VueGen are:
- Streamlit
- HTML
- DOCX
- ODT
- Reveal.js
- PPTX
- Jupyter
Running VueGen in Docker or nextflow
Running VueGen with Docker
Instead of installing VueGen locally, you can run it directly from a Docker container with the following command:
docker run --rm \
  -v "$(pwd)/docs/example_data/Earth_microbiome_vuegen_demo_notebook:/home/appuser/Earth_microbiome_vuegen_demo_notebook" \
  -v "$(pwd)/output_docker:/home/appuser/streamlit_report" \
  quay.io/dtu_biosustain_dsp/vuegen:v0.3.2-docker --directory /home/appuser/Earth_microbiome_vuegen_demo_notebook --report-type streamlit
Running VueGen with Nextflow and nf-core
To run VueGen as a nf-core module, you should create a Nextflow pipeline and include the VueGen module in your workflow. Here is a main.nf example:
#!/usr/bin/env nextflow
include { VUEGEN } from './modules/nf-core/vuegen/'

workflow {
    // Create a channel for the report type
    report_type_ch = Channel.value(params.report_type)

    // Handle configuration file and directory inputs
    if (params.config) {
        file_ch = Channel.fromPath(params.config)
        input_type_ch = Channel.value('config')
        output_ch = VUEGEN(input_type_ch, file_ch, report_type_ch)

    } else if (params.directory) {
        dir_ch = Channel.fromPath(params.directory, type: 'dir', followLinks: true)
        input_type_ch = Channel.value('directory')
        output_ch = VUEGEN(input_type_ch, dir_ch, report_type_ch)

    }
}
You can run the pipeline with the following command:
nextflow run main.nf --directory docs/example_data/Basic_example_vuegen_demo_notebook --report-type html
GUI
We have a simple GUI for VueGen that can be run locally or through a standalone executable.
Local GUI
To use the local GUI, you should clone this repository and install the required dependencies. You can do this by running the following command in the root directory of the cloned repository:
pip install '.[gui]'
Then, you should move to the gui folder and execute the app.py Python file:
python app.py
Bundled GUI
The bundle GUI with the VueGen package is available under the
latest releases.
You will need to unzip the file and run vuegen_gui in the unpacked main folder.
Most dependencies are included into the bundle using PyInstaller.
Streamlit works out of the box as a purely Python based package. For the rest of report types you
will have to have a Python 3.12 installation with the jupyter package installed, as quarto needs to start
a kernel for execution. This is also true if you install quarto globally on your machine.
We assume you have installed the miniforge distribution for your machine (MacOS with arm64/ apple silicon
or x86_64/ intel or Windows x86_64). Also, download the
latest vuegen_gui bundle
from the releases page according to your operating system.
You can create a new conda environment with Python 3.12 and the jupyter and vuegen package:
conda create -n vuegen_gui -c conda-forge -c bioconda python=3.12 jupyter vuegen
The exact Python version used for the release is specified on the releases page as we observed that sometimes the exact Python version is required to run the GUI.
Then, activate the environment:
conda activate vuegen_gui
Now, you can list all conda environments to find the location of the vuegen_gui environment:
conda info -e
On MacOS, you need to add a bin to the path:
/Users/user/miniforge3/envs/vuegen_gui/bin
On Windows, you can use the path as displayed by conda info -e:
C:\Users\user\miniforge3\envs\vuegen_gui
More information regarding the app and builds can be found in the GUI README.
Case studies
VueGen’s functionality is demonstrated through various case studies:
1. Predefined Directory
This introductory case study uses a predefined directory with plots, dataframes, Markdown, and HTML components. Users can generate reports in different formats and modify the configuration file to customize the report structure.
🔗

2. Earth Microbiome Project Data
This advanced case study demonstrates the application of VueGen in a real-world scenario using data from the Earth Microbiome Project (EMP). The EMP is an initiative to characterize global microbial taxonomic and functional diversity. The notebook process the EMP data, create plots, dataframes, and other components, and organize outputs within a directory to produce reports. Report content and structure can be adapted by modifying the configuration file. Each report consists of sections on exploratory data analysis, metagenomics, and network analysis.
🔗
3. APICall Component
This case study focuses on the APICall component, which enables interaction with external APIs by using HTTP methods such as GET and POST. The retrieved data is displayed in the report, allowing users to integrate external data sources into their anlyses. This component is restricted to Streamlit reports.
🔗
4. ChatBot Component
This case study highlights VueGen’s capability to embed a chatbot component into a report subsection, enabling interactive conversations inside the report. This component is streamlit-specific and is not available for other report types.
🔗
Two API modes are supported:
- Ollama-style streaming chat completion:
If a
modelparameter is specified in the config file, VueGen assumes the chatbot is using Ollama’s /api/chat endpoint. Messages are handled as chat history, and the assistant responses are streamed in real time for a smooth and responsive experience. This mode supports LLMs such asllama3,deepsek, ormistral.
- Standard prompt-response API:
If no
modelis provided, VueGen uses a simpler prompt-response flow. A single prompt is sent to an endpoint, and a structured JSON object is expected in return. Currently, the response can include:text: the main textual replylinks: a list of source URLs (optional)HTML content: an HTML snippet with a Pyvis network visualization (optional)
This response structure is currently customized for an internal knowledge graph assistant, but VueGen is being actively developed to support more flexible and general-purpose response formats in future releases.
Web application deployment
Once a Streamlit report is generated, it can be deployed as a web application to make it accessible online. There are multiple ways to achieve this:
Streamlit Community Cloud
Deploy your report easily using Streamlit Cloud, as demonstrated in the EMP VueGen Demo. The process involves moving the necessary scripts, data, and a requirements.txt file into a GitHub repository. Then, the app can be deployed via the Streamlit Cloud interface. The deployment example is available in the streamlit-report-example branch.
Standalone Executables
Convert your Streamlit application into a desktop app by packaging it as an executable file for different operating systems. A detailed explanation of this process can be found in this Streamlit forum post.
Stlite
Run Streamlit apps directly in the browser with stlite, a WebAssembly port of Streamlit powered by Pyodide, eliminating the need for a server. It also allows packaging apps as standalone desktop executables using stlite desktop.
These options provide flexibility depending on whether the goal is online accessibility, lightweight execution, or local application distribution.
License
The code in this repository is licensed under the MIT License, allowing you to use, modify, and distribute it freely as long as you include the original copyright and license notice.
The documentation and other creative content are licensed under the Creative Commons Attribution 4.0 International (CC BY 4.0) License, meaning you are free to share and adapt it with proper attribution.
Full details for both licenses can be found in the LICENSE file.
Contributing
VueGen is an open-source project, and we welcome contributions of all kinds via GitHub issues and pull requests. You can report bugs, suggest improvements, propose new features, or implement changes.
We follow the Conventional Commits specification for commit messages and use the changelog-from-release tool to automatically generate the CHANGELOG.
Please follow the guidelines in the CONTRIBUTING file to ensure that your contribution is easily integrated into the project.
Credits and acknowledgements
- VueGen was developed by the Multiomics Network Analytics Group (MoNA) at the Novo Nordisk Foundation Center for Biosustainability (DTU Biosustain).
- VueGen relies on the work of numerous open-source projects like Streamlit, Quarto, and others. A big thank you to their authors for making this possible!
- The vuegen logo was designed based on an image created by Scriberia for The Turing Way Community, which is shared under a CC-BY licence. The original image can be found at Zenodo.
Citation
If you use VueGen in your research or publications, please cite it as follows:
APA:
Ayala-Ruano, S., Webel, H., & Santos, A. (2025). VueGen: Automating the generation of scientific reports. Bioinformatics Advances, vbaf149. https://doi.org/10.1093/bioadv/vbaf149
BibTeX:
@article{10.1093/bioadv/vbaf149,
  author  = {Ayala-Ruano, Sebastian and Webel, Henry and Santos, Alberto},
  title   = {VueGen: Automating the generation of scientific reports},
  journal = {Bioinformatics Advances},
  pages = {vbaf149},
  year    = {2025},
  month = {06},
  issn = {2635-0041},
  doi = {10.1093/bioadv/vbaf149},
  url = {https://doi.org/10.1093/bioadv/vbaf149},
  eprint = {https://academic.oup.com/bioinformaticsadvances/advance-article-pdf/doi/
  10.1093/bioadv/vbaf149/63568410/vbaf149.pdf},
}
Contact and feedback
We appreciate your feedback! If you have any comments, suggestions, or run into issues while using VueGen, feel free to open an issue in this repository. Your input helps us make VueGen better for everyone.
FAQ
Interactive Plots are not shown correctly
- Make sure to export your interactive plots from Plotly or Altair in JSON format, not as standalone HTML files.
- It is best to use VueGen within the environment you created your plots. If you gather it from many sources and see compatibility issues, consider recreating the plots in a single environment. Failing examples are more than welcome via GitHub issues (you need a GitHub account).
Old JSON Plots stopped working.
We have seen differently structured JSON file from plotlyjs before version 3. If you have such old files and encouter issue, please consider sharing them via GitHub issues.
2 maintainers


Metadata
2 maintainers
Release files for vuegen 0.7.0
For a detailed explanation of source distributions (sdists) and built distributions (wheels), please see the package formats documentation.
Source distribution (sdist)
| File | Size | Uploaded | |
|---|---|---|---|
| vuegen-0.7.0.tar.gz | 64.3 kB | Details |
Built distribution (wheel)
| File | Interpreter | ABI | Platform | Reset |
|---|---|---|---|---|
| vuegen-0.7.0-py3-none-any.whl | Python 3 | none | any | Details |
Total release size: 124.9 kB
Release files / vuegen-0.7.0.tar.gz
| Download URL | vuegen-0.7.0.tar.gz |
|---|---|
| Size | 64.3 kB |
| Tags | Source |
|
SHA-256 checksum How to use checksums |
9ec59f8113f9fca951f2d610e7c4f940485b4ec23985d1c45346474d6a0d3919
|
|
BLAKE2b-256 checksum How to use checksums |
a2be6ac6d45493f4f87c465b64bcaf1821bcbd4089cfda31966f70b293c4b6cb
|
| Upload date | |
|
Uploaded using Trusted Publishing? What is trusted publishing? |
Yes |
| Uploaded via |
twine/7.0.0 CPython/3.13.14
|
Provenance
Provenance describes where a file came from. On PyPI, provenance is shared via attestations, which provide a verifiable record of the build or publishing details. View details, limitations and caveats.


PyPI Publish Attestation
PyPI verified that this artifact, at this checksum, originated from the publisher listed below.
Signed by GitHub Actions, verified by PyPI on Sep 18, 2026.
Transparency logRelease files / vuegen-0.7.0-py3-none-any.whl
| Download URL | vuegen-0.7.0-py3-none-any.whl |
|---|---|
| Size | 60.7 kB |
| Tags | Python 3 |
|
SHA-256 checksum How to use checksums |
71279194f08f41adfd6a3e47272a8fb165fee025f3f1c73974a557e433802330
|
|
BLAKE2b-256 checksum How to use checksums |
ba27dcf6fb6e97b72de2bb06c49156a25e9c851587b29bb6a61e18101d08355d
|
| Upload date | |
|
Uploaded using Trusted Publishing? What is trusted publishing? |
Yes |
| Uploaded via |
twine/7.0.0 CPython/3.13.14
|
Provenance
Provenance describes where a file came from. On PyPI, provenance is shared via attestations, which provide a verifiable record of the build or publishing details. View details, limitations and caveats.
PyPI Publish Attestation
PyPI verified that this artifact, at this checksum, originated from the publisher listed below.
Signed by GitHub Actions, verified by PyPI on Sep 18, 2026.
Transparency log













