
webliveplot
Python Web served line plots with updates dynamically displayed.
This provides two classes:
Plot - which creates charts that can be updated with (time.time(), value) pairs.
Page - which generates a web server, displaying one or more Plot objects.
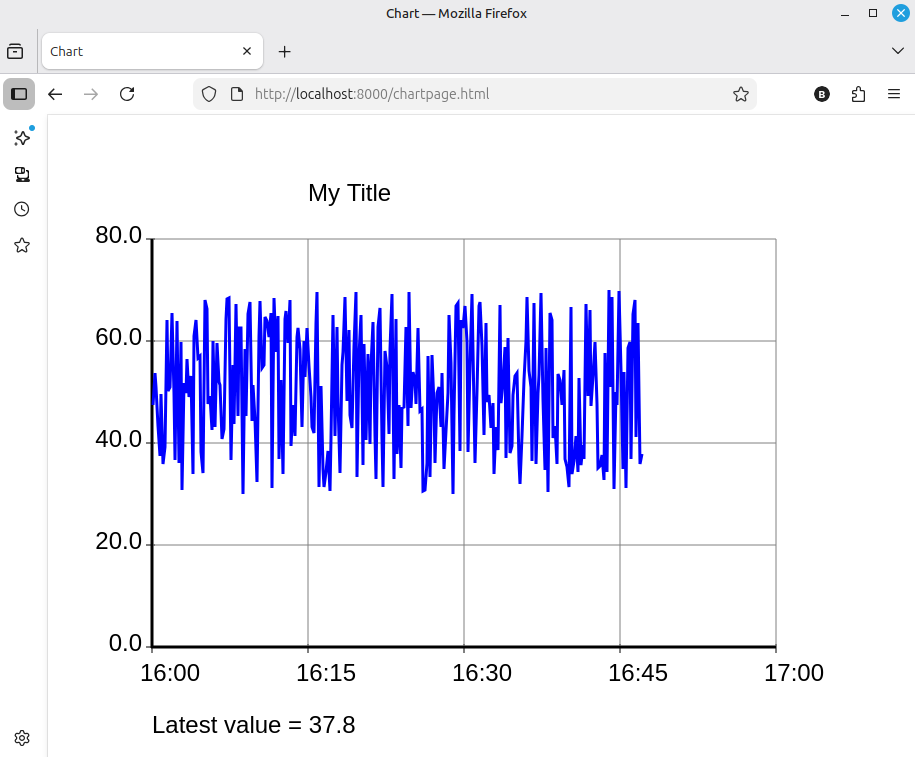
An example browser image with a single plot is:
webliveplot can be installed from Pypi into a virtual environment, which will automatically pull in dependencies.
Example scripts are available on the github page. If you use UV, these can be copied locally and "uv run example1.py" will load dependencies and run it.
A typical script could be something like:
import asyncio, time, random

from webliveplot import Page, Plot

async def measurements(page):
    "Create data for each plot every ten seconds"
    while True:
        for plot in page:
            value = random.uniform(30, 70)  # random values used here
            # set a new description before putpoint, as putpoint generates a new chart
            plot.description = f"Latest value = {value:.1f}"
            plot.putpoint(time.time(), value)
        # and update the web page after changes
        page.update()
        await asyncio.sleep(10) # pause 10 seconds between updates

async def runcharts(page):
    """Create tasks, one runs the web server, at the given host and port
                     one runs 'measurements' gathering data for the plots
    """
    async with asyncio.TaskGroup() as tg:
        tg.create_task( page.serve(host='localhost', port=8000) )
        tg.create_task( measurements(page) )
        print("Now serving at localhost:8000")

# Create Plot objects
plot1 =  Plot(hours=1, title="Plot 1")
plot1.set_y_axis(ymin=0.0, ymax=80.0, yintervals=4, yformat=".1f")

plot2 =  Plot(hours=4, title="Plot 2")
plot2.set_y_axis(ymin=0.0, ymax=80.0, yintervals=4, yformat=".1f")
plot2.set_colors(backcol="yellow", gridcol="white",
                 axiscol="blue", chartbackcol="grey")

# insert plots into the page
page = Page([plot1, plot2])
page.title = "Page title"

# Run the loop and serve the web page
asyncio.run(runcharts(page))
Details of the Plot class are:
Plot(hours=4, height=600, width=800, title="", description="")
hours is the hours, between 1 and 48, displayed along the x axis.
height is the height of the image.
width is the width of the image.
title, if given is a string shown above the line plot.
description, if given, is a string shown below the plot.
These values are also attributes, and if changed will be created when the next point is added with putpoint.
Methods
putpoint(t, v, lineindex=0)
Call this to add a point to the graph.
t must be a time.time() point, that is, a float which is seconds since January 1st 1970.
v is the value to be plotted.
lineindex is used if further lines are included in the plot. The single default line is lineindex 0.
The following methods, if called, will take affect on the next chart update when putpoint is called.
set_colors(backcol, gridcol, axiscol, chartbackcol)
If called sets chart colours. These arguments are also attributes of the plot and can be set individually.
backcol is default "white", The background colour of the whole image
gridcol is default "grey", The colour of the chart grid
axiscol is default "black", The colour of axis, title and description
chartbackcol is default "white", The background colour of the chart
All these colour names are SVG names and can be set as:
Color Names: "red", "blue" etc.
Hex Codes: "#FF0000" for red.
RGB/RGBA: "rgb(255,0,0)" or "rgba(255,0,0,0.5)" (with opacity).
HSL/HSLA: "hsl(0,100%,50%)" or "hsla(0,100%,50%,0.5)" (hue, saturation, lightness, alpha)
set_y_axis(ymin, ymax, yintervals, yformat)
Sets the y axis minimum and maximum values.
If this is not called, an automatic y scaling will be used.
If it is called, then these values will be set, however if any y point exceeds these values, then the chart will revert to auto-scaling.
If you wish to purposely revert to auto-scaling, call this with None values.
yintervals sets the grid and number of intervals up the y axis.
yformat is a string which defines how the y axis numbers are displayed. So the string ".2f" will show numbers with two decimal places.
The auto-scaling feature will inspect the line points, and attempt to set all these values automatically.
add_line(color="blue", label="")
As default the plot is created with one line, this method adds further lines. If label is set, a string of text of the same color as the line, will be shown on the right of the chart.
set_line(color="blue", label="", lineindex=0)
The color and label of a line can be set with this method.
lineindex is 0 for the initial default line, and increases to 1, 2, 3 ,.. etc for further lines if added using add_line.
set_localtime(tflag)
If tflag is True, (the default) the time values on the x axis will show local time (local time of the server).
If tflag is False, the time values will be UTC.
Details of the Page class are:
Page([plots])
The argument is either one Plot object or a list of Plot objects.
A Page acts as a list of plots, it has list indexing with methods append and insert and can be iterated over.
It has attribute 'title' which sets the web page title.
It has further methods:
serve(basepath=None, host='localhost', port=8000)
(async method) Await this to serve the web page.
basepath is either None, or a string such as '/graph/' which will set a path segment which will be prepended to the URL path.
host is a string, set it to '0.0.0.0' if you want to serve it external to localhost.
port is an integer
update()
This requests any connected browser to refresh the charts, and should be called after any page putpoint's are called. If not called, an automatic update will occur every thirty seconds.
The web page
The web page is produced via Mako templates beneath webliveplot/web/templates and is generated with the litestar framework, using htmx, and served with uvicorn.
https://www.makotemplates.org/
The plots are generated using
https://github.com/bernie-skipole/minilineplot
The site CSS files are under webliveplot/web/static, and consist of normalize.css and sakura.css to provide a very minimalist classless CSS layout.
https://github.com/necolas/normalize.css/
https://github.com/oxalorg/sakura
The plots are simply displayed one below the other. To change the layout, try altering the template webliveplot/web/templates/charts.html, and your own CSS links could be placed in webliveplot/web/templates/chartpage.html.
All dependencies, htmx javascript and CSS files have their own licence requirements available via the above links, the remaining code is public domain as far as I'm concerned, feel free to use it as you wish.
1 maintainer

Download files
Download the file for your platform. If you're not sure which to choose, learn more about installing packages.
Source Distribution
Built Distribution
Filter files by name, interpreter, ABI, and platform.
If you're not sure about the file name format, learn more about wheel file names.
Copy a direct link to the current filters
File details
Details for the file webliveplot-0.1.tar.gz.
File metadata
- Download URL: webliveplot-0.1.tar.gz
- Upload date:
- Size: 32.9 kB
- Tags: Source
- Uploaded using Trusted Publishing? No
- Uploaded via: python-requests/2.32.5
File hashes
| Algorithm | Hash digest | |
|---|---|---|
| SHA256 |
00fa657b7ebdafef6f635c0ee7a2087b01923ebdbf68adc1755414401d97a8d1
|
|
| MD5 |
9d90733620327456d36b0cd8fb2d1c6a
|
|
| BLAKE2b-256 |
e3a8b47ad43ea33dfa62cdd61e5ec1c36bb386c0c0811e2fbddd3677565e479f
|
File details
Details for the file webliveplot-0.1-py3-none-any.whl.
File metadata
- Download URL: webliveplot-0.1-py3-none-any.whl
- Upload date:
- Size: 33.1 kB
- Tags: Python 3
- Uploaded using Trusted Publishing? No
- Uploaded via: python-requests/2.32.5
File hashes
| Algorithm | Hash digest | |
|---|---|---|
| SHA256 |
18917c57e8f29596743f3e6a0ef657e717741f0f43eca976a15518c2d0315b59
|
|
| MD5 |
2ce8b730e395fb1cccdc926fb47c7898
|
|
| BLAKE2b-256 |
aeae79a26b46ef39f0d5b7071f7bf1fa2c3d8f2bf87208e3050571a6b6a99432
|







