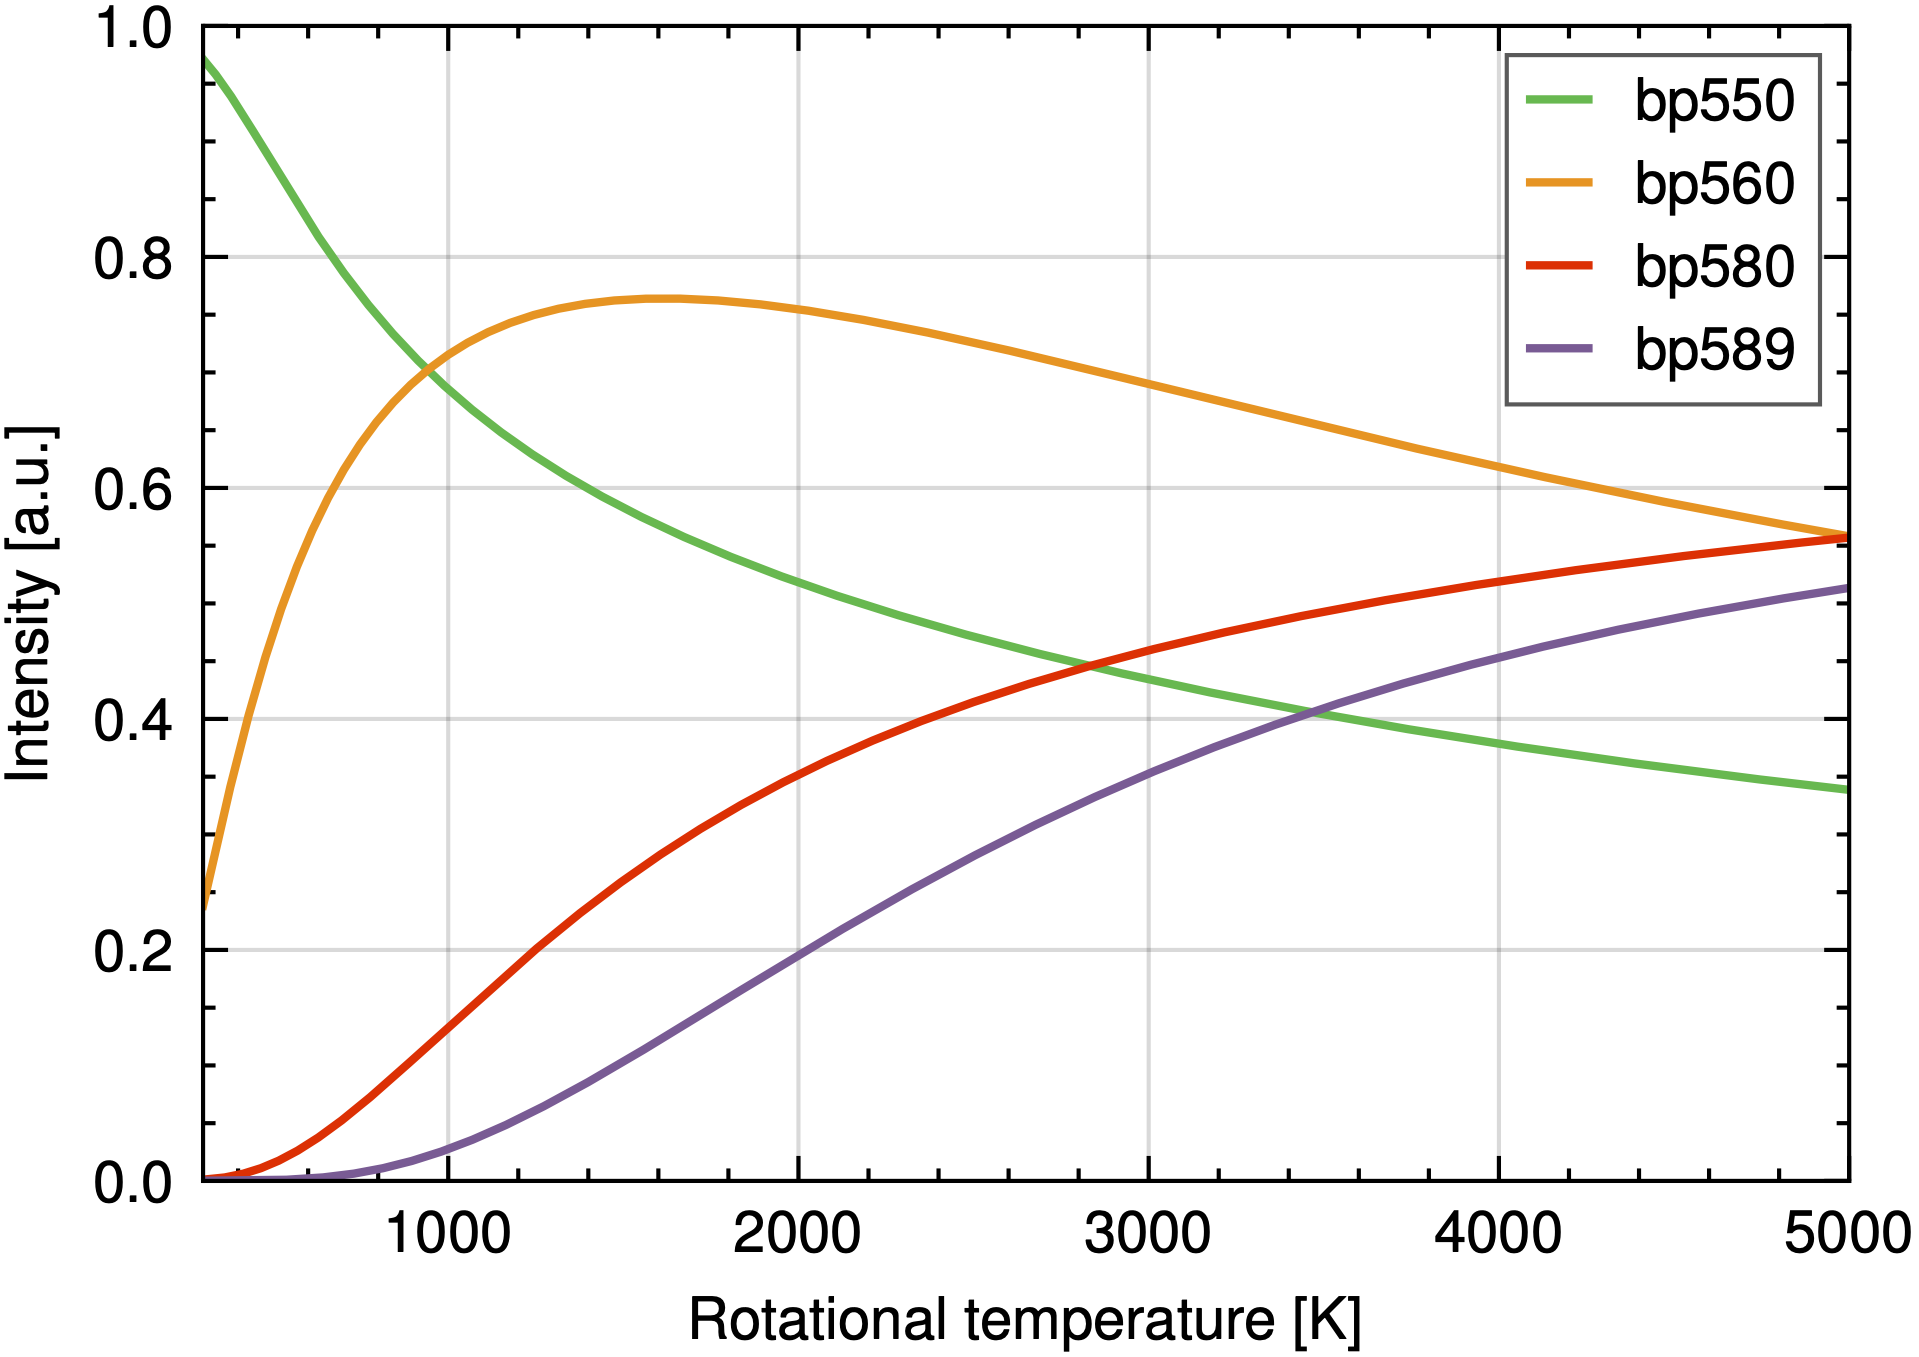
We Don't Make Embarrassing Plots. Matplotlib styles for papers, posters, presentations and theses.
Project description
👗 wedme-plots: We Don't Make Embarrassing Plots
Matplotlib styles for papers, posters, presentations and theses. Tailored for academic use.
Too long; didn't read
- Pick a style from
paper,slide,a0,thesis. - Decide the final size of the figure on the chosen medium.
For example, the column width (
cw) and default height (dh) for thepaperstyle. - Import
wedme - Before using matplotlib, apply the style using
wedme.apply.[style]_[width]_[height](). In the above example,wedme.apply.paper_cw_dh().
Installation
Install from PyPI using PIP:
pip install wedme-plots
For Anaconda users:
- Open an Anaconda Prompt
- Optional: if you use an environment other than
base, open it usingconda activate [my environment] - Install pip using
conda install pip - Install wedme-plots using
pip install wedme-plots
Styling
Wedme offers multiple styles:
paper: compatible with most journals (Nature, Science, Elsevier).slide: compatible with a (16:9) Microsoft Powerpoint presentation.a0: A0 poster.thesis: (work-in-progress) similar topaperbut for a single-column B5 page.
Usage
There are two ways of applying a wedme style.
1. Global styling and sizing
Import the wedme module and apply the desired style, e.g. wedme.apply.paper().
This applies the specified style and its default size to every subsequent figure.
Example:
import wedme

# These commands apply a style to subsequent Matplotlib figures.

# Pick one:
wedme.apply.paper()  # For Elsevier-compatible paper styles
wedme.apply.slide()  # For a 16:9 Powerpoint slide
wedme.apply.a0()     # For A0 posters
wedme.apply.thesis() # For B5-paper thesis

# Optionally, change the default size:
wedme.apply.slide_tw_hh()

# Proceed with plotting as usual
import matplotlib.pyplot as plt

plt.figure()
plt.plot([1, 2, 3, 4])
plt.show()
2. Local styling and sizing
Alternatively, one can open figures in a specified style and size using the wedme drop-in replacements for plt.figure() and plt.subplots() as follows:
import wedme
import matplotlib.pyplot as plt

# Open a figure in the `a0` style,
# with a size corresponding to half-width and half-height
wedme.figure.a0_hw_hh()
plt.plot([1, 2, 3, 4])

# Open a figure with two subplots in the `slide` style,
# with the figure size corresponding to half-width and half-height
fig, (ax1, ax2) = wedme.subplots.slide_hw_hh(1, 2)

ax1.plot([1, 2, 3, 4])
ax2.plot([1, 2, 3, 4])
Any arguments passed to wedme.figure.[style]() and wedme.subplots.[style]() are passed on to the equivalent matplotlib functions.
Sizing
Matching the matplotlib figure size to the final display size of the figure is critically important: scaling to a different height will change font sizes and line widths.
We include the following breakpoints, with respect to the available width and height (H) of the chosen medium:
| Breakpoint | Ratio |
|---|---|
F |
100% ("full") |
TT |
2/3 ("two-thirds") |
H |
1/2 ("half") |
FT |
5/12 ("five-twelfth") |
T |
1/3 ("third") |
Q |
1/4 ("quarter") |
R |
1/5 |
S |
1/6 |
To specify the size using a breakpoint, append W (width) or H (height). For example, wedme.figure.a0_hw_hh() specifies the a0 style, with a size of half the A0 width and height.
In addition to the breakpoints, some styles include custom sizes:
paper:CW(column width) for two-column papers.GHis the height that corresponds to the golden-ratio ofCW.thesis:LFWandLFHfor the landscape full-width and full-height. The default width and heightDWandDHcorrespond toCWandGHof thepaperstyle
When no size is specified, the following defaults sizes are used:
paper:(wedme.PAPER_CW, wedme.paper_GH)slide:(wedme.SLIDE_TTW, wedme.slide_TTH)a0:(wedme.A0_TW, ...)thesis:(wedme.THESIS_DW, wedme.paper_DH)
Powerpoint
Powerpoint automatically resizes artwork to a size that is different from the export size. To undo this:
- Insert the figure in Powerpoint.
- Picture Format > Reset Picture > Reset Picture & Size.
Fonts
Sans-serif fonts are the standards for figures because they remain readable even when small or pixelated. Helvetica or Arial fonts are preferred by Nature, Science and Elsevier.
We try to find Helvetica, Arial, Verdana, Inter, Nimbus Sans on your system, in that order. The first font found will be applied to the figures.
Exporting
wedme sets the pdf.fonttype parameter to 42 as recommended by Nature. This ensures that the text is editable even after exporting a pdf. wedme also changes the parameters figure.autolayout and savefig.bbox such that the specified sizes are respected.
For saving figures, consider using pypdfplot to maintain the ability to later change how data is displayed. Of course, we don't make embarassing plots to begin with.
Examples

Utilities
Other than style sheets, wedme also includes utilities for commonly used operations.
- Creating animated GIF images from multiple plots. See
wedme.gif - Creating a legend only for unique entries. See
wedme.util.unique_legend() - Specifying the colorbar label easily. See
wedme.util.colorbar() - Specifying the minimum and maximum of the colorbar as a function of percentiles of the shown field. See
wedme.util.imshow() - Making plot colors dependent on some variable. See
weme.util.get_colormap_norm()
Project details
Download files
Download the file for your platform. If you're not sure which to choose, learn more about installing packages.
Source Distribution
File details
Details for the file wedme_plots-2.0.5.tar.gz.
File metadata
- Download URL: wedme_plots-2.0.5.tar.gz
- Upload date:
- Size: 16.1 kB
- Tags: Source
- Uploaded using Trusted Publishing? No
- Uploaded via: twine/6.0.1 CPython/3.13.0
File hashes
| Algorithm | Hash digest | |
|---|---|---|
| SHA256 |
b7574d7fd312db8ae3e77e5e91603b74a1132c10d1686096288787c410b0eb00
|
|
| MD5 |
228b9caba70e3552cea39f3eb2169672
|
|
| BLAKE2b-256 |
418190b39608e98aaa4828e78e218be9702b1f2f377ee275e69491d2875aee99
|


