
Self-hosted, mobile-friendly observability for LangGraph — traces, run history, cost, and a living graph view.
Verified details
These details have been verified by PyPIProject links
GitHub Statistics
Maintainers

Project description

Windhover



Windhover: the old poetic name for the kestrel, the falcon that hangs motionless in the wind, watching everything below. This tool does the same for your agent graphs.
Self-hosted, mobile-friendly observability for LangGraph. Trace depth like LangSmith (LLM prompts, tokens, cost, latency - plus retrievers and human-in-the-loop interrupts), run history, a timing waterfall, per-node stats, error forensics down to the throwing source line - and a living graph view that auto-updates when your code's topology changes. Point it at any compiled graph, or trace runs in from your own app. No LangSmith account, no cloud tunnel, no fragile websocket. HTTP + SSE, MIT.
Nothing about your graph's domain is baked in. Topology, the input form, and run outputs all come from the graph itself. Windhover observes - it never edits your graph.
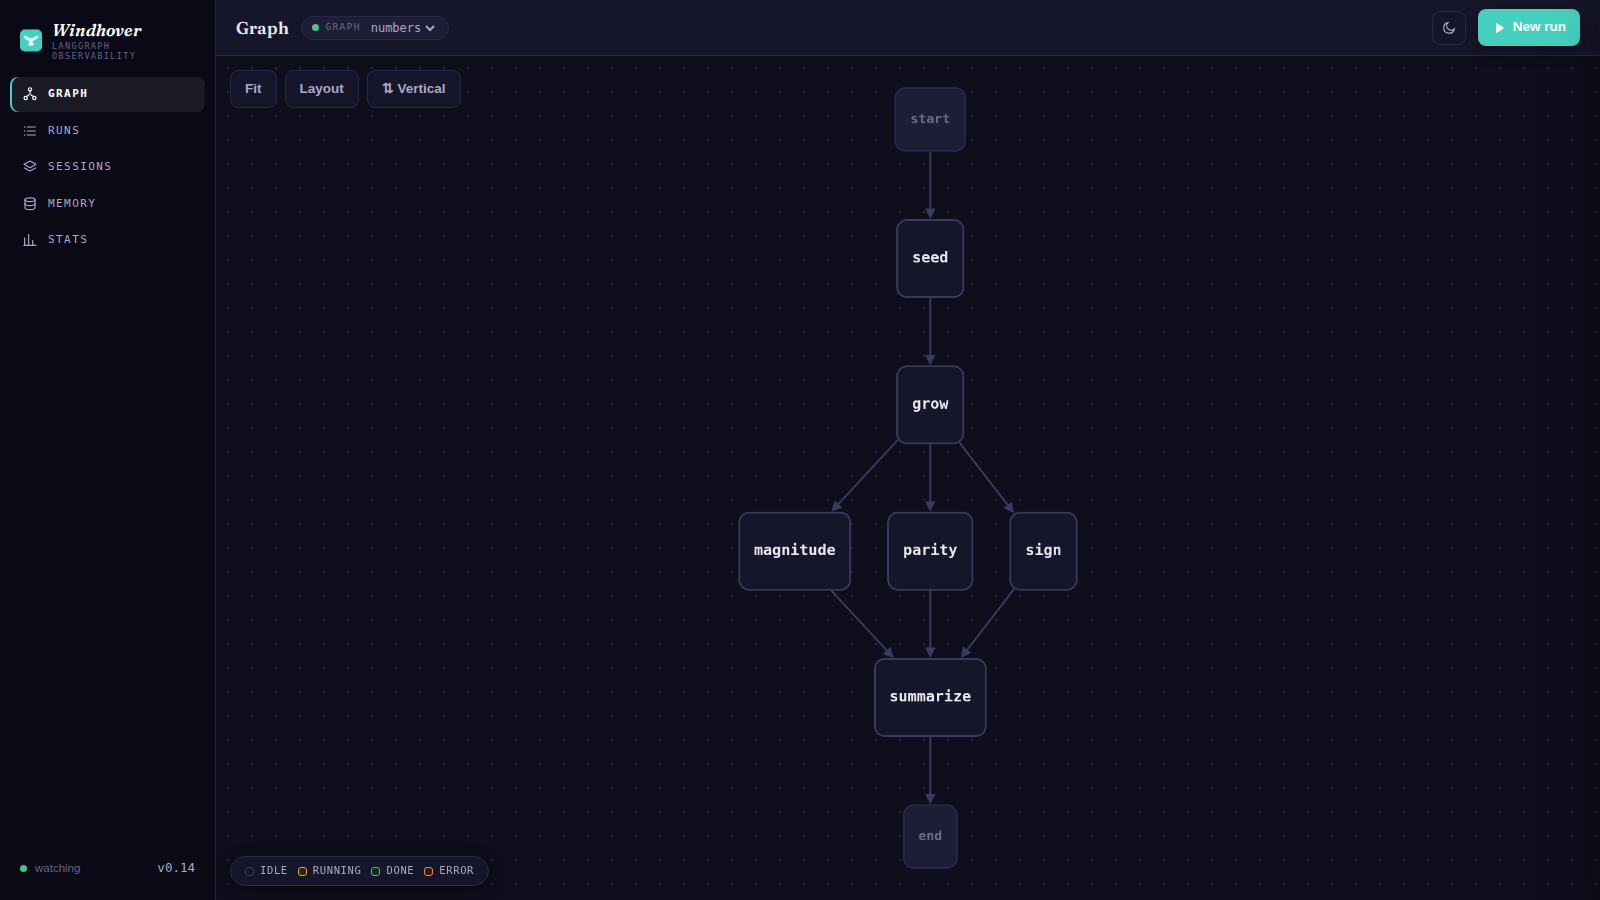
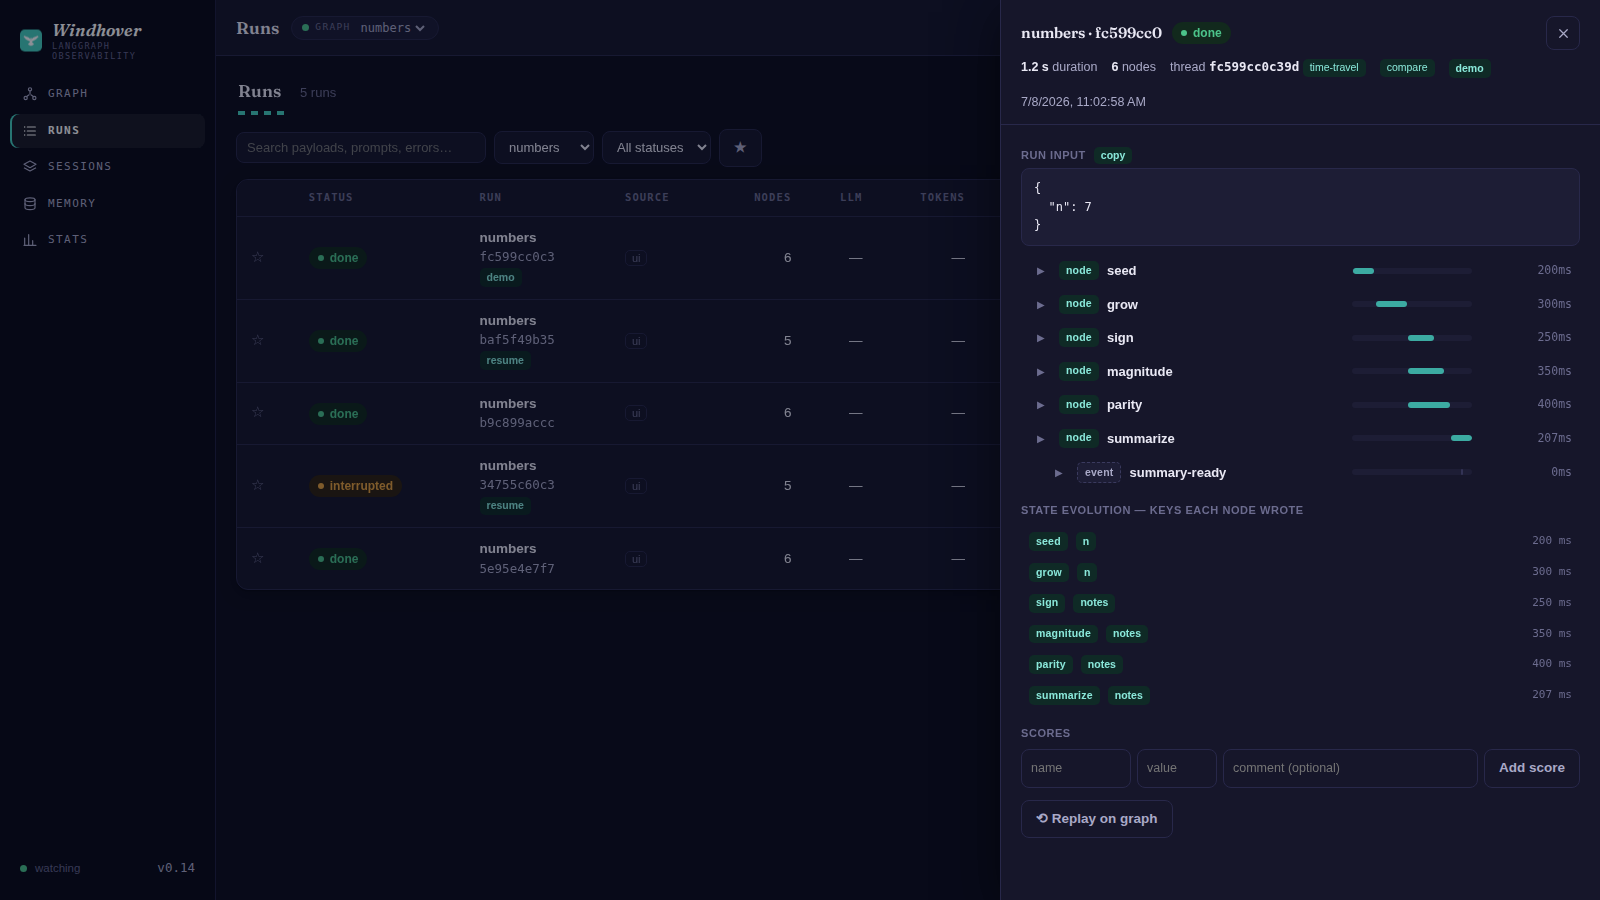
| Living graph (parallel fan-out) | Trace drawer - retrievers, LLM calls, cost, state |
|---|---|
 |
 |
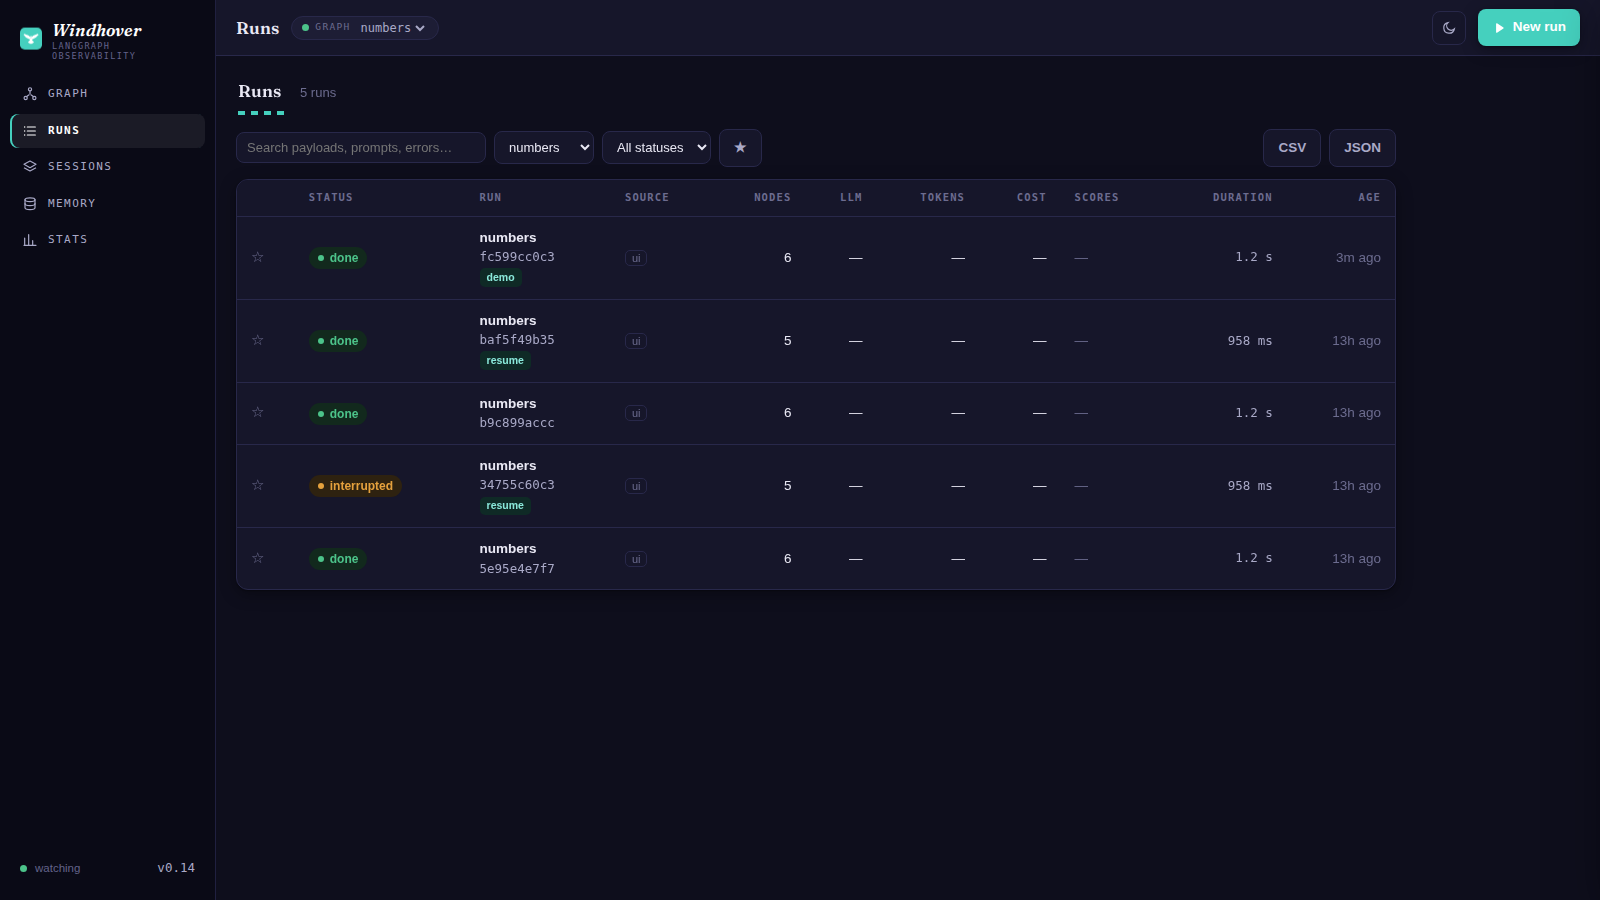
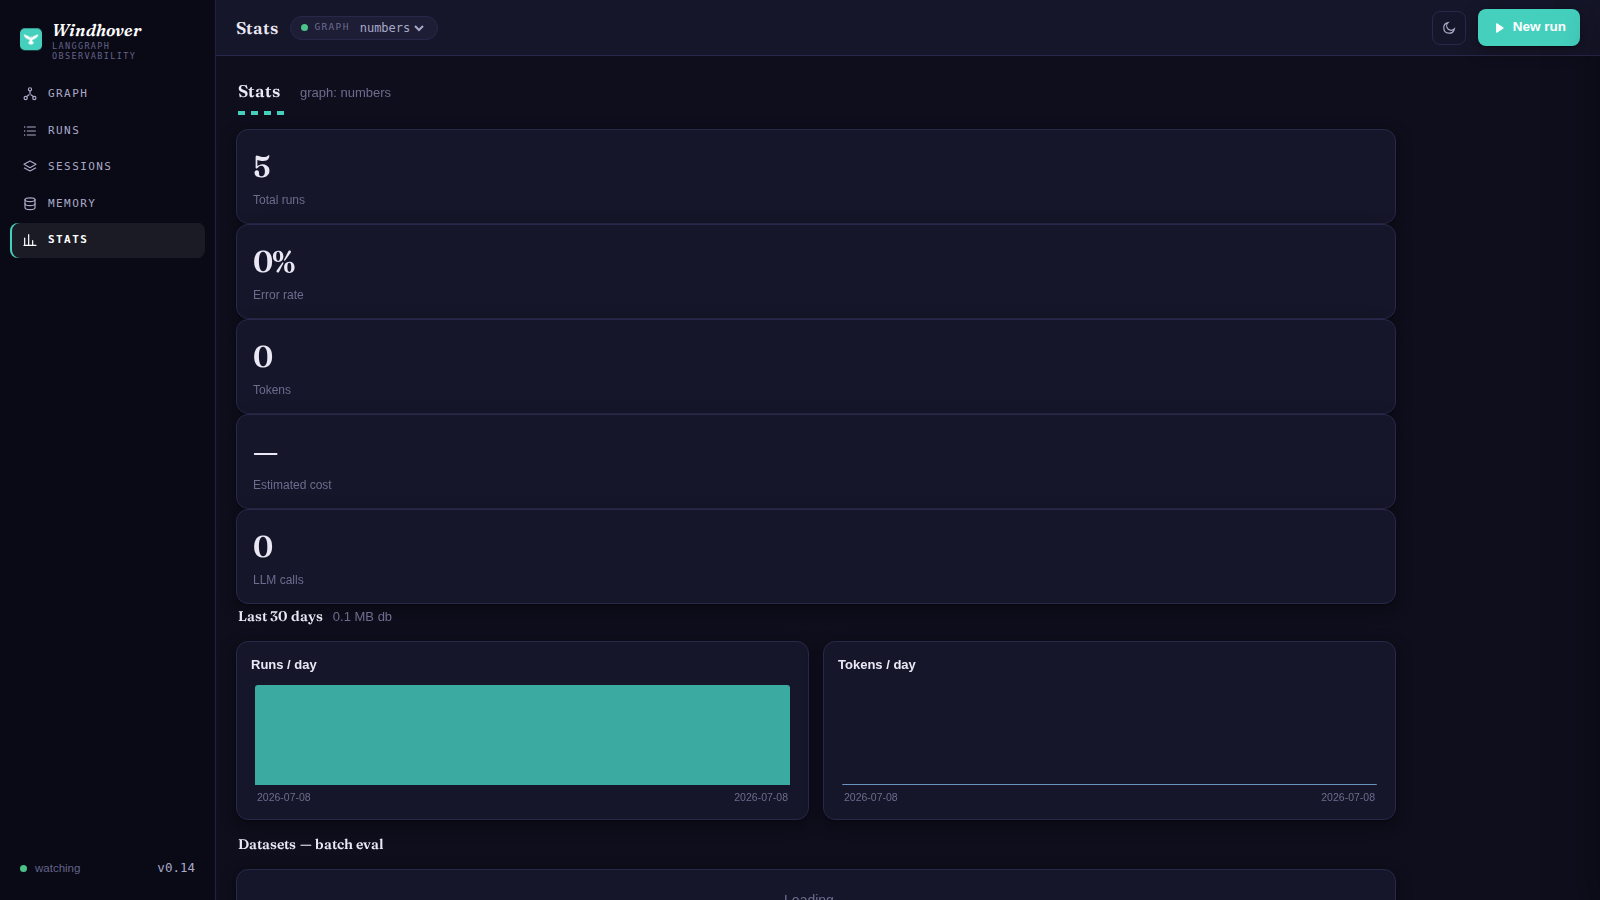
| Runs - search, tags, sessions, interrupts | Dashboards - per-day, per-model |
|---|---|
 |
 |
Quick start
pip install windhover langgraph
WINDHOVER_GRAPH=windhover.demo_graph:graph windhover   # -> :8090
Open http://<host>:8090. New run (input pre-filled from the graph's schema) →
watch it execute → Runs for history, span trees, and replay → Stats for cost/latency.
Edit the graph file while it runs and the canvas updates itself.
Your own graph: WINDHOVER_GRAPH="myapp.graphs:g" WINDHOVER_GRAPH_DIR=/path python -m windhover.server
Several graphs behind one URL: WINDHOVER_GRAPH="checkout=app.flows:checkout,support=app.flows:support"
(a selector appears in the top bar; langgraph.json projects serve all their graphs automatically).
Trace runs from any app
from windhover import WindhoverTracer
graph.invoke(input, config={"callbacks": [WindhoverTracer("http://HOST:8090")]})
Node spans, LLM calls (model/prompt/response/tokens/cost), and tools show up in Runs - wherever your app runs. Non-blocking, best-effort; never raises into your graph.
Sessions and tags use standard LangChain config - no Windhover imports needed beyond the tracer:
graph.invoke(input, config={
    "callbacks": [WindhoverTracer("http://HOST:8090")],
    "metadata": {"windhover_session": "chat-42", "windhover_tags": ["prod"]},
    "tags": ["also-captured"],          # langgraph-internal tags are filtered out
})
Features
- Any graph: topology from
graph.get_graph(); input form from its state schema. - Full trace tree: nodes → nested LLM / tool / retriever spans: prompts, responses, tokens, cost, latency, retrieved documents with their metadata.
- Clickable graph: tap a node for health, latency, wiring, its source code, and recent executions with payloads.
- Error forensics: failed runs show the full traceback; the failing node turns red on the graph, and the node's source renders with the throwing line highlighted.
- Human-in-the-loop console: a paused graph shows an amber interrupted status with the
question it's asking; answer it (
Command(resume=…)), redirect it (Command(goto=…)), set static breakpoints per run (interrupt_before), edit state at any checkpoint (update_state), or fork a thread from any historical checkpoint - all from the UI, all pure LangGraph primitives. - State evolution: every trace shows which state keys each node wrote, in order.
- X-ray: graphs with subgraphs get a canvas toggle that expands composite nodes
(
get_graph(xray=True)). - Search & filters: full-text over prompts/payloads/errors (FTS5, LIKE fallback), status/tag/session filters, bookmarks, pagination, CSV/JSON export.
- Sessions: group runs into threads/batches; roll-up tokens, cost, errors.
- Scores: attach numeric evals to runs (API or UI): eval harnesses, LLM-as-judge, human review.
- Live tail: open a running run and watch spans arrive - including the model typing
(streamed tokens flush into the span twice a second); nodes push progress via
get_stream_writer(). - Call configs: every LLM span records temperature/max-tokens/stream and the tools the
model was offered; conditional-edge branch labels and
add_node(metadata=…)render on the graph and node pane; graphs with a context schema get a runtime-context box on New run. - Custom events:
dispatch_custom_event("name", {...})anywhere in your app lands as an event marker in the trace, parented to the node that fired it. - Retries + TTFT: tenacity retries badge the span (
↻2); streaming LLM calls record time-to-first-token; cache-read / reasoning token details show on the model line. - Memory browser: graphs compiled with a LangGraph
Storeget a Memory view: browse namespaces and search long-term memory items. - Time-travel: checkpointed graphs get a per-thread checkpoint browser: state, writes,
and next-nodes at every superstep (
get_state_history). - Run diff: compare any two runs node-by-node: identical vs differing outputs, duration and token deltas.
- Datasets / batch eval: store golden input sets, run the graph over them, and get an
expected_matchscore per item (see Datasets on the Stats page). - Run history + replay: SQLite; runs persist even if the browser closes (worker thread).
- Living graph: file watcher re-extracts topology in a subprocess and pushes it to the UI.
- Dashboards: runs/tokens per day, per-model usage and latency, per-node latency, error rate.
- Multi-graph: serve every graph in your project behind one URL; a top-bar selector scopes all views (runs, sessions, stats included - metrics never mix graphs). The selector also offers All graphs: Stats shows deployment-wide totals with per-node rows grouped per graph (same-named nodes never merge), Sessions shows every graph a session spanned - a journey that crosses graphs stays one session - and Runs lists everything. The graph canvas and Memory keep showing your last concrete graph (a small note says which), since a topology and a store are per-graph by nature.
- Artifacts: when a node's output records a file path (a report it wrote, a chart,
an export), the run drawer and the node pane both surface it with inline preview and
one-click download. Previews: HTML/PDF/images/text/CSV/code, rendered Markdown,
audio/video, and Office - Word/Excel/PowerPoint rendered in-browser (vendored
mammoth/SheetJS/jszip, lazy-loaded, shown in a sandboxed frame). Only paths recorded
by that run's own outputs are servable - never arbitrary files - behind the same
/apitoken gate. - Fleet view: with multiple graphs, a cross-graph overview becomes the landing page:
a Needs attention list of every run paused on an interrupt (question shown inline,
resume right from the row) or still running, plus per-graph health cards (last run,
7-day run/error counts with a daily sparkline - errors in red - and recent runs).
Interrupts that were already resumed on their thread don't linger as false positives.
Also available as
GET /api/overview. - Alerts:
WINDHOVER_WEBHOOKposts a JSON summary when a run errors or pauses; set VAPID keys and installed browsers can also subscribe to Web Push notifications (a 🔔 in the top bar; works as an installed PWA, iOS 16.4+ included). - Never slows your app: the remote tracer is non-blocking (bounded queue; drops rather than delays when the collector is down).
- Mobile-first PWA, light/dark. Fully local (FastAPI + Cytoscape.js).
Datasets API
curl -X POST :8090/api/datasets -H 'Content-Type: application/json' -d '{
  "name": "golden", "items": [
    {"input": {"n": 2},  "expected": 6},
    {"input": {"n": 40}, "expected": "big"}]}'
curl -X POST :8090/api/datasets/golden/run   # -> runs land in an eval:golden:<ts> session
Scores API
curl -X POST :8090/api/runs/RUN_ID/scores -H 'Content-Type: application/json' \
     -d '{"name": "accuracy", "value": 0.92, "comment": "vs golden set"}'
Config (env)
WINDHOVER_GRAPH (module:attr, or a comma list name=module:attr,…; unset = langgraph.json
discovery, else ingest-only) · WINDHOVER_GRAPH_DIR · WINDHOVER_DB
· WINDHOVER_HOST/WINDHOVER_PORT (0.0.0.0/8090) · WINDHOVER_WATCH (1) · WINDHOVER_PRICING
· WINDHOVER_RETENTION_DAYS (0 = keep forever; else prune older runs on startup + every 6h)
· WINDHOVER_TOKEN (set to require Authorization: Bearer <token> - or ?token= - on all
/api routes; the UI prompts once and remembers it)
· WINDHOVER_WEBHOOK (POST a JSON alert whenever a run errors or pauses on an interrupt;
accepts a single URL, or a comma list mixing a default with per-graph name=url overrides -
e.g. https://hooks.example/all,billing=https://hooks.example/billing)
· WINDHOVER_VAPID_PUBLIC/WINDHOVER_VAPID_PRIVATE (base64url VAPID keypair - set both to
enable browser Web Push; unset = feature hidden) · WINDHOVER_VAPID_SUBJECT (a mailto: or
https: contact URL sent to the push service; use a real domain - some services reject .local)
· WINDHOVER_DIGEST (HH:MM local time for one daily summary push - runs/errors/awaiting
across all graphs, linking to the fleet; quiet days send nothing; requires Web Push keys).
When several runs await approval, interrupt pushes link to the fleet queue instead of a
single run.
Edit windhover/pricing.json for your models' $/1M rates (unknown model → cost null).
Web Push setup: generate a VAPID keypair (e.g. openssl/py-vapid), set the three env
vars above (over HTTPS: browsers only allow push from a secure origin), install the app to
your home screen, and tap the 🔔. Alerts fire on the same errors/interrupts as the webhook.
Docs
The guide covers every feature with how-tos and the fine print -
including the most important nuance: panels light up based on what your graph supports
(Memory needs a store=, time-travel/HITL need a checkpointer=, X-ray needs subgraphs,
live typing needs streaming=True). An absent tab isn't a bug - it's a graph without that
capability. SPEC.md has the architecture.
Notes
Runs use the imported graph (restart to run new code); the view always reflects
current-on-disk topology. All frontend assets are vendored - no CDN, works fully offline.
Deep links: #runs, #sessions, #stats, #run=<id>.
License
MIT.
Project details
Verified details
These details have been verified by PyPIProject links
GitHub Statistics
Maintainers
Release history Release notifications | RSS feed


Download files
Download the file for your platform. If you're not sure which to choose, learn more about installing packages.
Source Distribution
Built Distribution
Filter files by name, interpreter, ABI, and platform.
If you're not sure about the file name format, learn more about wheel file names.
Copy a direct link to the current filters
File details
Details for the file windhover-0.32.2.tar.gz.
File metadata
- Download URL: windhover-0.32.2.tar.gz
- Upload date:
- Size: 1.3 MB
- Tags: Source
- Uploaded using Trusted Publishing? Yes
- Uploaded via: twine/6.1.0 CPython/3.13.12
File hashes
| Algorithm | Hash digest | |
|---|---|---|
| SHA256 |
ad2a233d47d291a8bd67c5d9a72157fc8a4de2f120d9ba80078f91167b4b4683
|
|
| MD5 |
0bae1372e9633a516734591686f7edb1
|
|
| BLAKE2b-256 |
6c88337db518c4f15d640d72859834e4919bdc3ba5c14f752a9788ac7b13045c
|
Provenance
The following attestation bundles were made for windhover-0.32.2.tar.gz:
Publisher:
release.yml on justfeltlikerunning/windhover
-
Statement:
-
Statement type:
https://in-toto.io/Statement/v1 -
Predicate type:
https://docs.pypi.org/attestations/publish/v1 -
Subject name:
windhover-0.32.2.tar.gz -
Subject digest:
ad2a233d47d291a8bd67c5d9a72157fc8a4de2f120d9ba80078f91167b4b4683 - Sigstore transparency entry: 2174033661
- Sigstore integration time:
-
Permalink:
justfeltlikerunning/windhover@0c3d7ddef413a87c8da260da9aa481bedb1582e6 -
Branch / Tag:
refs/tags/v0.32.2 - Owner: https://github.com/justfeltlikerunning
-
Access:
public
-
Token Issuer:
https://token.actions.githubusercontent.com -
Runner Environment:
github-hosted -
Publication workflow:
release.yml@0c3d7ddef413a87c8da260da9aa481bedb1582e6 -
Trigger Event:
push
-
Statement type:
File details
Details for the file windhover-0.32.2-py3-none-any.whl.
File metadata
- Download URL: windhover-0.32.2-py3-none-any.whl
- Upload date:
- Size: 954.1 kB
- Tags: Python 3
- Uploaded using Trusted Publishing? Yes
- Uploaded via: twine/6.1.0 CPython/3.13.12
File hashes
| Algorithm | Hash digest | |
|---|---|---|
| SHA256 |
6699314ee10ca079419b0f8d8ba77ca63477cdfeeeedb1a100198e27bfb156ea
|
|
| MD5 |
e9d68ed849c682e692430d1c52a70597
|
|
| BLAKE2b-256 |
01ab268aa437a0367794eacc10d9acb23b5a74b02951136958376c25ecc366d0
|
Provenance
The following attestation bundles were made for windhover-0.32.2-py3-none-any.whl:
Publisher:
release.yml on justfeltlikerunning/windhover
-
Statement:
-
Statement type:
https://in-toto.io/Statement/v1 -
Predicate type:
https://docs.pypi.org/attestations/publish/v1 -
Subject name:
windhover-0.32.2-py3-none-any.whl -
Subject digest:
6699314ee10ca079419b0f8d8ba77ca63477cdfeeeedb1a100198e27bfb156ea - Sigstore transparency entry: 2174033719
- Sigstore integration time:
-
Permalink:
justfeltlikerunning/windhover@0c3d7ddef413a87c8da260da9aa481bedb1582e6 -
Branch / Tag:
refs/tags/v0.32.2 - Owner: https://github.com/justfeltlikerunning
-
Access:
public
-
Token Issuer:
https://token.actions.githubusercontent.com -
Runner Environment:
github-hosted -
Publication workflow:
release.yml@0c3d7ddef413a87c8da260da9aa481bedb1582e6 -
Trigger Event:
push
-
Statement type:






