Explore visual insights from data in an easy and intituitive way with few lines of code.

Project description


Table of content
About xplotter
The definition is clear: xplotter is a python library created for making the Exploratory Data Analysis process so much easier! With xplotter, data scientists and data analysts can use a vast number of functions for plotting, customizing and extracting insights from data with very few lines of code. The exploratory process is a key step on every data science and business inteligence project and it's very important to understand your data before take any action. The use cases are almost infinity!
Why use xplotter?
- Use functions for plotting graphs and extracting information from your data in an easy way
- You can explore your data faster
- Visualize some beautiful charts with few lines of code
- Save your images in a local repository
- Improve analytics by analysing trends and distributions of your data
- Rich documentation to explore
Package structure
After viewing some of benefits of using xplotter in a data project, it's also important to see how the package was built and how it's organized. At the moment, there are two modules on the xplotter package folder and they are explained on the table below:
| Module | Description | Functions/Methods | Lines of Code (approx) |
|---|---|---|---|
formatter |
Auxiliar functions for formatting charts | 3 | ~150 |
insights |
Functions for exploring data in a wide range of possibilities | 14 | ~1800 |
Features
The features of xplotter package are built into useful and well-documented functions that can be used in any step of data exploration process. There will be a specific session of usage examples in this documentations but, just be clear, you can use xplotter for a simple formatting step like customizing the border axis in a matplotlib graph...
from xplotter.formatter import format_spines

fig, ax = plt.subplots(figsize=(10, 7))
format_spines(ax, right_border=False)
...or even plot a simple and customized countplot with labels already written inside the bars...
from xplotter.insights import plot_countplot

plot_countplot(df=df, col='cat_column')
At this moment, all the features available in the xplotter package are:
| Module | Function/Class | Short Description |
|---|---|---|
formatter |
format_spines |
Modify borders and axis colors of matplotlib figure |
formatter |
AnnotateBars |
Makes the process of labeling data points in a bar chart easier |
formatter |
make_autopct |
Helps labeling data in a pie or donut chart |
insights |
save_fig |
Easy way for saving figures created inside or outside xplotter |
insights |
plot_donutchart |
Creates a custom donut chart for a specific categorical column |
insights |
plot_pie_chart |
Creates a custom pie chart for a specific categorical column |
insights |
plot_double_donut_chart |
Creates a "double" custom donut chart for two columns of a given dataset |
insights |
plot_countplot |
Creates a simple countplot using a dataset and a column name |
insights |
plot_pct_countplot |
Creates a percentage countplot (grouped bar chart) using a dataset and a column name |
insights |
plot_distplot |
Creates a custom distribution plot based on a numeric column |
insights |
plot_aggregation |
Plots a custom aggregate chart into a bar style |
insights |
plot_cat_aggreg_report |
A rich and complete report using count, aggregation and distribution functions |
insights |
data_overview |
Extract useful information of a given dataset to offers an overview from the data |
insights |
plot_corr_matrix |
A beautiful and customized correlation matrix for a dataset and a target column |
insights |
plot_multiple_distplots |
Plots custom distribution charts for multiple columns at once using the col_list parameter |
insights |
plot_multiple_dist_scatterplot |
Plots a rich graph that joins a distribution and a scatterplot |
insights |
plot_multiple_countplots |
Plots multiple formatted countplot based on a list of columns of a given dataset |
insights |
plot_evolutionplot |
Plots an evolution plot in a line chart |
Installing the package
The last version of xplotter package are published and available on PyPI repository
:pushpin: Note: as a good practice for every Python project, the creation of a virtual environment is needed to get a full control of dependencies and third part packages on your code. By this way, the code below can be used for creating a new venv on your OS.
# Creating and activating venv on Linux
$ python -m venv <path_venv>/<name_venv>
$ source <path_venv>/<nome_venv>/bin/activate

# Creating and activating venv on Windows
$ python -m venv <path_venv>/<name_venv>
$ <path_venv>/<nome_venv>/Scripts/activate
With the new venv active, all you need is execute the code below using pip for installing xplotter package (upgrading pip is optional):
$ pip install --upgrade pip
$ pip install xplotter
The xplotter package is built in a layer above some other python packages like matplotlib, seaborn and pandas. Because of that, when installing xplotter, the pip utility will also install all dependencies linked to xplotter. The output expected on cmd or terminal are something like:
Installing collected packages: six, pytz, python-dateutil, pyparsing, numpy, kiwisolver, cycler, scipy, pandas, matplotlib, seaborn, xplotter
Successfully installed cycler-0.10.0 kiwisolver-1.3.1 matplotlib-3.2.1 numpy-1.20.2 pandas-1.1.5 pyparsing-2.4.7 python-dateutil-2.8.1 pytz-2021.1 scipy-1.6.3 seaborn-0.11.1 six-1.15.0 xplotter-0.0.3
Examples
In this session, you will see some usage examples of xplotter on real problems using data. After installing the package, it's important to know how to use it and how to extract the real power of it.
Insights Module
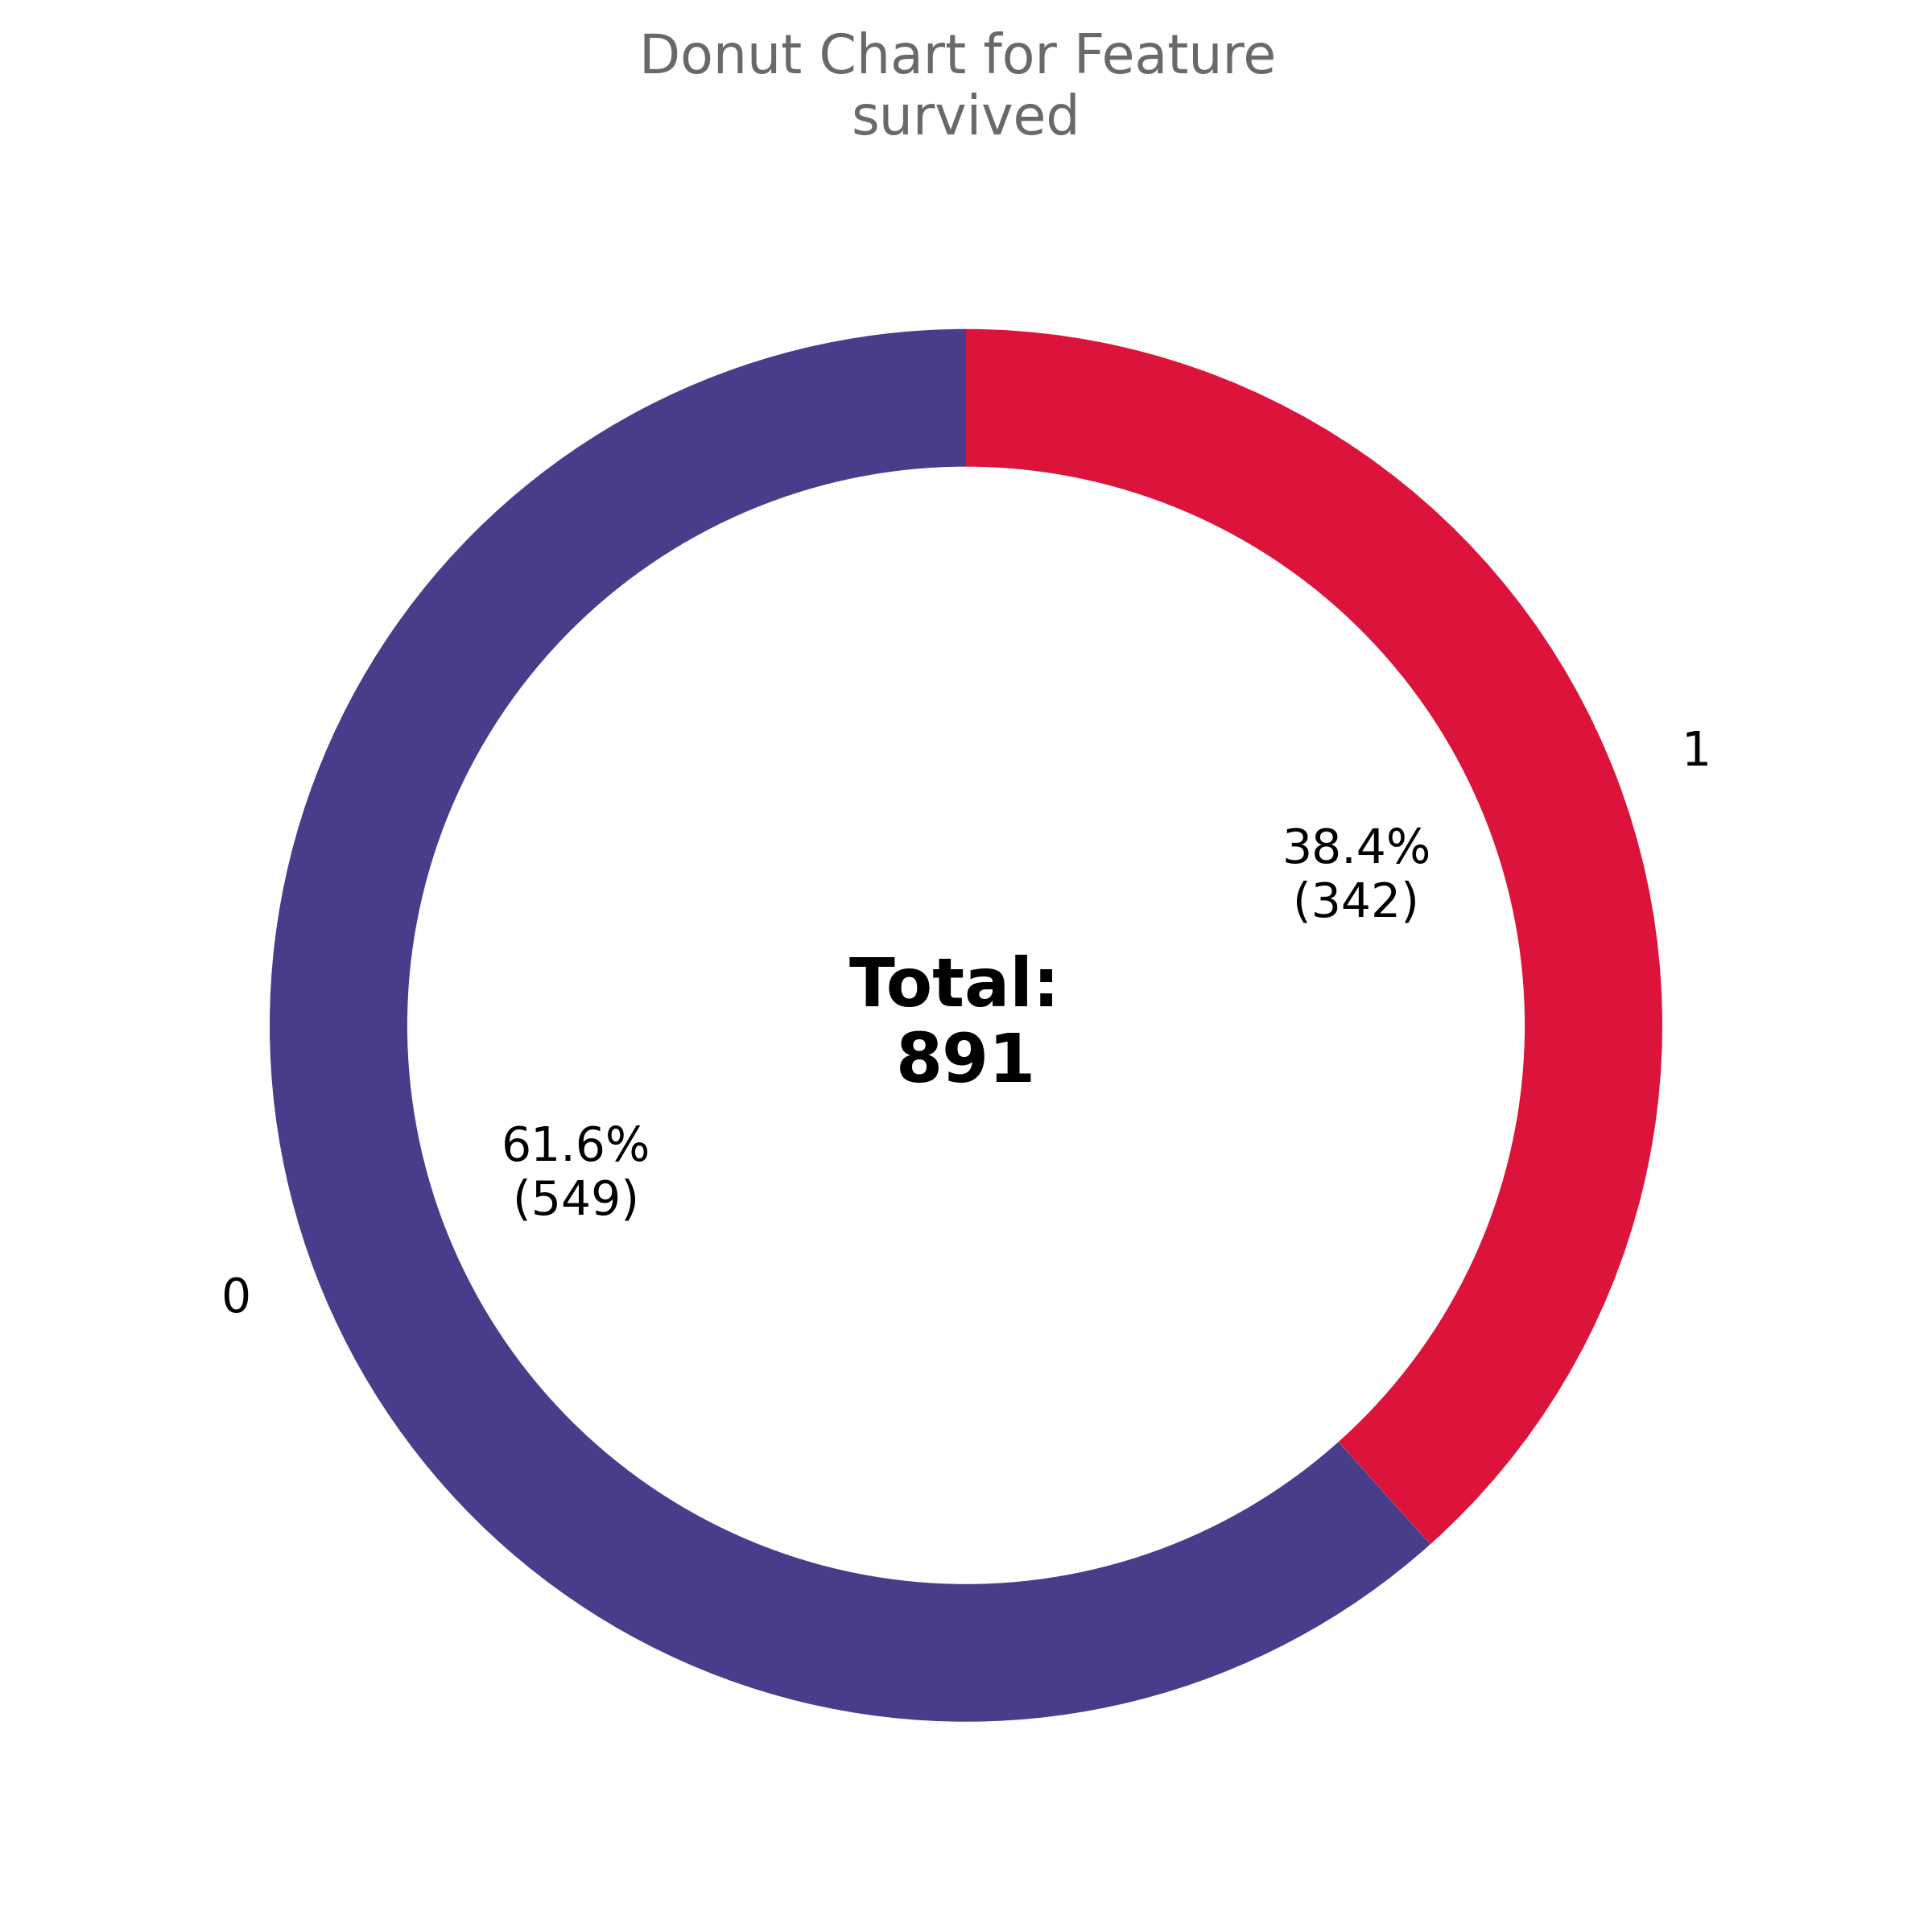
As you could see by this time, the insights module from xplotter have a lot of functions that can deliver something like "charts as a code". It's just a funy way to describe how the components and the tools inside this module can make life of a data explorer easier. To ilustrate that, the code below reads the titanic dataset directly from seaborn and plots a custom donut chart for survived feature.
from xplotter.insights import plot_donut_chart
import seaborn as sns

titanic = seaborn.load_dataset('titanic')
plot_donut_chart(df=titanic, col='survived')
This outputs the following figure:
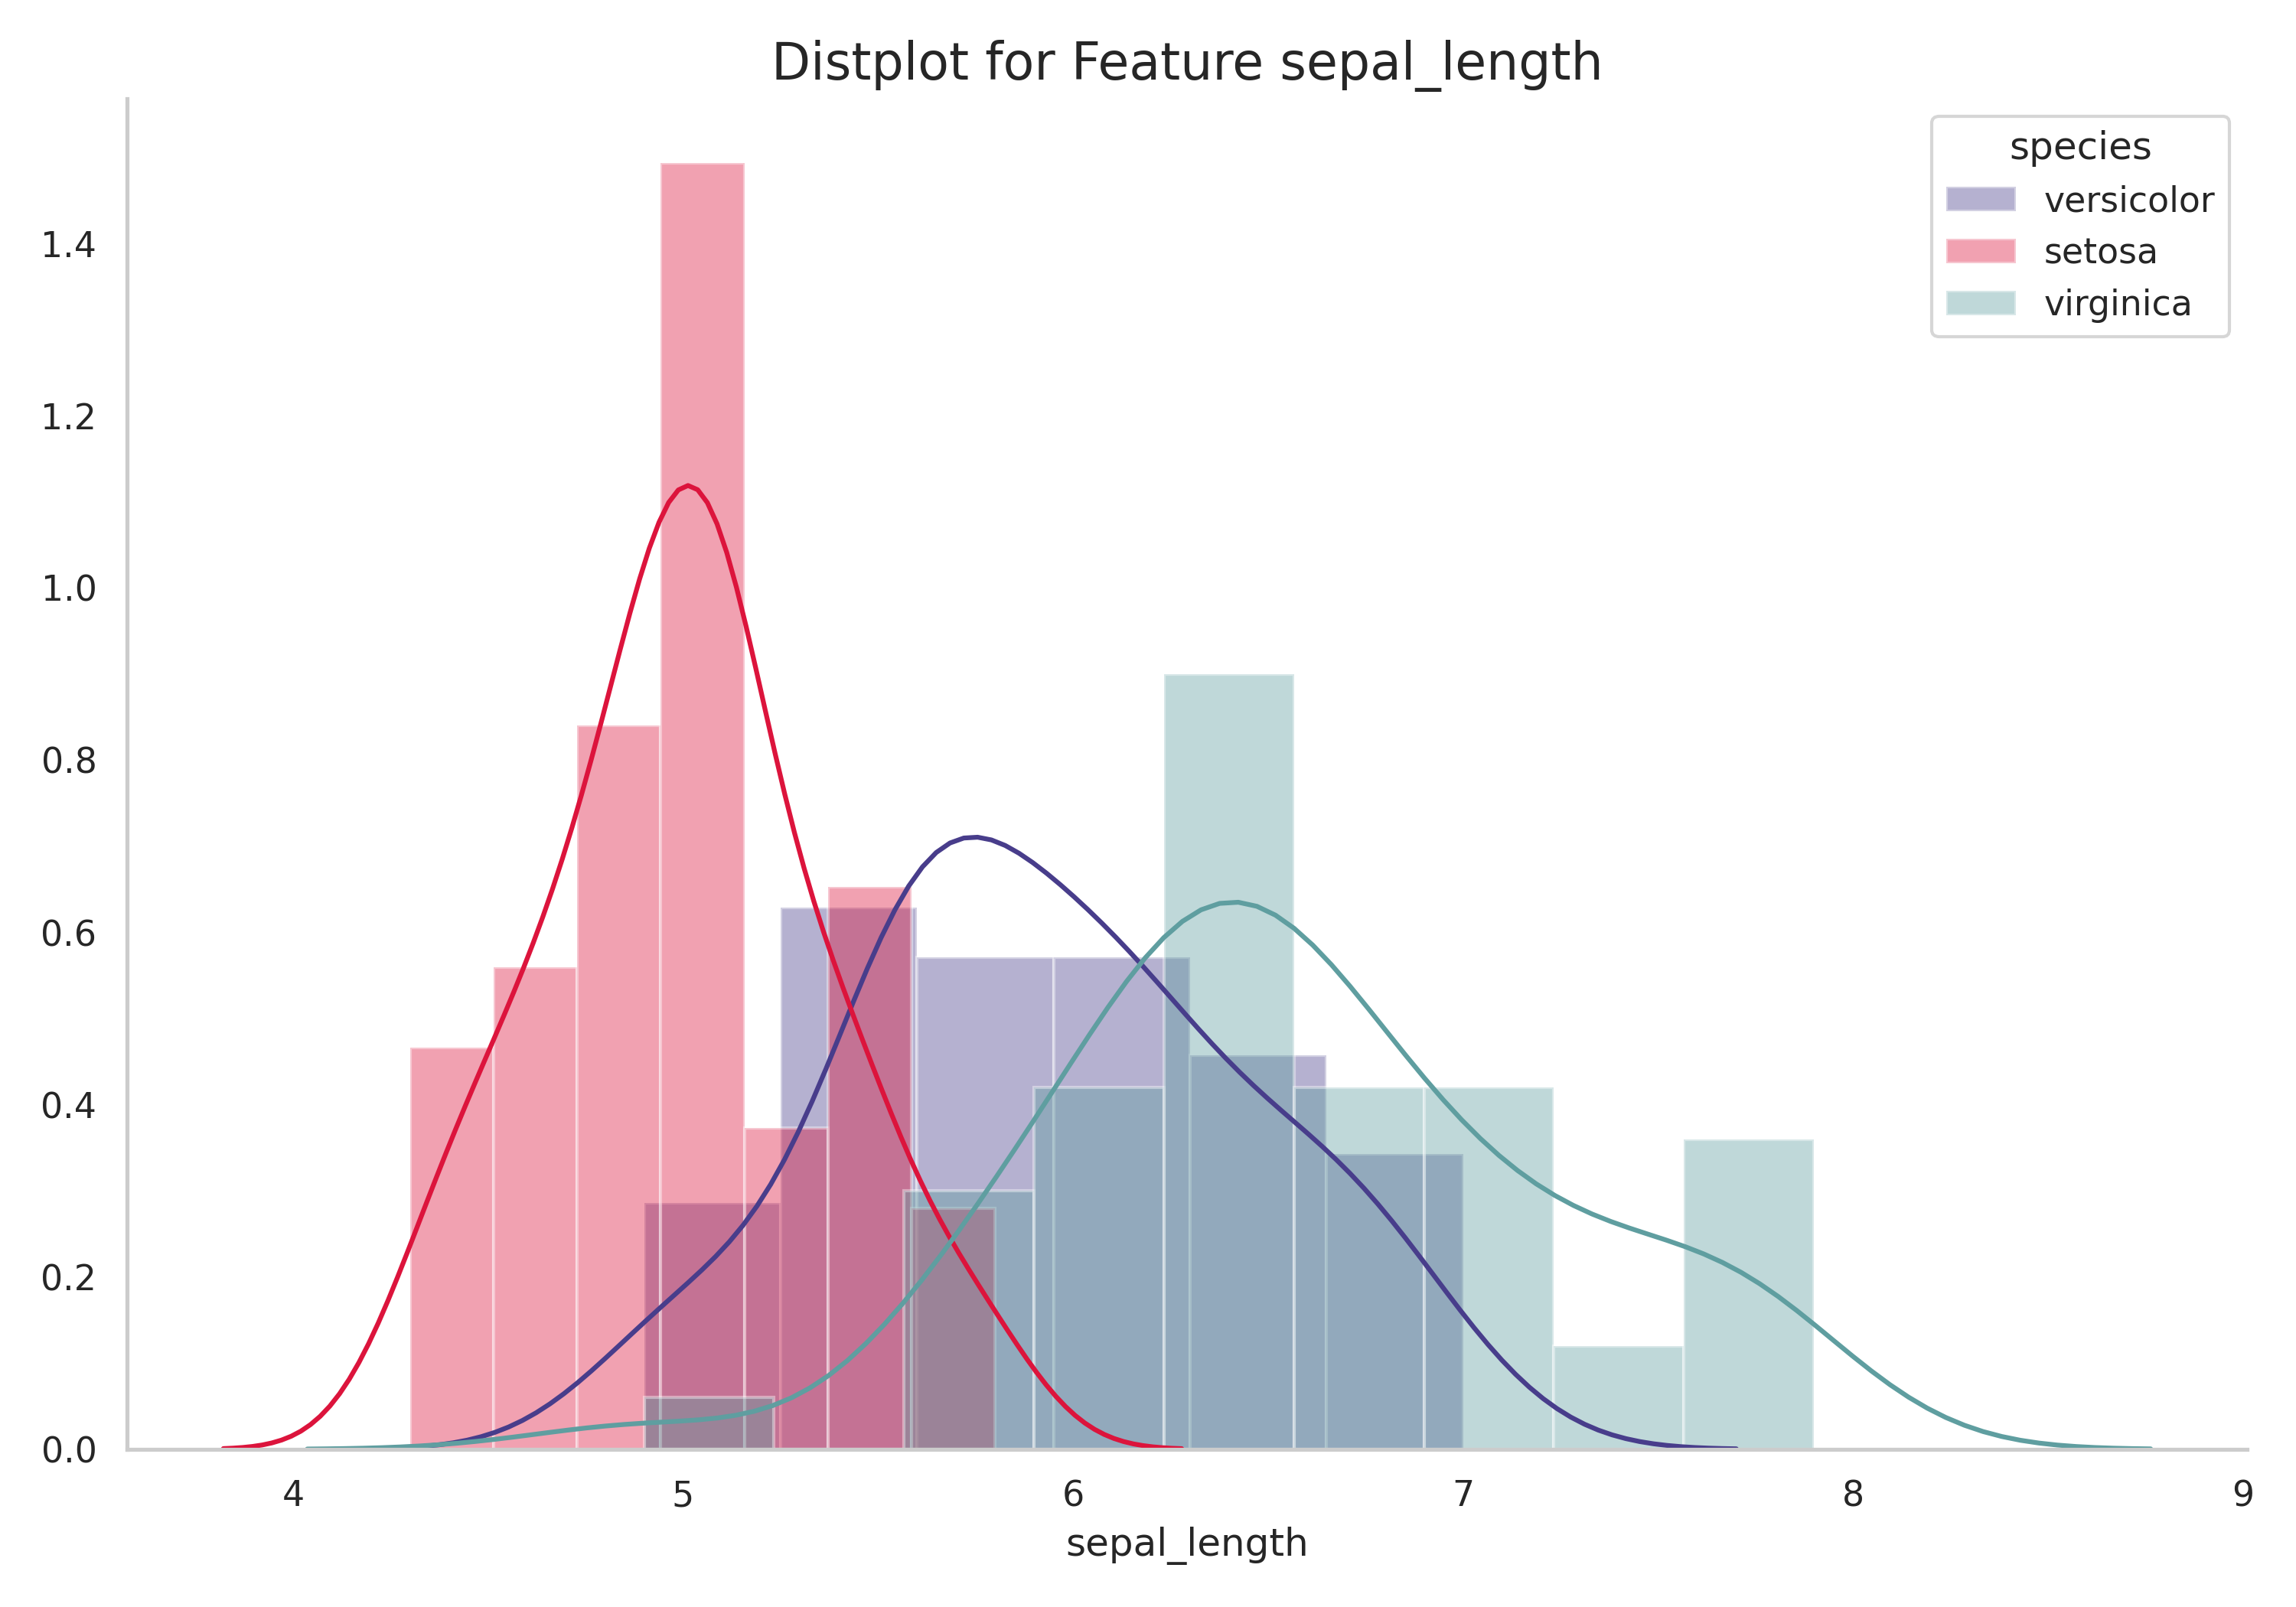
Another example uses the iris dataset also read from seaborn load_dataset() function. In this case, we can use the plot_distplot() xplotter funcion for visualize the distribution of sepal_length feature for each species in a fast and direct way:
iris = seaborn.load_dataset('iris')
plot_distplot(df=iris, col='sepal_length', hue='species')
Let's see the beautiful distribution plot the function above generated for you:
There are much more you can do using insights module from xplotter package. It's a hole world to be explore and a bunch of business questions that can be answeared through visualization charts easy plotted through those already coded functions. In the next topic, this documentation will share with you some of real world implementations using xplotter.
Usage Around the World
For being easy and simple, xplotter can have alot of applications. One of the most famous one is the notebook Titanic Dataset Exploration posted on Kaggle by Thiago Panini. This well written notebook uses the insight module for plotting beautiful charts and building a really complete Exploratory Data Analysis proccess and, by now, it achieve a bronze medal with 32 upvotes by Kaggle's community and a incredible mark of more than 1,600 views!

Contribution
The xplotter python package is an open source implementation and the more people use it, the more happy the developers will be. So if you want to contribute with xplotter, please feel free to follow the best practices for implementing coding on this github repository through creating new branches, making merge requests and pointig out whenever you think there is a new topic to explore or a bug to be fixed.
Thank you very much for reaching this and it will be a pleasure to have you as xplotter user or developer.
Social Media
Follow me on LinkedIn: https://www.linkedin.com/in/thiago-panini/ See my other Python packages: https://github.com/ThiagoPanini


Download files
Download the file for your platform. If you're not sure which to choose, learn more about installing packages.
Source Distribution
Built Distribution
Filter files by name, interpreter, ABI, and platform.
If you're not sure about the file name format, learn more about wheel file names.
Copy a direct link to the current filters
File details
Details for the file xplotter-0.0.6.tar.gz.
File metadata
- Download URL: xplotter-0.0.6.tar.gz
- Upload date:
- Size: 25.2 kB
- Tags: Source
- Uploaded using Trusted Publishing? No
- Uploaded via: twine/3.4.1 importlib_metadata/4.0.1 pkginfo/1.7.0 requests/2.25.1 requests-toolbelt/0.9.1 tqdm/4.60.0 CPython/3.8.0
File hashes
| Algorithm | Hash digest | |
|---|---|---|
| SHA256 |
abed8d79424ee3ba2cec3b571b25a205ab77e064fded3e8005887e246c5e41c7
|
|
| MD5 |
534b2bbdb3ee349748972939e9b9d110
|
|
| BLAKE2b-256 |
58f5f52279cb0b9fb825e09af5aa0877e7ef87b54c6174ee6a052825b4ef9c90
|
File details
Details for the file xplotter-0.0.6-py3-none-any.whl.
File metadata
- Download URL: xplotter-0.0.6-py3-none-any.whl
- Upload date:
- Size: 21.6 kB
- Tags: Python 3
- Uploaded using Trusted Publishing? No
- Uploaded via: twine/3.4.1 importlib_metadata/4.0.1 pkginfo/1.7.0 requests/2.25.1 requests-toolbelt/0.9.1 tqdm/4.60.0 CPython/3.8.0
File hashes
| Algorithm | Hash digest | |
|---|---|---|
| SHA256 |
66fd90ea9859701c661a8a1f428922b74184593c6722b78475e82364b01a6e57
|
|
| MD5 |
288de6395cbab4a1fe42005906a7085d
|
|
| BLAKE2b-256 |
0cea6c79575493b2ac87677560015fb5b254aedaf0ffb571d889c76ed99ed01b
|


