
yFiles Jupyter Graphs for SPARQL
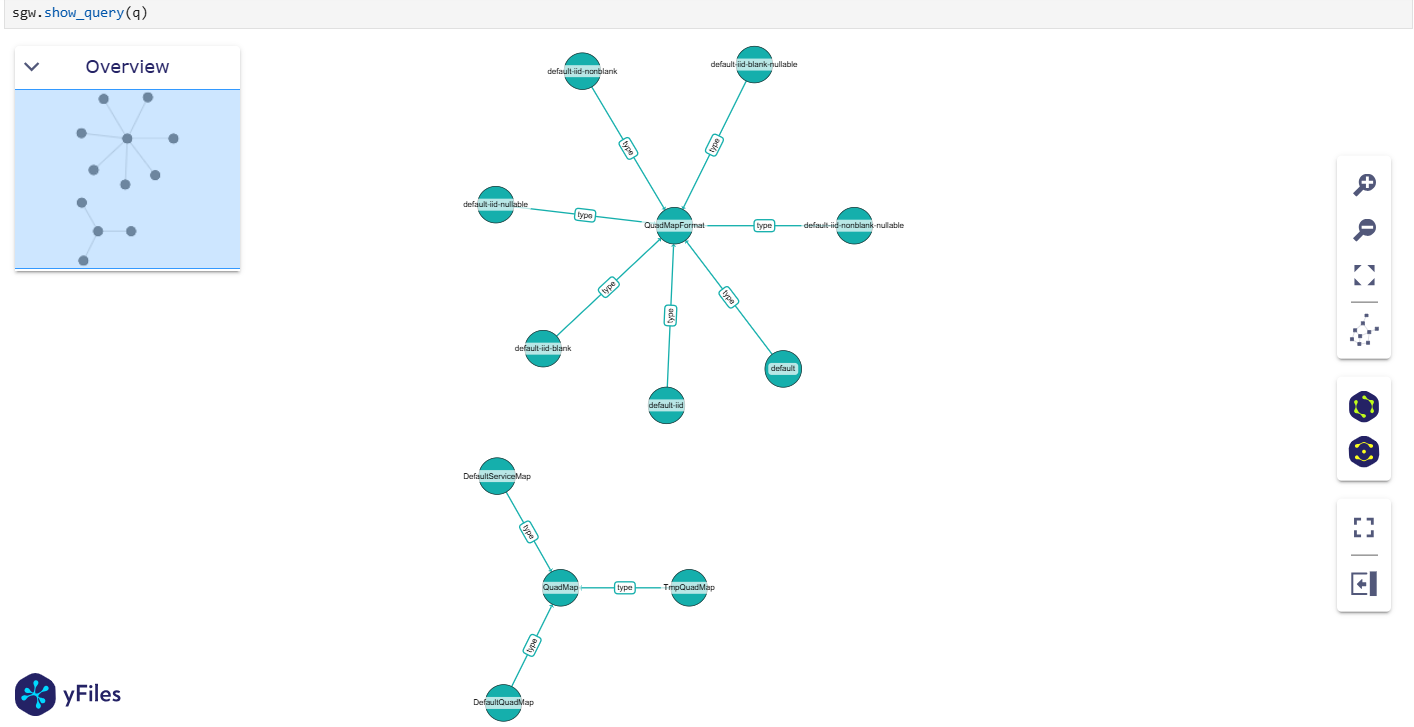
Easily visualize a SPARQL query for RDF graphs in a Jupyter Notebook.
This packages provides an easy-to-use interface to the yFiles Graphs for Jupyter widget to directly visualize queries.
Installation
Just install it from the Python Package Index
pip install yfiles_jupyter_graphs_for_sparql==2.0.0
or see README_DEV.md to build it yourself.
Usage
from SPARQLWrapper import SPARQLWrapper
from yfiles_jupyter_graphs_for_sparql import SparqlGraphWidget

g = SparqlGraphWidget(wrapper=SPARQLWrapper("http://dbpedia.org/sparql"))

q = """
    SELECT ?sub ?p ?ob
    WHERE {
        ?sub ?p ?ob .
    }
    """
g.show_query(q)
See examples
Supported Environments
The widget uses yFiles Graphs for Jupyter at its core, and therefore runs in any environment that is supported by it, see supported environments.
AI Coding Assistant
Working with an AI coding agent? Our agent guide contains instructions and best practices for coding agents working with this SPARQL widget.
Example start prompt:
Read the instructions at https://raw.githubusercontent.com/yWorks/yfiles-jupyter-graphs-for-sparql/refs/heads/main/agent-guide.md.
Then, create a Jupyter notebook that connects to a SPARQL endpoint and visualizes an insightful subset of the RDF graph using `yfiles_jupyter_graphs_for_sparql`.
Documentation
The main class SparqlGraphWidget provides the following API:
Constructor
SparqlGraphWidget: Creates a new class instance with the following arguments
| Argument | Description | Default |
|---|---|---|
limit |
The node limit which is added to all queries | 50 |
wrapper |
A SPARQL wrapper, that is used to send queries to | None |
layout |
Can be used to specify a general default node and edge layout. Available algorithms are: "circular", "hierarchical", "organic", "interactive_organic", "orthogonal", "radial", "tree", "map", "orthogonal_edge_router", "organic_edge_router" | organic |
The constructor arguments are also available as properties and can be changed after construction:
g.limit = 100
g.layout = "hierarchical"
g.wrapper = SPARQLWrapper("http://dbpedia.org/sparql")
Methods
show_query(query, layout: Optional[str] = None)query: The query that should be visualized.layout (Optional[str]): The graph layout that is used. This overwrites the general layout in this specific graph instance. The following arguments are supported:hierarchicalorganicinteractive_organiccircularcircular_straight_lineorthogonaltreeradialmaporthogonal_edge_routerorganic_edge_router
To get an overview of the data structure, you can use the following function.
The output is constrained by the limit property, meaning
only a partial schema may be displayed depending on the dataset.
show_schema()
The graph visualization can be adjusted by adding configurations to each node label or edge type with the following functions:
-
add_subject_configuration(predicate: Union[str, list[str]], **kwargs: Dict[str, Any])predicate: The predicate of the subject this configuration should be used for.**kwargs: Visualization configuration for the given node label. The following arguments are supported:text: The text that displayed at the node. By default, the node's label is used.color: A convenience color binding for the node (see alsostylesargument).size: The size of the node.styles: A dictionary that may contain the following attributescolor,shape(one of 'ellipse', ' hexagon', 'hexagon2', 'octagon', 'pill', 'rectangle', 'round-rectangle' or 'triangle'),image.property: Allows to specify additional properties on the node, which may be bound by other bindings.type: Defines a specific "type" for the node as described in yFiles Graphs for Jupyter which affects the automatic positioning of nodes (same "type"s are preferred to be placed next to each other).parent_configuration: Configure grouping for this node label. See configurations_example.ipynb for examples.heat: A heat value in between 0 and 1.
-
add_object_configuration(predicate: Union[str, list[str]], **kwargs: Dict[str, Any])predicate: The predicate of the object this configuration should be used for.**kwargs: Visualization configuration for the given node label. The following arguments are supported:text: The text that displayed at the node. By default, the node's label is used.color: A convenience color binding for the node (see alsostylesargument).size: The size of the node.styles: A dictionary that may contain the following attributescolor,shape(one of 'ellipse', ' hexagon', 'hexagon2', 'octagon', 'pill', 'rectangle', 'round-rectangle' or 'triangle'),image.property: Allows to specify additional properties on the node, which may be bound by other bindings.type: Defines a specific "type" for the node as described in yFiles Graphs for Jupyter which affects the automatic positioning of nodes (same "type"s are preferred to be placed next to each other).parent_configuration: Configure grouping for this node label. See configurations_example.ipynb for examples.heat: A heat value in between 0 and 1.
-
add_predicate_configuration(type: Union[str, list[str]], **kwargs: Dict[str, Any])type: The predicate type(s) for which this configuration should be used. Supports*to address all types.**kwargs: Visualization configuration for the given predicate type. The following arguments are supported:text: The text that displayed at the edge. By default, the predicate's type is used.color: The edge's color.thickness_factor: The edge's stroke thickness factor. By default,1.property: Allows to specify additional properties on the edge, which may be bound by other bindings.heat: A heat value in between 0 and 1.
-
add_parent_relationship_configuration(type: Union[str, list[str]], reverse: Optional[bool] = False) -> Nonetype: The predicate type that should be visualized as node grouping hierarchy instead of the actual relationship.reverse: By default the target node is considered as parent. This can be reverted with this argument.
For a detailed documentation look at the core widget
To remove a configuration use the following functions:
del_object_configuration(type): Deletes configuration for the given object predicate type.del_subject_configuration(type): Deletes configuration for the given subject predicate type.del_edge_configurations(type): Deletes configuration for the given predicate type.del_parent_predicate_configuration(type: Union[str, list[str]]) -> None: Deletes configuration for the given parent predicate type(s).
How configuration bindings are resolved
The configuration bindings (see add_object_configuration, add_subject_configuration or add_predicate_configuration) are resolved as follows:
If the configuration binding is a string, the package first tries to resolve it against the item's properties and uses the property value if available. If there is no property with the given key, the string value itself is used as a constant binding.
In case you want to create a constant string value as binding, which also happens to be a property key, use a binding function with a constant string as return value instead.
If the configuration binding is a function, the return value of the function is used as value for the respective configuration.
yFiles Graphs for Jupyter
The graph visualization is provided by yFiles Graphs for Jupyter, a versatile graph visualization widget for Jupyter Notebooks.
It can import and visualize graphs from various popular Python packages (e.g. NetworkX, PyGraphviz, igraph) or just structured node and edge lists.
And provides a rich set of visualization options to bring your data to life (see the example notebooks).
Feature Highlights
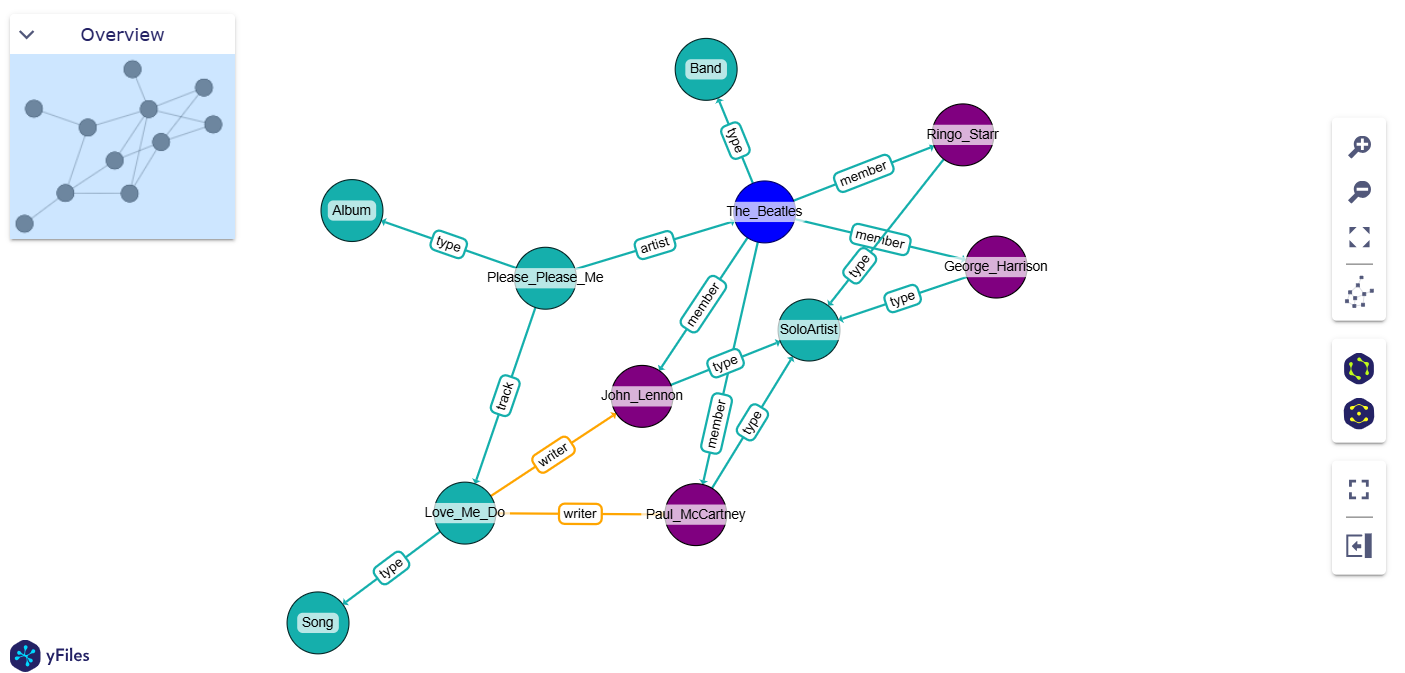 Mapping visualization
 |
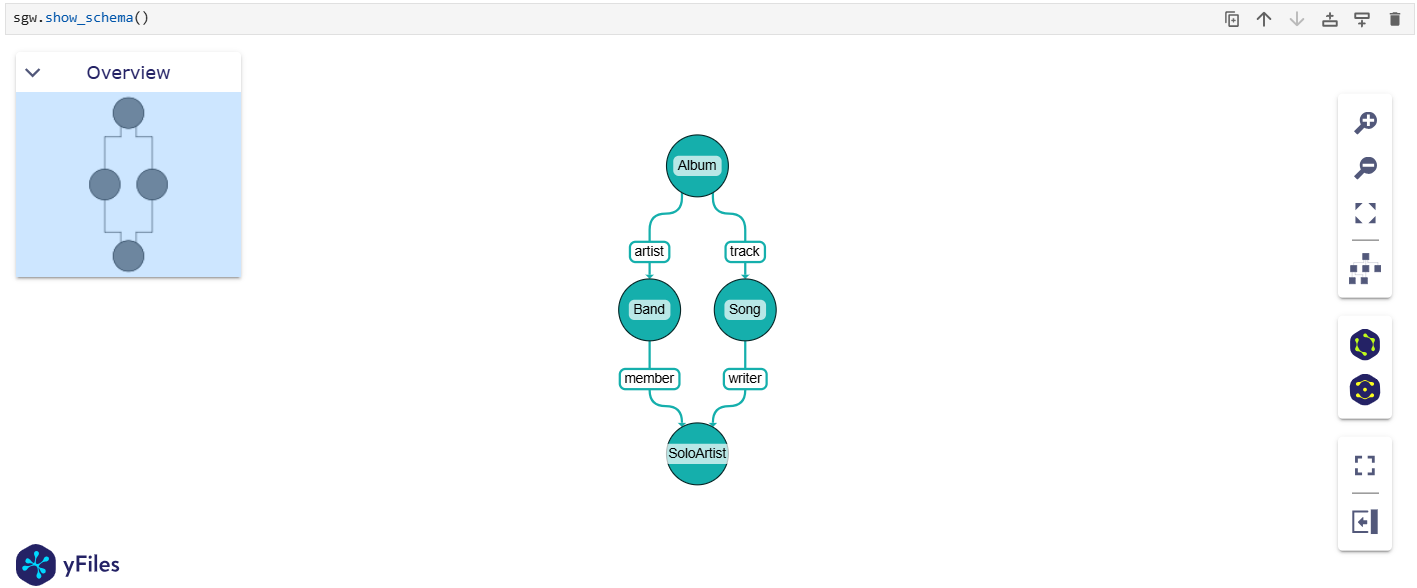 Schema visualization
 |
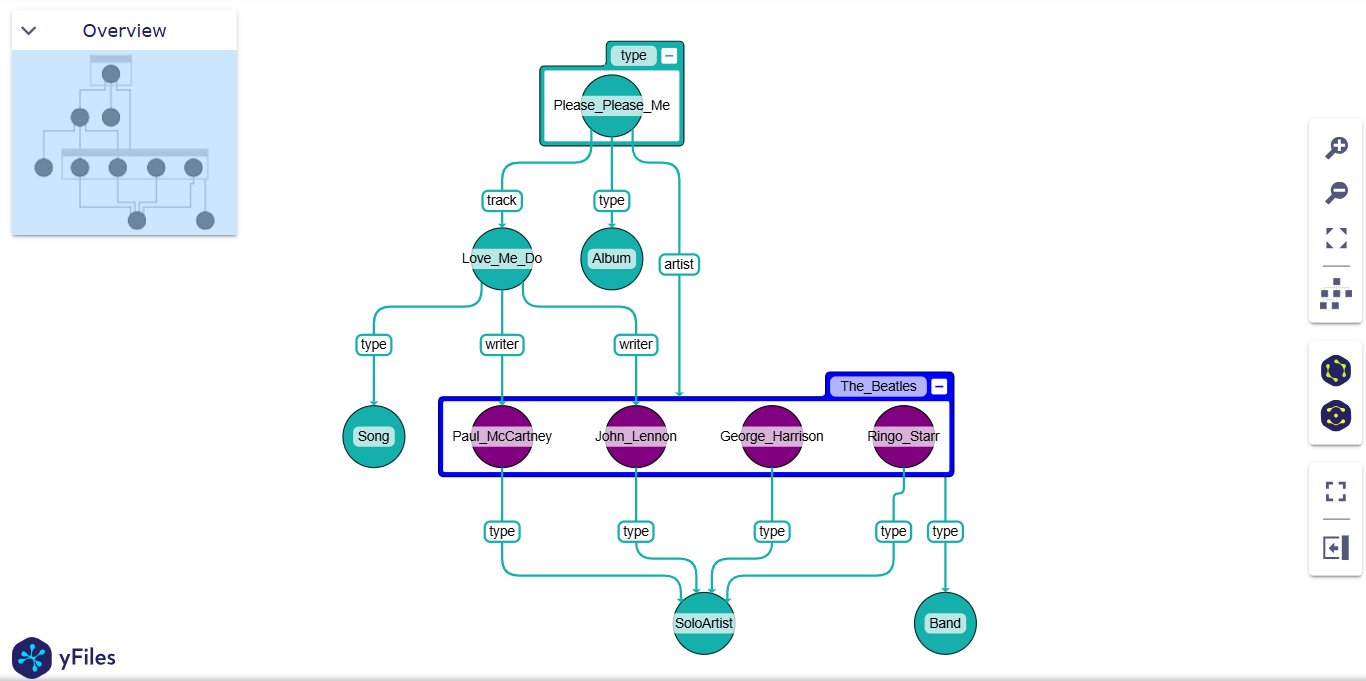 Grouping visualization
 |
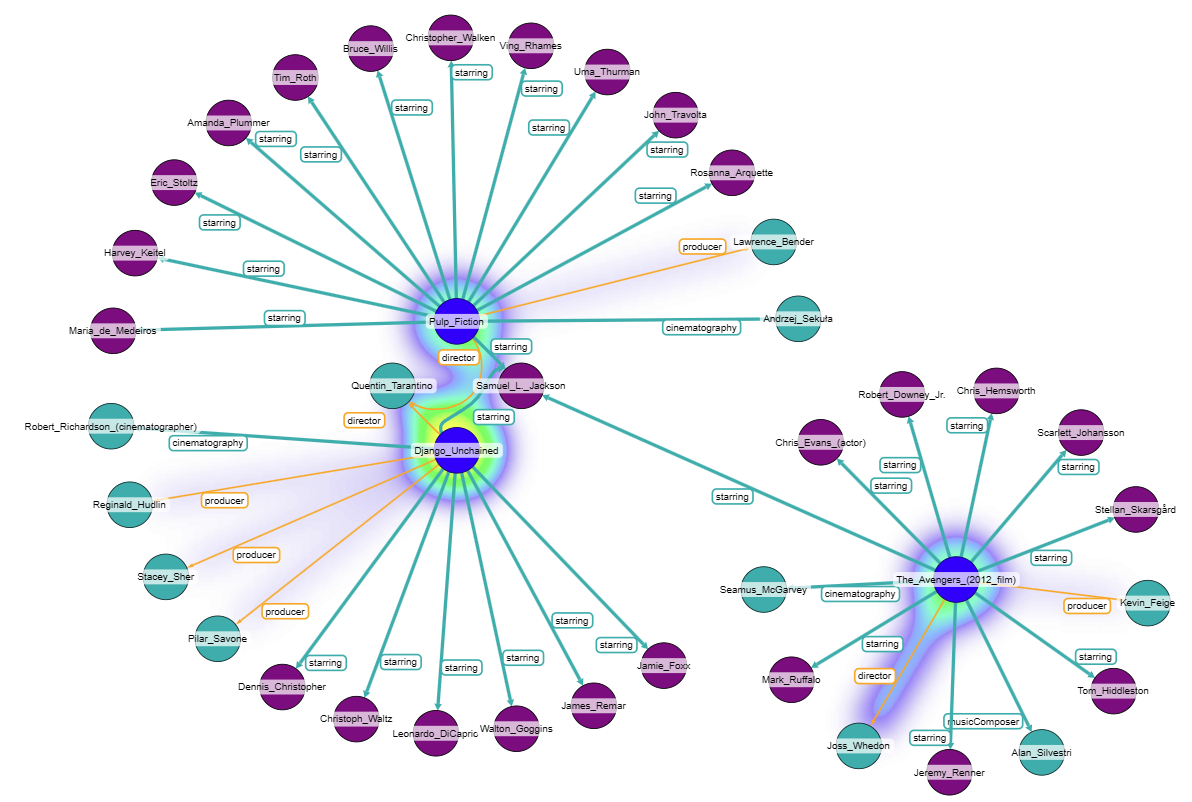 Heat Mapping
 |
For a detailed feature guide, check out the main widget example notebooks
Code of Conduct
This project and everyone participating in it is governed by the Code of Conduct. By participating, you are expected to uphold this code. Please report unacceptable behavior to contact@yworks.com.
Feedback
This widget is by no means perfect. If you find something is not working as expected we are glad to receive an issue report from you. Please make sure to search for existing issues first and check if the issue is not an unsupported feature or known issue. If you did not find anything related, report a new issue with necessary information. Please also provide a clear and descriptive title and stick to the issue templates. See issues.
Dependencies
License
See LICENSE file.


Release files for yfiles-jupyter-graphs-for-sparql 2.0.0
For a detailed explanation of source distributions (sdists) and built distributions (wheels), please see the package formats documentation.
Source distribution (sdist)
| File | Size | Uploaded | |
|---|---|---|---|
| yfiles_jupyter_graphs_for_sparql-2.0.0.tar.gz | 16.5 kB | Details |
Built distribution (wheel)
| File | Interpreter | ABI | Platform | Reset |
|---|---|---|---|---|
| yfiles_jupyter_graphs_for_sparql-2.0.0-py3-none-any.whl | Python 3 | none | any | Details |
Total release size: 29.8 kB
Release files / yfiles_jupyter_graphs_for_sparql-2.0.0.tar.gz
| Download URL | yfiles_jupyter_graphs_for_sparql-2.0.0.tar.gz |
|---|---|
| Size | 16.5 kB |
| Tags | Source |
|
SHA-256 checksum How to use checksums |
9b74fc1ecb88b5e86398d5da2ff54a52076049c6cd2444f0e620cf86e2f18faf
|
|
BLAKE2b-256 checksum How to use checksums |
294ed56e363bdc486b2e287b3da8595a062758377a89b81ac614f8d6d2747833
|
| Upload date | |
|
Uploaded using Trusted Publishing? What is trusted publishing? |
Yes |
| Uploaded via |
twine/7.0.0 CPython/3.13.14
|
Provenance
Provenance describes where a file came from. On PyPI, provenance is shared via attestations, which provide a verifiable record of the build or publishing details. View details, limitations and caveats.


PyPI Publish Attestation
PyPI verified that this artifact, at this checksum, originated from the publisher listed below.
Signed by GitHub Actions, verified by PyPI on Aug 25, 2026.
Transparency logRelease files / yfiles_jupyter_graphs_for_sparql-2.0.0-py3-none-any.whl
| Download URL | yfiles_jupyter_graphs_for_sparql-2.0.0-py3-none-any.whl |
|---|---|
| Size | 13.3 kB |
| Tags | Python 3 |
|
SHA-256 checksum How to use checksums |
98c00a0f9853597fcef89821e74de79d3346a3170d4341325fa4ab79a0a99d91
|
|
BLAKE2b-256 checksum How to use checksums |
52c3e257b8532c1def63e1d7685a223b24440e83673f497535d9d6f9f2d2839b
|
| Upload date | |
|
Uploaded using Trusted Publishing? What is trusted publishing? |
Yes |
| Uploaded via |
twine/7.0.0 CPython/3.13.14
|
Provenance
Provenance describes where a file came from. On PyPI, provenance is shared via attestations, which provide a verifiable record of the build or publishing details. View details, limitations and caveats.
PyPI Publish Attestation
PyPI verified that this artifact, at this checksum, originated from the publisher listed below.
Signed by GitHub Actions, verified by PyPI on Aug 25, 2026.
Transparency log













