
YHat Labs Python Library
The official Python library for the YHat Labs time-series and tabular foundation models. Frontier AI models for forecasting, anomaly detection, classification, regression and feature importance, built for production workloads: no feature engineering or model training, with uncertainty and explanations built in.
- Time-series forecasting with ChakraTS: a drop-in alternative to ARIMA, Prophet or a trained deep-learning model. It forecasts one series or thousands, with a range of likely outcomes around every point.
- Tabular prediction with ChakraTab: classification and regression on tables, typically more accurate than tuned gradient boosting such as XGBoost or LightGBM on public benchmarks.
Both are pretrained foundation models: they work on your data as it is, with nothing to train, tune or maintain.
Installation
pip install yhatlabs
Optional extras: [sklearn] for the scikit-learn estimators, [parquet] for faster large tables, [plot] for charts,
[fast] for faster encoding, or [all]. Requires Python 3.9 or later.
Usage
The full documentation of the models and the API is in the Docs.
Every call needs an API key. Get an API key here, then set it in your environment:
export YHAT_API_KEY="<your-key>"
The client reads it from there, so it never ends up in your code. You can also pass Client(api_key=...), or keep it in a
.env file loaded with python-dotenv.
To use your own deployment instead of the hosted API, set its address:
export YHAT_BASE_URL="https://your-deployment.example.com"
Pick what you want to do:
- Time-series forecasting: forecasts with uncertainty, backtests, what-if scenarios, anomalies and gaps.
- Tabular prediction: classification and regression, prediction intervals, column importance, scikit-learn estimators.
- Check your data first: local checks before anything is sent.
- Advanced usage: the command line, coding agents, async, configuration and errors.
Time-series forecasting
ChakraTS forecasts one series or many at once. Every forecast comes with an uncertainty range, so you see both the most likely path and how far reality could stray from it.
import pandas as pd
from yhatlabs import Client

url = "https://raw.githubusercontent.com/jbrownlee/Datasets/master/"
df = pd.read_csv(url + "airline-passengers.csv")

yh = Client()
fc = yh.forecast(
    df, h=24, time_col="Month", target_col="Passengers", level=[80]
)
print(fc.df.head(3))
  unique_id      Month    q10  median    q90
0  series_0 1961-01-01  428.7   446.2  466.0
1  series_0 1961-02-01  406.1   428.9  449.8
2  series_0 1961-03-01  442.7   482.7  507.2
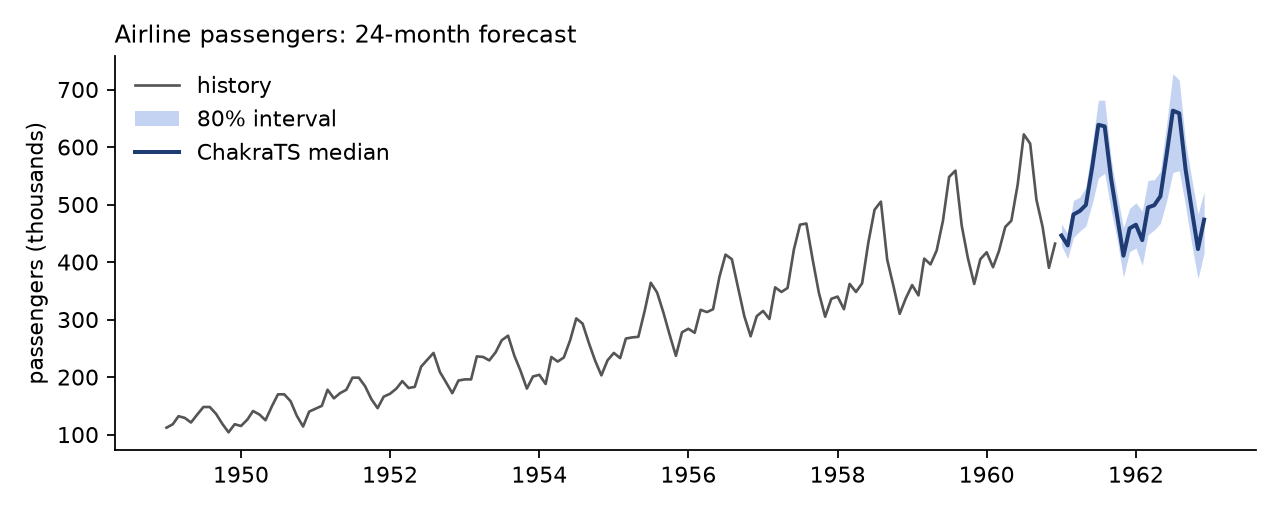
For many series, add an id column (unique_id, id or item_id). The time column (ds, timestamp, date) and the target
(y, target, value) are found by name as well. The client parses timestamps, infers the frequency, fills missing
timestamps and splits large inputs into requests for you.
What you can do
| Goal | Call |
|---|---|
| Forecast with a range of outcomes | yh.forecast(df, h) |
| Use inputs you know ahead (prices, weather, promotions) | yh.forecast(df, h, known=[...], future=...) |
| Add calendar effects (hour, weekday, holidays) | yh.forecast(df, h, calendar=True) |
| Measure accuracy on your own history | yh.evaluate(df, h, windows=3) |
| Compare with the forecast you use today | yh.evaluate(df, h, compare={"current": mine}) |
| Ask "what if" (a heatwave, a price change) | yh.scenarios(df, h, {"base": f0, "heatwave": f1}, known=[...]) |
| Flag unusual points | yh.detect_anomalies(df) |
| Fill gaps inside series | yh.fill_gaps(df) |
Inputs and uncertainty
Forecasts get better when you tell the model what you already know about the future, and more useful when the uncertainty matches your decision.
from yhatlabs.features import make_future

# the next 24 timestamps of every series, to fill in with what you know ahead
future = make_future(df, h=24)
future["temperature"] = weather_forecast

fc = yh.forecast(
    df,
    h=24,
    known=["temperature"],
    future=future,
    calendar=True,
    quantiles=[0.05, 0.5, 0.95],
)
fc.plot(history=df)
- Uncertainty: the default is the median plus the 0.1 and 0.9 quantiles.
quantiles=takes any levels between 0.1 and 0.9.level=[80]gives central intervals.quantiles="all"returns every level the model produces.- Levels between those are interpolated and listed in
fc.derived, so nothing derived is presented as a model output.
- Covariates:
known=[...]are columns you know ahead, with their future values infuture=;past=[...]are observed only in the history;static=[...]are constants per series, such as region or store size;calendar=Trueadds hour, weekday, month and weekend, with no future frame needed;calendar={"holidays": "US"}adds holidays.
- Several targets per series:
target_col=["load", "price"]forecasts them jointly.
Backtesting
Before relying on a forecast, measure it on your own history: what would it have predicted at past points, and how close was it?
ev = yh.evaluate(
    df, h=24, windows=4, time_col="Month", target_col="Passengers"
)
ev.summary      # accuracy per model, and skill vs seasonal naive
ev.calibration  # does the 80% interval really hold 80%?
- How it works:
evaluatecuts each series at several points near its end, forecasts from each cut using only the data before it, and scores the forecasts against what happened. - Skill:
skill_<metric>compares with the first baseline. Above 0 means the model beats it. - Your own forecast:
compare={"current": df}scores it alongside. It takes id and time plus quantile columns (median,q10, ...) or a singleforecastcolumn. - Calibration:
ev.calibrationreports the observed share below each quantile and inside each interval, next to the nominal level.ev.plot_calibration()draws it.
Anomalies and gaps
The same model that forecasts can tell you which recent points it did not expect, and what a missing value most likely was.
# a score and an anomaly flag for each recent point
flags = yh.detect_anomalies(df, h=24, windows=5)

# missing values filled from the history before each gap
filled = yh.fill_gaps(df)
- Scores: each point is compared with a forecast made from the data before it. The score is the distance from the median
in units of that forecast's own spread, so a point the model was unsure about needs a larger miss to count.
threshold(default 3) sets what gets flagged. - Gaps: each gap gets the median forecast from the data before it, and
<target>_filledmarks what was filled.
Tabular prediction
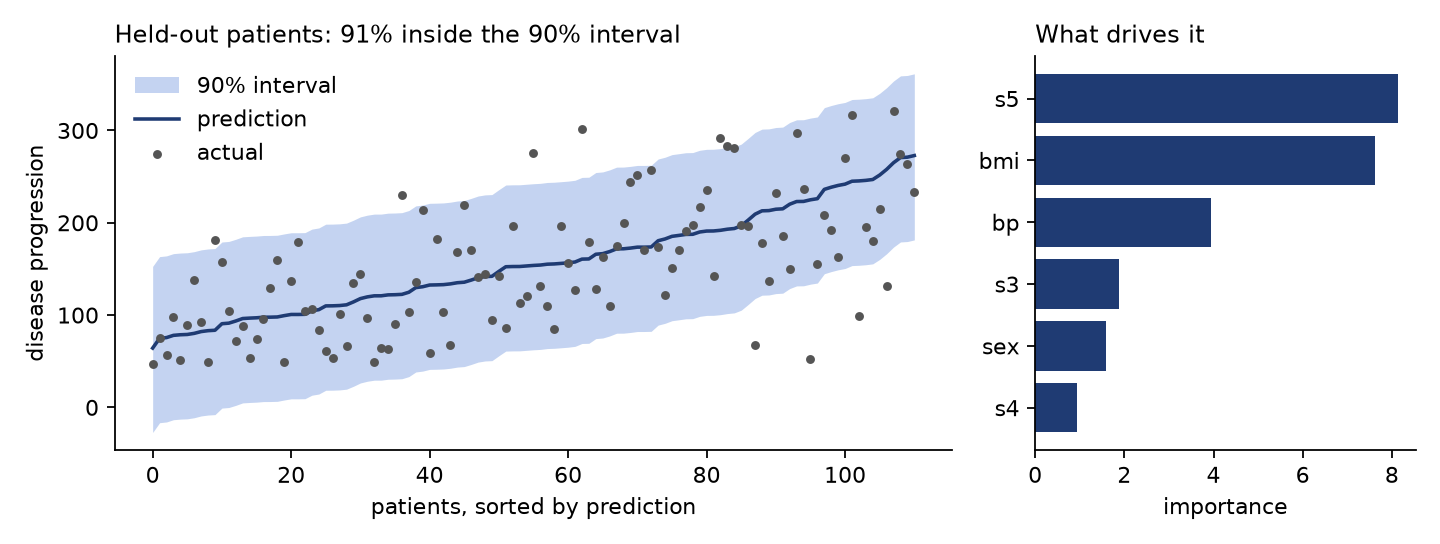
ChakraTab learns the relationship between the columns of a table from your labeled rows, then predicts the answer for new rows. It handles numbers, categories, dates and missing values as they are.
from sklearn.datasets import load_breast_cancer
from sklearn.model_selection import train_test_split
from yhatlabs import Client

X, y = load_breast_cancer(return_X_y=True, as_frame=True)
X_train, X_test, y_train, y_test = train_test_split(X, y, random_state=0)

yh = Client()
model = yh.fit(X_train.assign(diagnosis=y_train), target="diagnosis")
res = model.predict(X_test)
print(res.df.head(3))
     prediction    p_0    p_1
512           0  1.000  0.000
457           1  0.018  0.982
439           1  0.000  1.000
The fit happens once, on our side; every predict after it sends only the new rows. For a number instead of a class,
ask for an interval as well:
model = yh.fit(train, target="progression", task="regress")
# prediction, q5, median and q95 for every test row
res = model.predict(test, quantiles=[0.05, 0.5, 0.95])

# which columns drive the predictions
model.importance(holdout)
What you can do
| Goal | Call |
|---|---|
| Classify (with probabilities) or regress | yh.fit(train, target).predict(test) |
| Get prediction intervals for numbers | model.predict(test, quantiles=[0.05, 0.95]) |
| See which columns matter | model.importance(holdout) |
| Reuse a fit later, anywhere | model.save("model.json"), then yhatlabs.load("model.json") |
| Predict once, keeping nothing | yh.predict(train, target, test) |
| Fill missing cells | yh.impute(df) |
| Use it in scikit-learn | ChakraTabClassifier(), ChakraTabRegressor() |
Fitting, intervals and importance
A fit stays available so you can score new rows as they arrive, explain the model, and share it with a teammate, without sending the training data again.
- Lifetime: a fit is kept for
ttl_hours(default 24, up to 168), or untilmodel.delete(). Awith yh.fit(...) as model:block deletes it on exit.model.save(path)writes a small record, with no training data, thatyhatlabs.load()reattaches anywhere. - Classes and numbers: classification returns
predictionsandprobabilities. Regression returnspredictionsand, withquantiles=, intervals built from out-of-sample errors, so a 90% interval holds about 90% of new values. Passtask="classify"ortask="regress"for integer targets, which could be either. - Presets:
fastis the default;mediumis more accurate and about 3x slower.eval_metric=,time_limit=andseed=are also accepted. - Importance: how much the score drops when a column is shuffled. Labeled rows the model has not seen give the most honest numbers.
scikit-learn
ChakraTab drops into existing scikit-learn code as an estimator, so pipelines, grid searches and cross-validation work unchanged.
from yhatlabs.integrations import ChakraTabClassifier
from sklearn.model_selection import cross_val_score

cross_val_score(ChakraTabClassifier(preset="medium"), X, y, cv=5)
The estimators fit once and reuse the fit for every prediction, and they pickle. ChakraTabRegressor.predict_quantiles(X)
gives intervals.
Check your data first
Most surprises in a forecast or a prediction start in the data. check looks at it locally, before anything is sent, and
tells you what it found and how to fix it.
import yhatlabs

# series: duplicates, gaps, frequency, short history, extreme values
yhatlabs.check(df, h=24)

# tables: id-like columns, columns that leak the target, imbalance
yhatlabs.check(train, target="churn")
- Local and free: it needs no key, and nothing leaves your machine.
- What you get: each finding has a severity, a location and a suggested fix.
.okis False when something would fail. - Seeing the clean-up: for series,
.repaired()returns the data after the same clean-upforecastapplies.
Advanced usage
Command line and coding agents
Everything above also runs from the terminal, on CSV or parquet files, which suits scripts, schedulers and AI coding agents.
yhatlabs check sales.csv --h 28
yhatlabs forecast sales.csv --h 28 --level 80 -o forecast.csv
yhatlabs evaluate sales.csv --h 28 --windows 3
yhatlabs anomalies meters.parquet --only
yhatlabs predict train.csv --target churn --test new.csv -o scored.csv
yhatlabs whoami
- Machine-readable output:
--jsonon any command.checkexits with code 2 on errors, so it can gate a pipeline. - Coding agents:
yhatlabs skills installwrites a skill into the current project for Claude Code, Cursor, Codex and similar agents, so they know the calls and the rules. - Short alias:
yhatworks too.
Async
For services and notebooks that already run an event loop, AsyncClient offers the same calls as coroutines.
from yhatlabs import AsyncClient

async with AsyncClient() as yh:
    fc = await yh.forecast(df, h=24)
    model = await yh.fit(train, target="churn")
Configuration and visibility
The defaults suit most work. These settings are there for long jobs, self-hosted endpoints and debugging.
| Setting | How |
|---|---|
| API key | Client(api_key=...) or YHAT_API_KEY |
| Server | base_url= or YHAT_BASE_URL (default https://api.yhatlabs.com) |
| Timeout and retries | timeout= (default 300 s), max_retries= (default 3); for a single call, yh.with_options(timeout=1800) |
| Parallel requests | max_concurrency= (default 4) |
| Request logging | YHAT_LOG=info: method, path, status, time and request id (never data or keys) |
| Activity line | shown in terminals for calls over 2 s; YHAT_PROGRESS=0 turns it off |
- Request caps: read from the API on first use, and applied when splitting inputs.
- Your key:
yh.whoami()checks it and shows the models it can use and its quota. - Provenance: every result carries
.provenance: model, settings, request ids, SDK version and a fingerprint of the input, enough to rerun or cite it..timinggives the client-side total and, for tables, the server's fit/predict split. - Polars: input works wherever pandas does, and results have
.to_polars().
Errors and retries
Errors tell you whose side the problem is on and what to do next. Temporary problems are retried for you.
- Before anything is sent:
DataErrorsays how to fix the input, andUnsupportedErrormeans the model can't do what was asked. - From the API:
APIErrorand its subclasses (AuthenticationError,RateLimitError,ServiceUnavailableError, ...) carry.status,.typeand.request_id. Quote the request id to us and we can trace the call. - Retries: timeouts, connection errors, 408, 409, 429 and 5xx are retried with backoff, honouring
Retry-After. A used-up quota is not retried. - Partial results: for large forecasts,
on_error="warn"returns the series from batches that succeeded and lists the rest infc.errors.
Your data
Your inputs are sent to the YHat Labs API to be processed.
- One-shot calls: nothing is kept beyond our request archive.
- Fits: a fitted model keeps its training table only until it expires or you delete it.
- More: see SECURITY.md for how keys and data are handled, and how to report a security issue.
Examples
Runnable scripts in examples/:
- Time series: energy load with weather and a heatwave scenario; sensors with gaps and a fault; stores that add up to a region.
- Tables: a fit with intervals and importance; a decision threshold set from business costs; validation for rows that arrive over time; a comparison with gradient boosting.
Development
git clone https://github.com/yhatlabs/yhatlabs-python && cd yhatlabs-python
uv venv && uv pip install -e ".[dev]"
.venv/bin/pytest -m "not live"      # offline tests against a fake API
See CONTRIBUTING.md for the checks, the changelog rule and how releases are made.
python docs/readme_images.py regenerates the images in this README from live calls.
Support
Open an issue (include the request_id from any error, never your key), or write to founders@yhatlabs.com.
License
Apache-2.0
1 maintainer

Metadata
1 maintainer
Release files for yhatlabs 0.1.1
For a detailed explanation of source distributions (sdists) and built distributions (wheels), please see the package formats documentation.
Source distribution (sdist)
| File | Size | Uploaded | |
|---|---|---|---|
| yhatlabs-0.1.1.tar.gz | 208.9 kB | Details |
Built distribution (wheel)
| File | Interpreter | ABI | Platform | Reset |
|---|---|---|---|---|
| yhatlabs-0.1.1-py3-none-any.whl | Python 3 | none | any | Details |
Total release size: 272.0 kB
Release files / yhatlabs-0.1.1.tar.gz
| Download URL | yhatlabs-0.1.1.tar.gz |
|---|---|
| Size | 208.9 kB |
| Tags | Source |
|
SHA-256 checksum How to use checksums |
680b76634f78ec6705f7999c5fdfa1aaba7e416cfe8fae084e1a7c76ffe848cc
|
|
BLAKE2b-256 checksum How to use checksums |
8bb8631b96433ec0ec04d334d149ce6e72ed5593ca445079d986db0f4e330453
|
| Upload date | |
|
Uploaded using Trusted Publishing? What is trusted publishing? |
Yes |
| Uploaded via |
twine/7.0.0 CPython/3.13.14
|
Provenance
Provenance describes where a file came from. On PyPI, provenance is shared via attestations, which provide a verifiable record of the build or publishing details. View details, limitations and caveats.


PyPI Publish Attestation
PyPI verified that this artifact, at this checksum, originated from the publisher listed below.
Signed by GitHub Actions, verified by PyPI on Oct 15, 2026.
Transparency logRelease files / yhatlabs-0.1.1-py3-none-any.whl
| Download URL | yhatlabs-0.1.1-py3-none-any.whl |
|---|---|
| Size | 63.0 kB |
| Tags | Python 3 |
|
SHA-256 checksum How to use checksums |
28da6a1a503ef4df5fd368bc74e473083cceedf8f386b4fb1070f8feb67ef37c
|
|
BLAKE2b-256 checksum How to use checksums |
4fee508111350d6d33b1ab6be36c6c8d62cd581e6769db8a88d26a3bcc07dc9a
|
| Upload date | |
|
Uploaded using Trusted Publishing? What is trusted publishing? |
Yes |
| Uploaded via |
twine/7.0.0 CPython/3.13.14
|
Provenance
Provenance describes where a file came from. On PyPI, provenance is shared via attestations, which provide a verifiable record of the build or publishing details. View details, limitations and caveats.
PyPI Publish Attestation
PyPI verified that this artifact, at this checksum, originated from the publisher listed below.
Signed by GitHub Actions, verified by PyPI on Oct 15, 2026.
Transparency log













