
yml2gantt



Write your project plan in a small YAML file, get a clean gantt chart (PDF, PNG, SVG, …) drawn with matplotlib.
gantt:
  start: 2026-01-05
  duration: 4w

tasks:
  - {name: Write, duration: 2w}
  - {name: Review, start: 2w, duration: 1w}
  - {name: Ship, start: 3w, milestone: true}
yml2gantt plan.yml -o plan.png
Features
- Plain YAML input: easy to write by hand, to diff and to keep in git
- Tasks with subtasks (a task without duration spans its subtasks)
- Milestones, on their own row or placed on a task's bar
- Interrupted tasks: several bar segments on one row
- Custom text in the bars (
label), e.g. who works on the task - Day, week, month, trimester or abstract (numbered) time scales
- Positions as dates or as offsets (
3,"2w"), lengths as durations or end dates - A "we are here" line at today's date or at any position
- Export to any format matplotlib supports (PDF, PNG, SVG, …)
- A Python API to build charts from code, or to draw into your own figures
Installation
Requires Python 3.11 or newer.
pip install yml2gantt
To use only the command line tool, pipx install yml2gantt or
uv tool install yml2gantt install it in its own environment.
Command line
yml2gantt examples/project.yml
This draws the chart, saves it as examples/project.pdf and opens a
window with it.
| Option | Effect |
|---|---|
-o, --output F |
Output file (default: <file>.pdf). The extension sets the format: .pdf, .png, .svg, … |
--no-show |
Do not open a window (for scripts, CI, servers). |
--version |
Print the version and exit. |
-h, --help |
Show the help. |
yml2gantt examples/workpackages.yml -o plan.png --no-show
python -m yml2gantt examples/sprint.yml     # same thing
On an error in the file (unknown key, bad date, …) the tool prints a
message such as yml2gantt: error: task: unknown keys ['durtion'] and
exits with status 1.
The YAML format
A file has two sections: gantt (the time axis) and tasks (the rows).
gantt:
  start: 2026-01-05
  duration: 12w
  scale: week
  title: My project

tasks:
  - name: Kick-off
    start: 0
    duration: 3d
    label: Team A                 # text in the bar (default: the name)
    milestones: [Go]              # diamond at the end of the bar

  - name: Development             # no duration: spans its subtasks
    start: 2026-01-12
    subtasks:
      - {name: Backend, start: 0, duration: 4w}
      - {name: Frontend, start: 2w, duration: 5w,
         milestones: [{name: Demo, at: 50%}]}

  - {name: Release, start: 2026-03-20, milestone: true}
Keys are case-insensitive, and task is accepted instead of name.
Unknown keys are reported as errors, so typos do not go unnoticed.
Dates, offsets and durations
| You write | Meaning |
|---|---|
2026-01-05 |
A date (ISO format). |
"2026-W02-1" |
An ISO week date: Monday of week 2 of 2026 (quote it). |
3 or 2.5 |
A number of days (on the abstract scale: a number of units). |
"3d", "2w" |
3 days, 2 weeks. Decimals work: "1.5w". |
A position (start, end, a milestone's at) is either a date or an
offset. Offsets count from the chart start for tasks, from the
parent start for subtasks, and from the task start for segments and
milestones. There is no month unit, because months have different
lengths: use dates for that.
On the abstract scale, all positions and lengths are plain numbers.
gantt section
| Key | Description |
|---|---|
start |
Start date (2026-01-05, "2025-W38-7"), or a number for the abstract scale. Default 0. |
end |
End of the chart (exclusive). Give end or duration. |
duration |
Length of the chart: days (90) or "3d", "13w". |
scale |
day, week (default), month, trimester or abstract. |
title |
Chart title. |
show_today |
Draw a red line at today's date (default true, dated scales only, ignored when now is set). Nothing is drawn if today is outside the chart. |
now |
Draw the "we are here" line at this position instead of today: a date or an offset (e.g. 5.5 on an abstract scale). Works on every scale. |
now_label |
Text above that line. Default: Now (with now) or Today. "" for no text. |
label_format |
Period label, see below. |
label_every |
Label only one period out of N (default 1). |
step |
Period size for the abstract scale (default 1). |
Time scales and labels
| Scale | One period is | Default label | Light grid lines |
|---|---|---|---|
day |
a day | Jan 05 |
none |
week |
a week (Monday to Sunday) | W02 |
days |
month |
a month | Jan 2026 |
weeks |
trimester |
a quarter | Q1 2026 |
months |
abstract |
step units |
1, 2, 3… |
none |
label_format is a Python format string with these placeholders:
| Placeholder | Value |
|---|---|
{date} |
First day of the period. Takes strftime codes: {date:%b} → Jan, {date:%d/%m} → 05/01. |
{q} |
Quarter number (1 to 4). |
{n} |
Period number, from 1. The only placeholder on the abstract scale. |
Use \n (in a double-quoted string) for two-line labels, e.g.
"{date:%a}\n{date:%d}" or "Q{q}\n{date:%Y}". A period cut to less
than half by the chart start or end is left unlabelled.
Tasks and subtasks
| Key | Description |
|---|---|
name |
Shown on the y axis, and inside the bar unless label is set. Required. |
label |
Text written inside the bar instead of name (next to the diamond for a milestone row). "" leaves the bar empty. |
start |
A date or an offset (see above). Default 0. |
duration |
Length: a number, "3d" or "2w". |
end |
End date or offset, instead of duration. |
color |
Any matplotlib color (tab:red, "#3366cc", lightgrey, …). |
subtasks |
List of subtasks (same keys, one level deep). |
milestone |
true turns the entry into a milestone row (see below). |
milestones |
Milestones drawn on the bar (see below). |
segments |
Several pieces of bar on the same row (see below). |
- A task without
duration/endspans its subtasks (or its segments). - Tasks take the next color of the matplotlib color cycle. Subtasks use a lighter version of their parent's color, and write their text in the parent's color.
- Subtasks can be milestones too (
milestone: true), and get the parent's color.
Milestones
There are two kinds of milestone.
On a task's bar, with milestones (tasks and subtasks):
milestones:
  - Done                    # at the end of the bar
  - {name: Review, at: 40%} # 40% of the bar length
  - {name: Demo, at: 4}     # 4 units after the task start
  - {name: Freeze, at: 2026-02-01, color: tab:red}   # a date
at defaults to 100%. Percentages use the drawn bar, so they also
work on a task that spans its subtasks. Milestones are black unless
color is given. The label goes to the right of the diamond, or to its
left in the last 20% of the chart.
On their own row, with milestone: true: the entry takes only a
start (no duration, end, subtasks, segments or milestones)
and is drawn as a diamond.
- {name: Grand opening, start: 89, milestone: true, color: tab:red}
Segments
A task interrupted in the middle, or split into phases, can have several pieces of bar on its row:
- name: Field trials
  label: "Team B"           # written in each segment
  start: 2
  segments:
    - {start: 0, duration: 3}               # offsets from the task start
    - {start: 5, end: 8, label: "Retest"}   # own label
  milestones: [Report]      # end of the last segment
| Key | Description |
|---|---|
start |
A date, or an offset from the task start. Default 0. |
duration / end |
Length, or end date/offset (one of them is required). |
color |
Default: color of the task. |
label |
Text in the segment. Default: the task label (or its name). "" leaves it empty. |
The task spans from its start to the end of its last segment: this is
what its parent and its percentage milestones use. Touching segments are
separated by a thin white line. A task with segments takes no
duration/end and no subtasks.
Abstract scale
Use scale: abstract when the chart has no calendar dates, e.g. a
project plan in quarters or a course in weeks. All positions and
lengths are plain numbers.
gantt:
  start: 0
  duration: 16
  scale: abstract
  step: 1               # one column per unit
  label_format: "Q{n}"  # Q1, Q2, …
  title: Work plan
  now: 5.5              # "we are here": middle of Q6
Examples
Each example in examples/
is commented and shows a different part of the format.
| File | Shows |
|---|---|
minimal.yml |
The smallest useful file |
project.yml |
Week scale, ISO week date, subtasks, milestone rows, offsets in days, short bar labels |
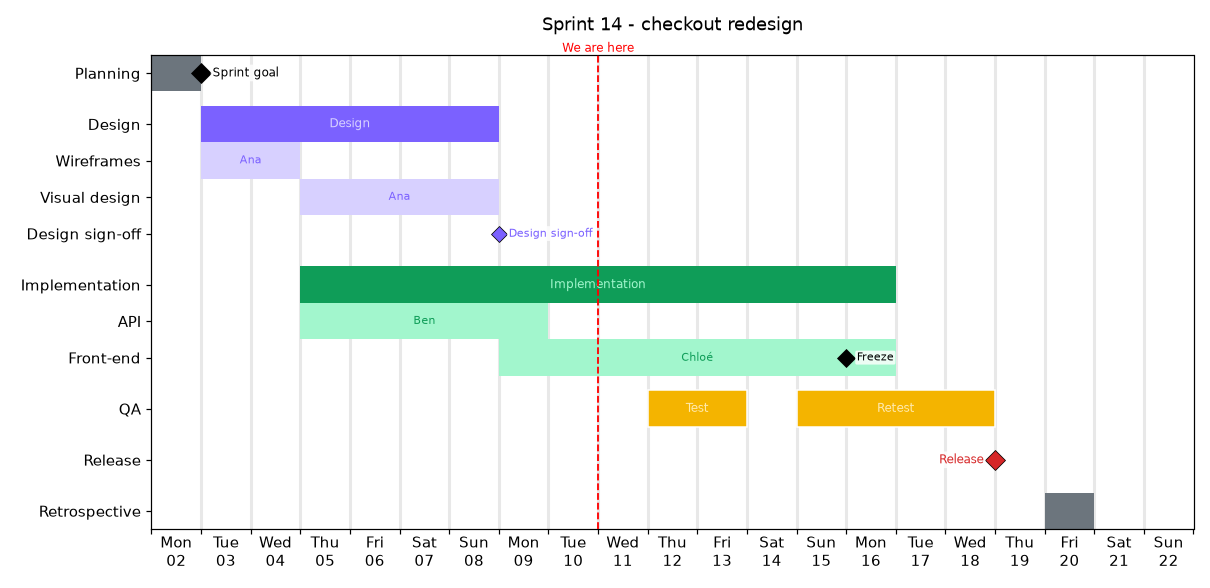
sprint.yml |
Day scale, two-line labels, end dates, people in the bars, now at a date, an interrupted task |
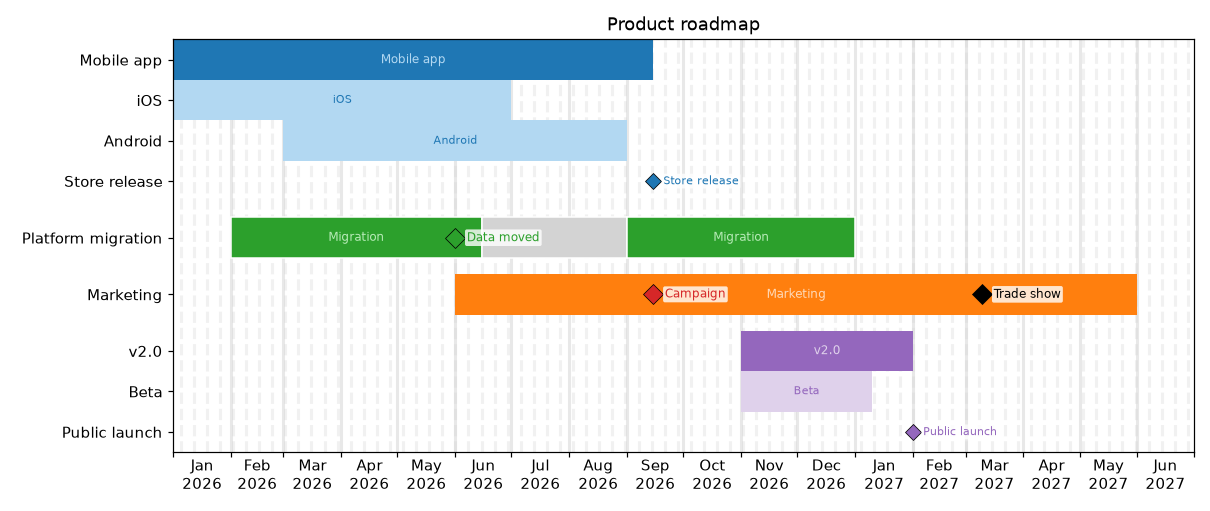
roadmap.yml |
Month scale, dates only, colored milestones on bars, a paused task, no "today" line |
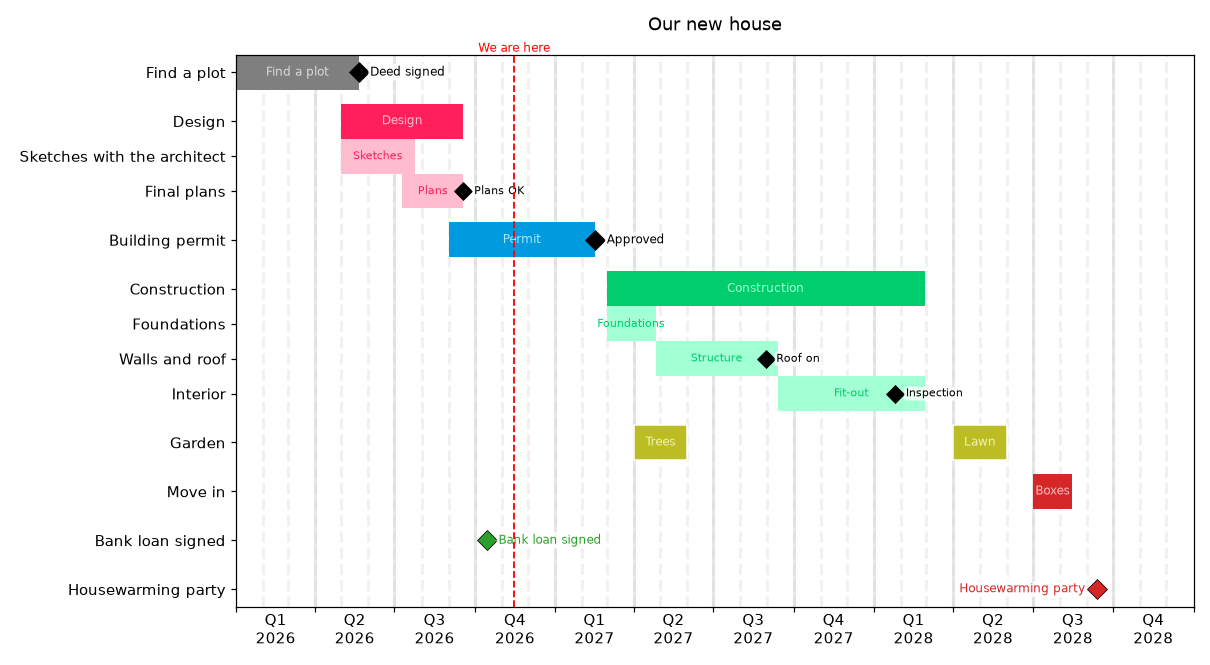
house.yml |
Trimester scale with {q}, percentage milestones, a seasonal task as segments |
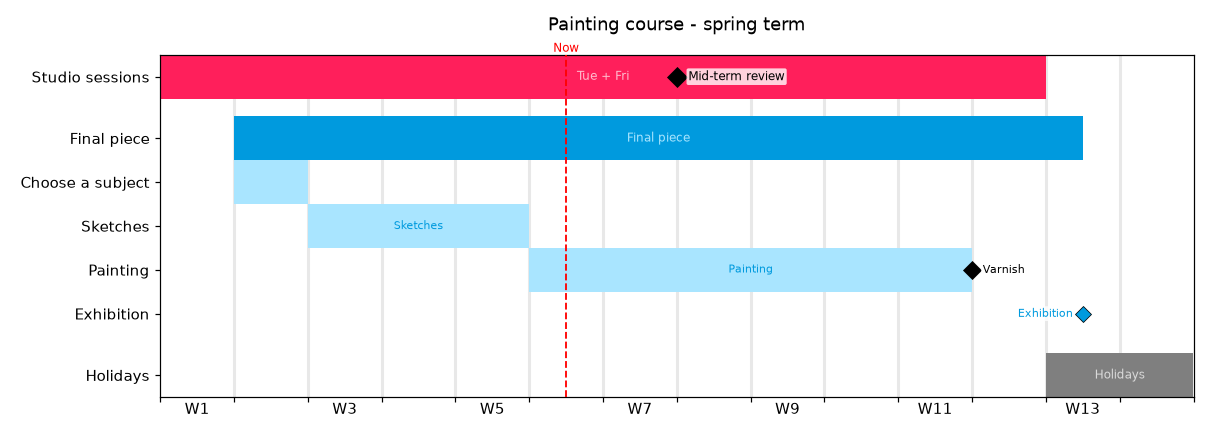
course.yml |
Abstract scale in weeks, label_every, fractional positions |
workpackages.yml |
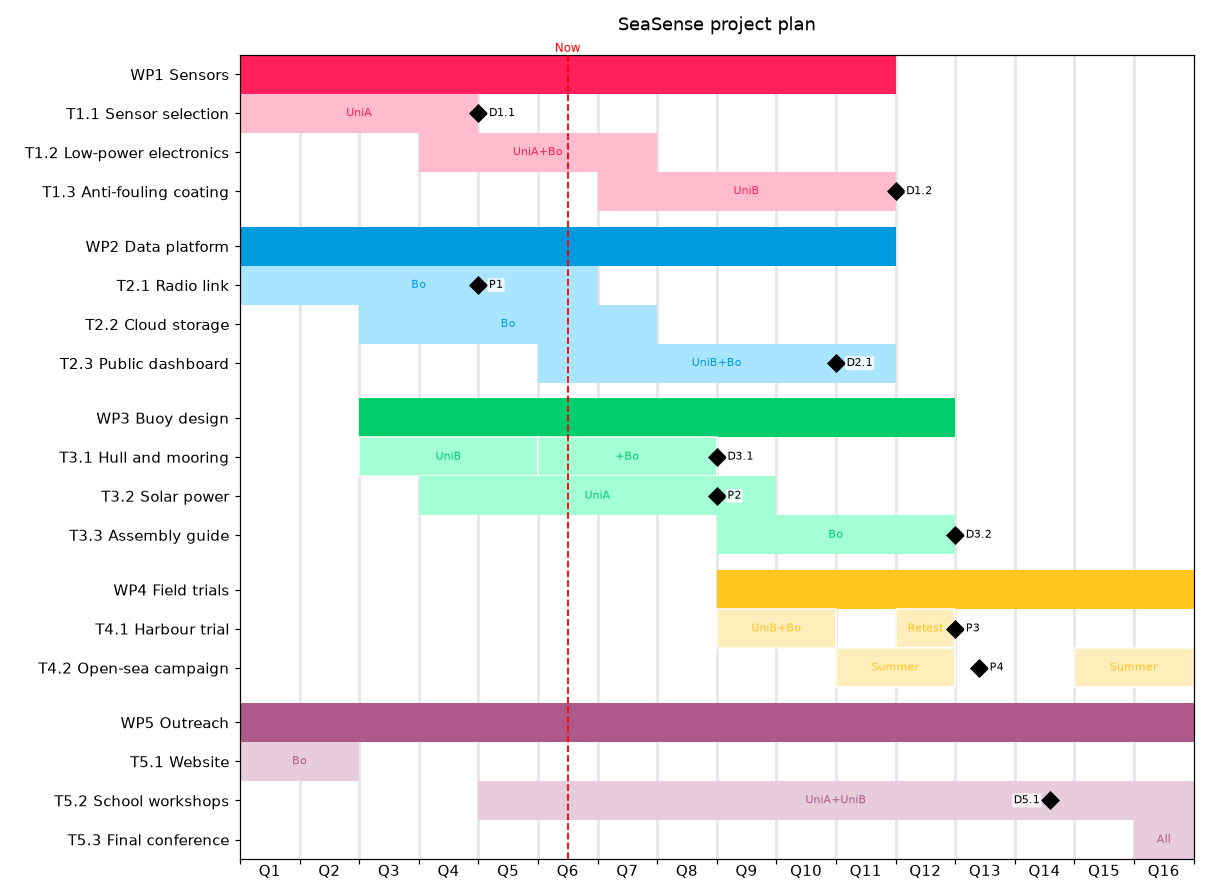
Abstract scale in quarters, a research project in work packages, partners in the bars, many milestones and segments |
from_python.py |
Building a chart from Python |
sprint.yml: day scale
house.yml: trimester scale
course.yml: abstract scale
workpackages.yml: abstract scale, work packages
Python API
Building a chart
from yml2gantt import Gantt

g = Gantt(start="2026-01-01", end="2027-01-01", scale="trimester",
          title="Board game launch")

g.add_task("Market research", start=0, duration="6w", label="Alice")

design = g.add_task("Game design", start="2026-02-15")
design.add_subtask("Rules", duration="3w")
proto = design.add_subtask("Prototype", start="3w", duration=60)
proto.add_milestone("Demo", at="50%")

tests = g.add_task("Playtests", start="2026-06-01")
tests.add_segment(duration="3w")
tests.add_segment(start="8w", duration="2w", label="Retest")

g.add_task("Shipping", start="2026-12-15", milestone=True)

fig, ax = g.draw()
fig.savefig("plan.pdf")
| Call | Description |
|---|---|
Gantt(start=0, end=None, duration=None, scale="week", title=None, show_today=True, label_format=None, label_every=1, step=1, now=None, now_label=None) |
Same keys as the gantt section. |
g.add_task(name, start=0, duration=None, end=None, color=None, milestone=False, label=None) |
Adds a top-level task and returns it. |
task.add_subtask(...) |
Same arguments as add_task; start is relative to the parent. |
task.add_milestone(name, at="100%", color=None) |
Adds a milestone on the bar. |
task.add_segment(start=0, duration=None, end=None, color=None, label=None) |
Adds a piece of bar on the task's row. |
g.draw(ax=None, figsize=None, lighten=0.3) |
Draws and returns (fig, ax). lighten sets how light the subtask colors are (0 = white, 1 = parent color). |
Wrong input raises ValueError (or TypeError for a value of the
wrong type) with a message naming the task.
Loading YAML from Python
from yml2gantt import Gantt, load_yaml, from_dict

g = load_yaml("examples/project.yml")       # or Gantt.from_yaml(...)
g = from_dict({"gantt": {"start": 0, "duration": 10, "scale": "abstract"},
               "tasks": [{"name": "A", "duration": 4}]})   # or Gantt.from_dict(...)

# Edit it before drawing
g.add_task("Extra task", start=5, duration=2)
Customizing the figure
draw returns plain matplotlib objects, so anything matplotlib can do
works afterwards:
import matplotlib.pyplot as plt
from yml2gantt import load_yaml

plt.style.use("seaborn-v0_8-whitegrid")     # styles and the color cycle apply

fig, ax = load_yaml("examples/roadmap.yml").draw(figsize=(14, 6))
ax.set_xlabel("2026 - 2027")
ax.tick_params(axis="y", labelsize=11)
fig.savefig("roadmap.svg", bbox_inches="tight")
To place a gantt inside a larger figure, pass your own axes:
fig, (ax1, ax2) = plt.subplots(2, 1, figsize=(11, 10))
load_yaml("examples/sprint.yml").draw(ax=ax1)
load_yaml("examples/roadmap.yml").draw(ax=ax2)
Limitations
- Subtasks go one level deep (a subtask cannot have subtasks).
- Text in a bar is not shortened: on a short bar, use a short
labelorlabel: "". - Milestone labels can cover the text of their bar: move the milestone
(
at) or shorten the barlabel. - Dated scales work with whole days (no hours).
Development
git clone https://github.com/ldevillez/yml2gantt
cd yml2gantt
poetry install          # or: pip install -e .
poetry run yml2gantt examples/minimal.yml
Project layout:
yml2gantt/
  cli.py          command line (yml2gantt, python -m yml2gantt)
  model.py        Gantt, Task, segment and milestone objects
  scale.py        time scales: dates → x positions, grid and labels
  io.py           loading from a dict or a .yml file
  plot.py         drawing with matplotlib
  colors.py       color helpers
examples/         example charts
docs/images/      pictures used in this README
Releasing a new version
Releases are made by GitHub Actions
(release.yml)
when a version tag is pushed. It builds the package, publishes it on
PyPI and creates the GitHub release, with the changelog entry as notes.
poetry version minor        # or patch / major: updates pyproject.toml
# move the "Unreleased" notes of CHANGELOG.md under the new version
git commit -am "Release v$(poetry version -s)"
git tag "v$(poetry version -s)"
git push origin main --tags
The release stops if the tag does not match the version in
pyproject.toml.
License
1 maintainer

Metadata
1 maintainer
Release files for yml2gantt 0.1.0
For a detailed explanation of source distributions (sdists) and built distributions (wheels), please see the package formats documentation.
Source distribution (sdist)
| File | Size | Uploaded | Provenance | Actions |
|---|---|---|---|---|
| yml2gantt-0.1.0.tar.gz | 21.7 kB | With provenance | Details for yml2gantt-0.1.0.tar.gz |
Built distribution (wheel)
| File | Interpreter | ABI | Platform | Actions Reset |
|---|---|---|---|---|
| yml2gantt-0.1.0-py3-none-any.whl | Python 3 | none | any | Details for yml2gantt-0.1.0-py3-none-any.whl |
Total release size: 41.3 kB
Release files / yml2gantt-0.1.0.tar.gz
| Download URL | yml2gantt-0.1.0.tar.gz |
|---|---|
| Size | 21.7 kB |
| Tags | Source |
|
SHA-256 checksum How to use checksums |
44db5ef51ae69da6df93ff86eca69c6e432f22fa0831345241956e28f031fc03
|
|
BLAKE2b-256 checksum How to use checksums |
1899a96c107deaae01052fdae2cac414a6e603be29dc59d54dc097e91959f2e2
|
| Upload date | |
|
Uploaded using Trusted Publishing? What is trusted publishing? |
Yes |
| Uploaded via |
twine/7.0.0 CPython/3.13.16
|
Provenance
Provenance describes where a file came from. On PyPI, provenance is shared via attestations, which provide a verifiable record of the build or publishing details. View details, limitations and caveats.


PyPI Publish Attestation
PyPI verified that this artifact, at this checksum, originated from the publisher listed below.
Signed by GitHub Actions, verified by PyPI on Oct 26, 2026.
Transparency logRelease files / yml2gantt-0.1.0-py3-none-any.whl
| Download URL | yml2gantt-0.1.0-py3-none-any.whl |
|---|---|
| Size | 19.6 kB |
| Tags | Python 3 |
|
SHA-256 checksum How to use checksums |
738b4edc9d648a66bb81938b7f2d326d737fbce2dc49e08fbf329c5191135fd9
|
|
BLAKE2b-256 checksum How to use checksums |
eb4a3c3915e6b03c47c2340a6fee49f5ffd98a5636ff2cc09ccd0c30fd9405ba
|
| Upload date | |
|
Uploaded using Trusted Publishing? What is trusted publishing? |
Yes |
| Uploaded via |
twine/7.0.0 CPython/3.13.16
|
Provenance
Provenance describes where a file came from. On PyPI, provenance is shared via attestations, which provide a verifiable record of the build or publishing details. View details, limitations and caveats.
PyPI Publish Attestation
PyPI verified that this artifact, at this checksum, originated from the publisher listed below.
Signed by GitHub Actions, verified by PyPI on Oct 26, 2026.
Transparency logSecurity for yml2gantt 0.1.0
Provenance
Provenance describes where a file came from. On PyPI, provenance is shared via attestations, which provide a verifiable record of the build or publishing details. View details, limitations and caveats.
Full provenance
All 2 files in this release have been uploaded with provenance metadata.
Attestation for yml2gantt-0.1.0.tar.gz
PyPI Publish Attestation
PyPI verified that this artifact, at this checksum, originated from the publisher listed below.
Signed by GitHub Actions, verified by PyPI on Oct 26, 2026.
Transparency logA note on package security
PyPI is a repository for distributing packages, not a service for auditing them. While third-party security researchers and our staff do their best to detect and remove malicious packages, PyPI cannot guarantee the quality, security or suitability of any given package.
To learn more about protecting yourself from malicious actors, visit our package security documentation.














