
ZPool Status Monitor - A 'pretty' replacement for the 'zpool status' command
Verified details
These details have been verified by PyPIProject links
GitHub Statistics
Maintainers

Project description
ZPool Monitor
This package provides a replacement for the standard zpool status command to monitor the status of ZPools on your system. Output is colour formatted for
easier detection of errors and problems to address, progress of running tasks is displayed using a progress bar.
Installation
To install globally, run:
pip install zpool-monitor
At this point the executable programs zpool_status and zpool_monitor can be executed as a regular command.
Alternative - Install within a Virtual Environment
To create and install within a Virtual Environment
python -m venv zpool_mon
. zpool_mon/bin/activate
pip install zpool-monitor
deactivate
The application binaries are installed in the zpool_mon/bin directory and can be executed as:
zpool_mon/bin/zpool_status
zpool_mon/bin/zpool_monitor
If you choose, you can soft-link this binary to anywhere else on the system and execture without entering the virtual environment.
ZPool Status
The first application installed as part of this package is zpool_status.
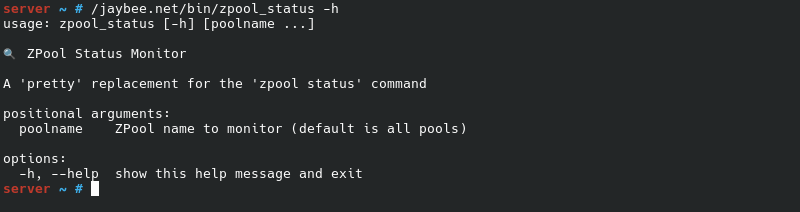
Usage instructions can be seen in the screenshot below.
| Command-line Parameter | Description |
|---|---|
poolname |
Same functionality as listing a pool when executing zpool status [pool]. If not specified, will default to scanning all pools on system. You can optionally provide as many pool names as you wish. NOTE: provided names are checked to see if they are valid poolnames on your system. |
Execution
Screenshot of execution on a healthy pool.
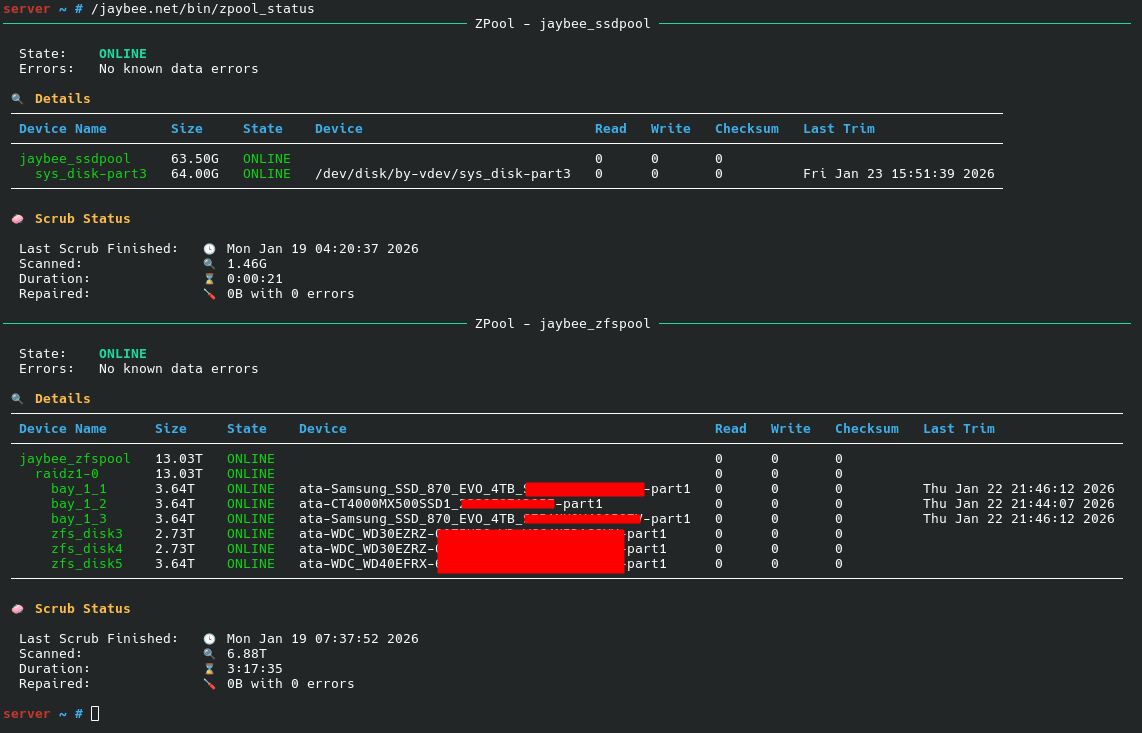
The zpool_status command offers the following features:
- Each pool is separated by a horizontal rule
- Healthy pools/VDEVs are coloured green, any issues will be displayed in a different colour
- The last scrub/resilver is displayed in a nice table. If a scrub/resilver is in progress, it will be displayed as a progress bar with estimated completion time
- If a VDEV has been trimmed it will show the last time it was trimmed. If a trim is in progress, it will be displayed as a progress bar
Other screenshots are provided below.
Screenshot of Scrub in Progress
Image to come
When a scrub is in progress, the information presented in the Scrub Status block under the VDEVs information will indicate...
When a resilver is in progress, the Scrub Status block will be replaced with a Resilver Status block with a similar layout and information.
Screenshot of Trim in Progress
Image to come
The information presented in the Last Trim field for each VDEV will vary depending on certain factors.
| VDEV Trimmable | Status | Display in Last Trim column |
|---|---|---|
| ❌ | --- | This entry in the table will be blank. |
| ✅ | VDEV has never been trimmed. | The ❌ icon will be displayed. |
| ✅ | VDEV currently being trimmed. | A progress bar will be displayed showing the progress of the trim. |
| ✅ | VDEV has been trimmed but not trimming now. | The date and time of the last completed trim will be displayed. |
When a trim is in progress, the information presented in the Last Trim field for each trimmable VDEV will indicate...
For trimmable VDEVs that have never been trimmed, Trim Status will display t
For non-trimmableblock under the VDEVs information will indicate...
When a resilver is in progress, the Scrub Status block will be replaced with a Resilver Status block with a similar layout and information.
ZPool Monitor
The second application installed as part of this package is zpool_monitor.
zpool_monitor is a Textual based application that will display a regularly updated dashboard containing the current
ZPool status.
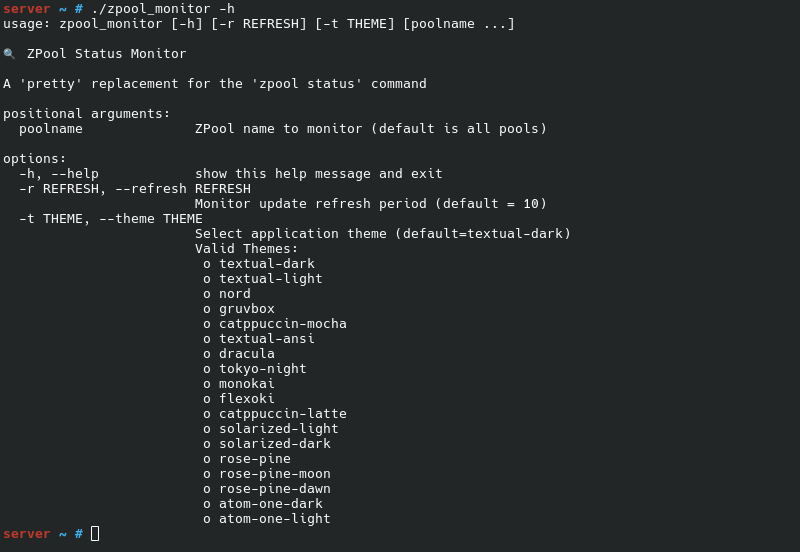
Usage instructions can be seen in the screenshot below.
| Command-line Parameter | Description |
|---|---|
-r REFRESH |
Specify the initial refresh period used to update ZPool status. Default is 10 seconds. Period can be updated within the dashboard application. |
-t THEME |
Specify the initial Textual theme to use in the dashboard. Theme can be switched within the dashboard application. NOTE: requested theme is checked to see if it is a valid Textual theme. |
poolname |
Same functionality as listing a pool when executing zpool status [pool]. If not specified, will default to monitoring all pools on system. You can optionally provide as many pool names as you wish. NOTE: provided names are checked to see if they are valid poolnames on your system. |
Execution
TBA...
Navigating the Dashboard
Like all Textual based apps, the Dashboard can be bound to numerous keys, and can be controlled by the mouse if used on a terminal via a GUI.
Display
This application is designed as a single-screen Dashboard. This means that all pools will be displayed in panels on the one screen. If the screen is not large enough to display all pools, each panel will be made smaller with a scrollbar inside of it to enable access of all pool data. As the pool state is always displayed as the first line of each Panel, you will always be able to see the state of all pools.
If the dashboard is executed to monitor all pools ([poolname ...] is not provided), the dashboard is dynamic in that newly added pools will automatically be
added to the dashboard in a new Panel. Similarly, destroyed pools will have their Panels automatically removed.
The contents of the panels are exactly the same data and format as the output of the zpool_status command. As such, ongoing scrubs, resilvers, and
trims will be shown as a progress bar. If a scrub/resilver is ongoing, the ETA is also displayed.
Changing the Refresh Period
The initial refresh period can be specified when launching the Dashboard (default=10 seconds). The Dashboard contains three bindings to manage the refresh period:
| Key Binding | Action | Outcome |
|---|---|---|
r |
Refresh now | Will cause the Dashboard to perform an immediate refresh of ZPool status and update the display. |
+ |
Increase refresh period | Will increase the current refresh period by one second. The current period is always displayed in the title bar. NOTE: Maximum refresh period is capped at 60 seconds. |
- |
Decrease refresh period | Will decrease the current refresh period by one second. The current period is always displayed in the title bar. NOTE: Minimum refresh period is capped at 1 seconds. |
Key bindings for the above actions are always displayed in the Dashboard Footer. You can initiate one of these actions by either pressing the corresponding key, or by clicking on Footer area with the mouse.
Changing the Theme
The initial theme can be specified when launching the Dashboard (default is the default Textual Theme). The Dashboard contains two bindings to manage the current theme.
| Key Binding | Action | Outcome |
|---|---|---|
d |
Toggle dark mode (d) |
Will toggle the current theme between dark and light mode. |
t |
Select new Theme (t) |
Will open a selection text box listing all current themes. You may type in your new theme, use the cursor keys and enter to select a new Theme, or use the mouse to select a new Theme |
Key bindings for the above actions are always displayed in the Dashboard Footer. You can initiate one of these actions by either pressing the corresponding key, or by clicking on Footer area with the mouse.
Taking a Screenshot
Other actions available in the Dashboard are via the command palette. This can be accessed by either:
- Typing
Ctrl-p - Clicking on the icon in the upper left corner of the Dashboard
This will open a menu where you can choose one of four options.
| Menu Item | Action |
|---|---|
| Keys | Slides in a Panel to the right displaying help on all available key-bindings. The ZPool panels will shrink horizontally to acommodate the help Panel. To hide the Panel, repeat the process (eg. type Ctrl-p, then select Keys). |
| Quit | Quit the Dashboard immediately. |
| Screenshot | Save the current Dashboard display as an SVG file. |
| Theme | Open the same selection text box to change Theme as noted in the previous sub-section. |
If you select to take a Screenshot, the SVG file will be saved in ~/Downloads
Project details
Verified details
These details have been verified by PyPIProject links
GitHub Statistics
Maintainers


Download files
Download the file for your platform. If you're not sure which to choose, learn more about installing packages.
Source Distribution
Built Distribution
Filter files by name, interpreter, ABI, and platform.
If you're not sure about the file name format, learn more about wheel file names.
Copy a direct link to the current filters
File details
Details for the file zpool_monitor-0.0.6.tar.gz.
File metadata
- Download URL: zpool_monitor-0.0.6.tar.gz
- Upload date:
- Size: 20.3 kB
- Tags: Source
- Uploaded using Trusted Publishing? Yes
- Uploaded via: twine/6.1.0 CPython/3.13.7
File hashes
| Algorithm | Hash digest | |
|---|---|---|
| SHA256 |
3571d9b6e6743a449c9a7f94080e3ee23926008f9cd2de40bc555ebbcdd41fbb
|
|
| MD5 |
818b0208f23b0ea60d2c2f209e411e4b
|
|
| BLAKE2b-256 |
6eaab3ebfa42540e41183421ed6c526bcfeece94da32b5ecf831b82091cae9f1
|
Provenance
The following attestation bundles were made for zpool_monitor-0.0.6.tar.gz:
Publisher:
python-publish.yml on jason-but/zpool-monitor
-
Statement:
-
Statement type:
https://in-toto.io/Statement/v1 -
Predicate type:
https://docs.pypi.org/attestations/publish/v1 -
Subject name:
zpool_monitor-0.0.6.tar.gz -
Subject digest:
3571d9b6e6743a449c9a7f94080e3ee23926008f9cd2de40bc555ebbcdd41fbb - Sigstore transparency entry: 851648592
- Sigstore integration time:
-
Permalink:
jason-but/zpool-monitor@e3677001f6ff49f8b4155bb707ca62fc47ee45f4 -
Branch / Tag:
refs/tags/0.0.6 - Owner: https://github.com/jason-but
-
Access:
public
-
Token Issuer:
https://token.actions.githubusercontent.com -
Runner Environment:
github-hosted -
Publication workflow:
python-publish.yml@e3677001f6ff49f8b4155bb707ca62fc47ee45f4 -
Trigger Event:
release
-
Statement type:
File details
Details for the file zpool_monitor-0.0.6-py3-none-any.whl.
File metadata
- Download URL: zpool_monitor-0.0.6-py3-none-any.whl
- Upload date:
- Size: 22.9 kB
- Tags: Python 3
- Uploaded using Trusted Publishing? Yes
- Uploaded via: twine/6.1.0 CPython/3.13.7
File hashes
| Algorithm | Hash digest | |
|---|---|---|
| SHA256 |
778f6a759ca7061e2b3a907e7ea539652458a5830eefb657164a4576aa559b95
|
|
| MD5 |
4430809a43ecd419ab42e3a8243034ec
|
|
| BLAKE2b-256 |
e432d6666745e65cd45387c9c578f787602af06c26c79712ac86df256530086a
|
Provenance
The following attestation bundles were made for zpool_monitor-0.0.6-py3-none-any.whl:
Publisher:
python-publish.yml on jason-but/zpool-monitor
-
Statement:
-
Statement type:
https://in-toto.io/Statement/v1 -
Predicate type:
https://docs.pypi.org/attestations/publish/v1 -
Subject name:
zpool_monitor-0.0.6-py3-none-any.whl -
Subject digest:
778f6a759ca7061e2b3a907e7ea539652458a5830eefb657164a4576aa559b95 - Sigstore transparency entry: 851648647
- Sigstore integration time:
-
Permalink:
jason-but/zpool-monitor@e3677001f6ff49f8b4155bb707ca62fc47ee45f4 -
Branch / Tag:
refs/tags/0.0.6 - Owner: https://github.com/jason-but
-
Access:
public
-
Token Issuer:
https://token.actions.githubusercontent.com -
Runner Environment:
github-hosted -
Publication workflow:
python-publish.yml@e3677001f6ff49f8b4155bb707ca62fc47ee45f4 -
Trigger Event:
release
-
Statement type:






