
Z-Split Normalization (Zero-Preserving Split Normalization)
Version: 1.0.1
License: MIT
What is Z-Split?
Z-Split preserves zero as a fixed physical boundary while expanding narrow distributions clustered around zero into the full [−1, 1] range — normalizing and expanding in a single operation. This prevents the low-contrast output common with near-zero indices and creates a well-formed distribution suitable for Otsu thresholding and multi-temporal analysis.
Core Idea and Motivation
Spectral indices and remote sensing operations often produce values clustered tightly around zero due to radiometric constraints, surface reflectance properties, or normalized difference formulations. Standard normalization compresses these values further, producing low-contrast images and unstable thresholds.
Z-Split expands each side of zero independently into [−1, 0] and [0, 1], simultaneously normalizing and stretching narrow distributions. This preserves distributional contrast for reliable thresholding, maintains the zero boundary across scenes for stable multi-temporal comparison, and broadens the practical utility of spectral indices in analytical workflows where near-zero clustering would otherwise limit accuracy.
The Problem
Bipolar remote sensing indices share one property: zero is a physical class boundary (water/non-water, uplift/subsidence). Standard methods destroy it: Min-Max shifts zero into [0, 1]; Z-Score centers on the mean and produces an unbounded range. Both fail when values cluster near zero, making thresholding unreliable, multi-temporal comparisons artifact-driven, and in the worst case producing entirely empty, white, or black images due to values compressed around zero.
The Solution — Z-Split
Z-Split normalizes each side of zero independently, stretching the full negative range to [−1, 0] and the full positive range to [0, 1].
Formula
$$ Z\text{-}Split(x) = \begin{cases} x ;/; \max(X^+) & \text{if } x > 0 \ 0 & \text{if } x = 0 \ x ;/; |\min(X^-)| & \text{if } x < 0 \end{cases} $$
where $X^+$ is the set of positive values and $X^-$ is the set of negative values.
Output range: [−1, 1] with zero strictly preserved.
Why Z-Split?
| Property | Min-Max | Z-Score | Z-Split |
|---|---|---|---|
| Preserves zero as class boundary | ❌ | ❌ | ✅ |
| Expands narrow near-zero distributions | ❌ | ⚠️ | ✅ |
| Stable on skewed distributions | ❌ | ⚠️ | ✅ |
| Suitable for Otsu thresholding | ❌ | ⚠️ | ✅ |
| Multi-temporal direction preserved | ❌ | ❌ | ✅ |
| Output range | [0, 1] | Unbounded | [−1, 1] |
Installation
pip install zsplit
Quick Start
from zsplit import normalize

result = normalize(your_bipolar_index)
Practical Applications in Remote Sensing
Z-Split addresses a critical problem in any workflow involving bipolar indices across time or sensors:
1. Change Detection
Applying Min-Max before change detection introduces artificial trends that appear as land cover change but reflect only normalization artifacts. A report showing "15% vegetation decline" may be entirely attributable to normalization, not reality.
2. Time Series Analysis
Studies tracking floods, drought, or urban expansion over time require a clean temporal signal. Min-Max corrupts this signal by rescaling each scene independently to [0, 1], making year-to-year comparisons unreliable.
3. Multi-temporal Machine Learning
Models trained on Min-Max normalized multi-year data learn spurious patterns introduced by normalization rather than real spectral change. Z-Split ensures the training signal reflects actual surface conditions.
4. InSAR and Displacement Monitoring
In LOS displacement data, zero means no movement. Shifting zero through Min-Max misclassifies stable pixels as deforming, directly corrupting subsidence or uplift maps.
Validation
1. NDWI — Optical Remote Sensing
Tested on Sentinel-2 NDWI data. Z-Split successfully expanded near-zero clustered values while preserving the original image structure, producing contrast-enhanced output suitable for thresholding and multi-temporal comparison.
2. Multi-Temporal Change Analysis — NDVI, Riyadh 2018–2024
Validated on four Sentinel-2 NDVI scenes (March–April, 2018–2020–2022–2024) over Riyadh, Saudi Arabia (scale: 10 m, 5603 × 5129 pixels per scene) across 11,424 spatial patches.
A. Normalization Artifact Analysis
The figure below shows the deviation of each normalization method from the raw temporal signal. Min-Max introduces large artificial trends across the entire scene (colored map). Z-Split introduces virtually no deviation (near-white map).
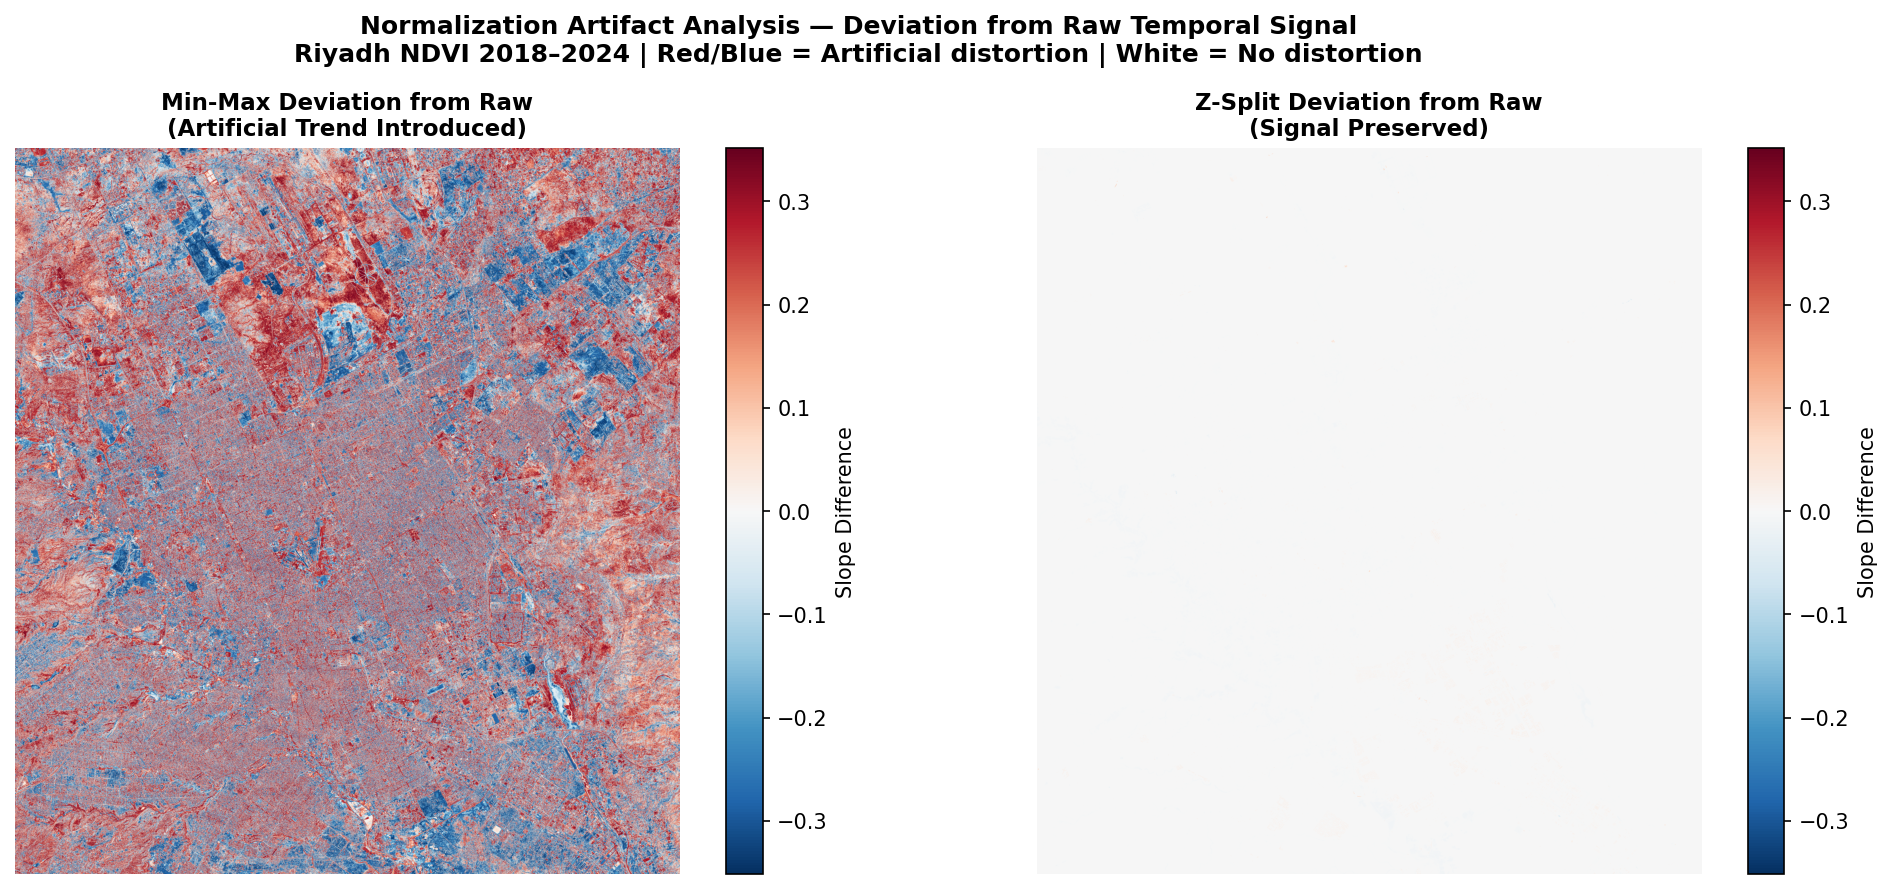
| Method | Mean Absolute Deviation | Std |
|---|---|---|
| Min-Max | 0.1858 | 0.2091 |
| Z-Split | 0.0013 | 0.0017 |
Z-Split preserves the temporal signal with 143× greater fidelity than Min-Max.
B. Linear Trend (Slope per pixel, 2018–2024)
| Method | Mean Slope | Std | Correlation with Raw |
|---|---|---|---|
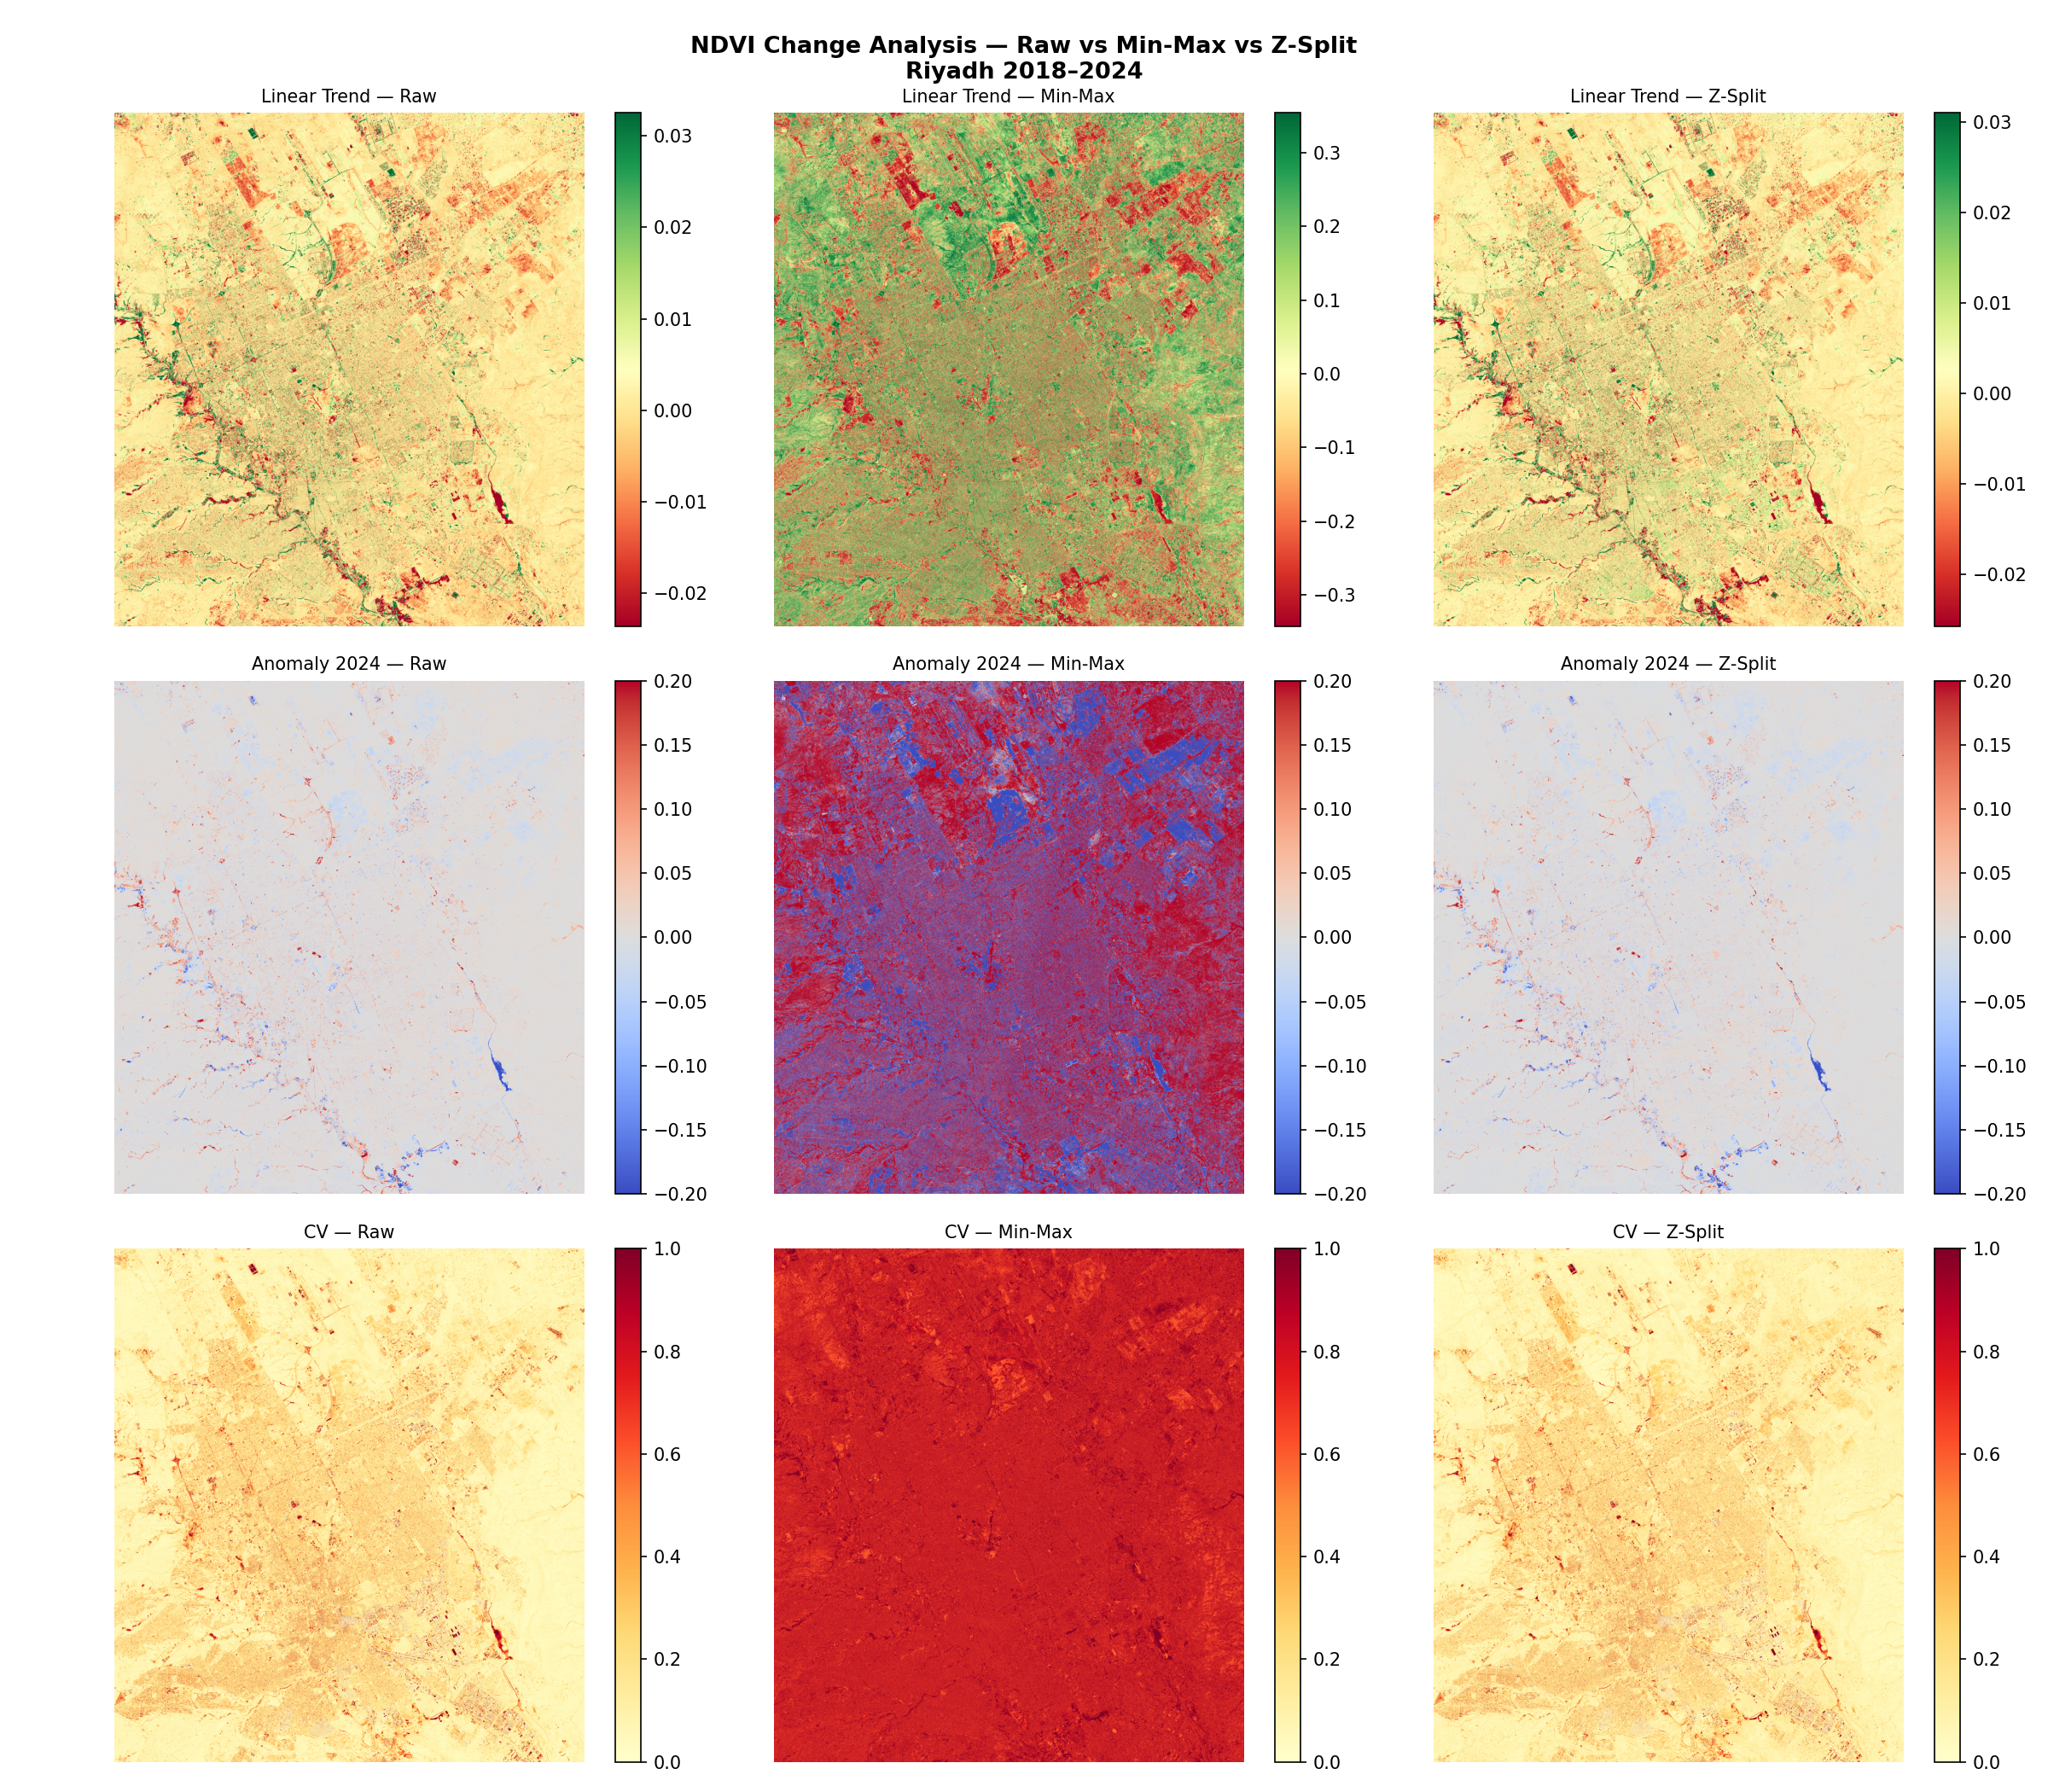
| Raw (no normalization) | 0.000894 | 0.0165 | — |
| Min-Max | 0.027454 | 0.2170 | r = 0.511 |
| Z-Split | −0.000120 | 0.0167 | r = 0.995 |
C. Multi-Temporal Change Maps
The figure below compares Linear Trend, Anomaly, and Coefficient of Variation maps across all three methods. Z-Split maps are visually and statistically consistent with raw data; Min-Max maps show spatially inverted anomaly patterns and 5.5× inflated variability.
| Method | Mean CV |
|---|---|
| Raw | 0.150 |
| Z-Split | 0.173 |
| Min-Max | 0.832 |
D. Threshold Stability (Otsu across 11,424 patches)
| Method | Threshold Std |
|---|---|
| Min-Max | 0.0882 |
| Z-Split | 0.2220 |
| Z-Score | 1.2012 |
Note: For strongly unipolar NDVI in arid urban areas, Min-Max threshold stability is comparable to Z-Split. Z-Split's primary advantage is in bipolar indices with narrow near-zero distributions (NDWI, InSAR LOS), consistent with its design objective.
Application Scope
Most effective when:
- Values cluster near zero (NDWI in arid regions, InSAR LOS over stable terrain)
- Multi-temporal consistency is required (change detection, time series analysis)
- Otsu or zero-based thresholding is applied
- Cross-scene or cross-sensor comparisons are performed
Files
| File | Description |
|---|---|
zsplit_normalization.ipynb |
Jupyter Notebook with visual demonstration |
zsplit_arcpy.py |
ArcGIS Pro implementation |
Z-Split_Normalization/Validation/ |
Multi-temporal NDVI change analysis |
Validation/01_Optical_ENDWI/ |
Optical NDWI validation |
Author
Abdulrhman Almoadi
King Abdulaziz City for Science and Technology (KACST)
Citation
If you use Z-Split, please cite:
Almoadi, A.: Reducing False Alarms in Urban Flood Detection: An Enhanced NDWI (ENDWI) with Hybrid Max Fusion on Sentinel-2 Data, Earth Observation, 1, 43–57, https://doi.org/10.5194/eo-1-43-2026, 2026.
1 maintainer

Download files
Download the file for your platform. If you're not sure which to choose, learn more about installing packages.
Source Distribution
Built Distribution
Filter files by name, interpreter, ABI, and platform.
If you're not sure about the file name format, learn more about wheel file names.
Copy a direct link to the current filters
File details
Details for the file zsplit-1.0.3.tar.gz.
File metadata
- Download URL: zsplit-1.0.3.tar.gz
- Upload date:
- Size: 8.3 kB
- Tags: Source
- Uploaded using Trusted Publishing? No
- Uploaded via:
twine/6.2.0 CPython/3.12.11
File hashes
| Algorithm | Hash digest | |
|---|---|---|
| SHA256 |
99adfe9d4d0b5288aee308577fce4ca0aabe54770bebdb41a532e1c0409c62be
|
|
| MD5 |
060d77a4123dc02d1678ddef70a94370
|
|
| BLAKE2b-256 |
80b50d890fc30f8b246943b6b6f2e7f163fd40209a14014c60593ae9658f31e4
|
File details
Details for the file zsplit-1.0.3-py3-none-any.whl.
File metadata
- Download URL: zsplit-1.0.3-py3-none-any.whl
- Upload date:
- Size: 8.2 kB
- Tags: Python 3
- Uploaded using Trusted Publishing? No
- Uploaded via:
twine/6.2.0 CPython/3.12.11
File hashes
| Algorithm | Hash digest | |
|---|---|---|
| SHA256 |
f5e646d68bebe241b62cc55a9532e05b22c4e36f74b1b02e4fcf465a8e6787b3
|
|
| MD5 |
c06cccbd514530d258861e1f06a79b20
|
|
| BLAKE2b-256 |
098fec5fd5f91d73eab81cde267f4afd2335aa7a931bcc2ed594cb21be3f1061
|







