No project description provided

Project description
AFragmenter
AFragmenter is a schema-free, tunable protein domain segmentation tool for AlphaFold structures based on network analysis.
Key features
-
Schema free: AFragmenter only uses the PAE values from AlphaFold structures. No domain-segmentation scheme is learned or used for evaluation.
-
Tunable segmentation: The 'resolution' parameter gives control over the coarseness of clustering, and thus the number of clusers / domains.
- Higher resolution: Yields more, smaller clusters
- Lower resolution: Yields fewer, larger clusters
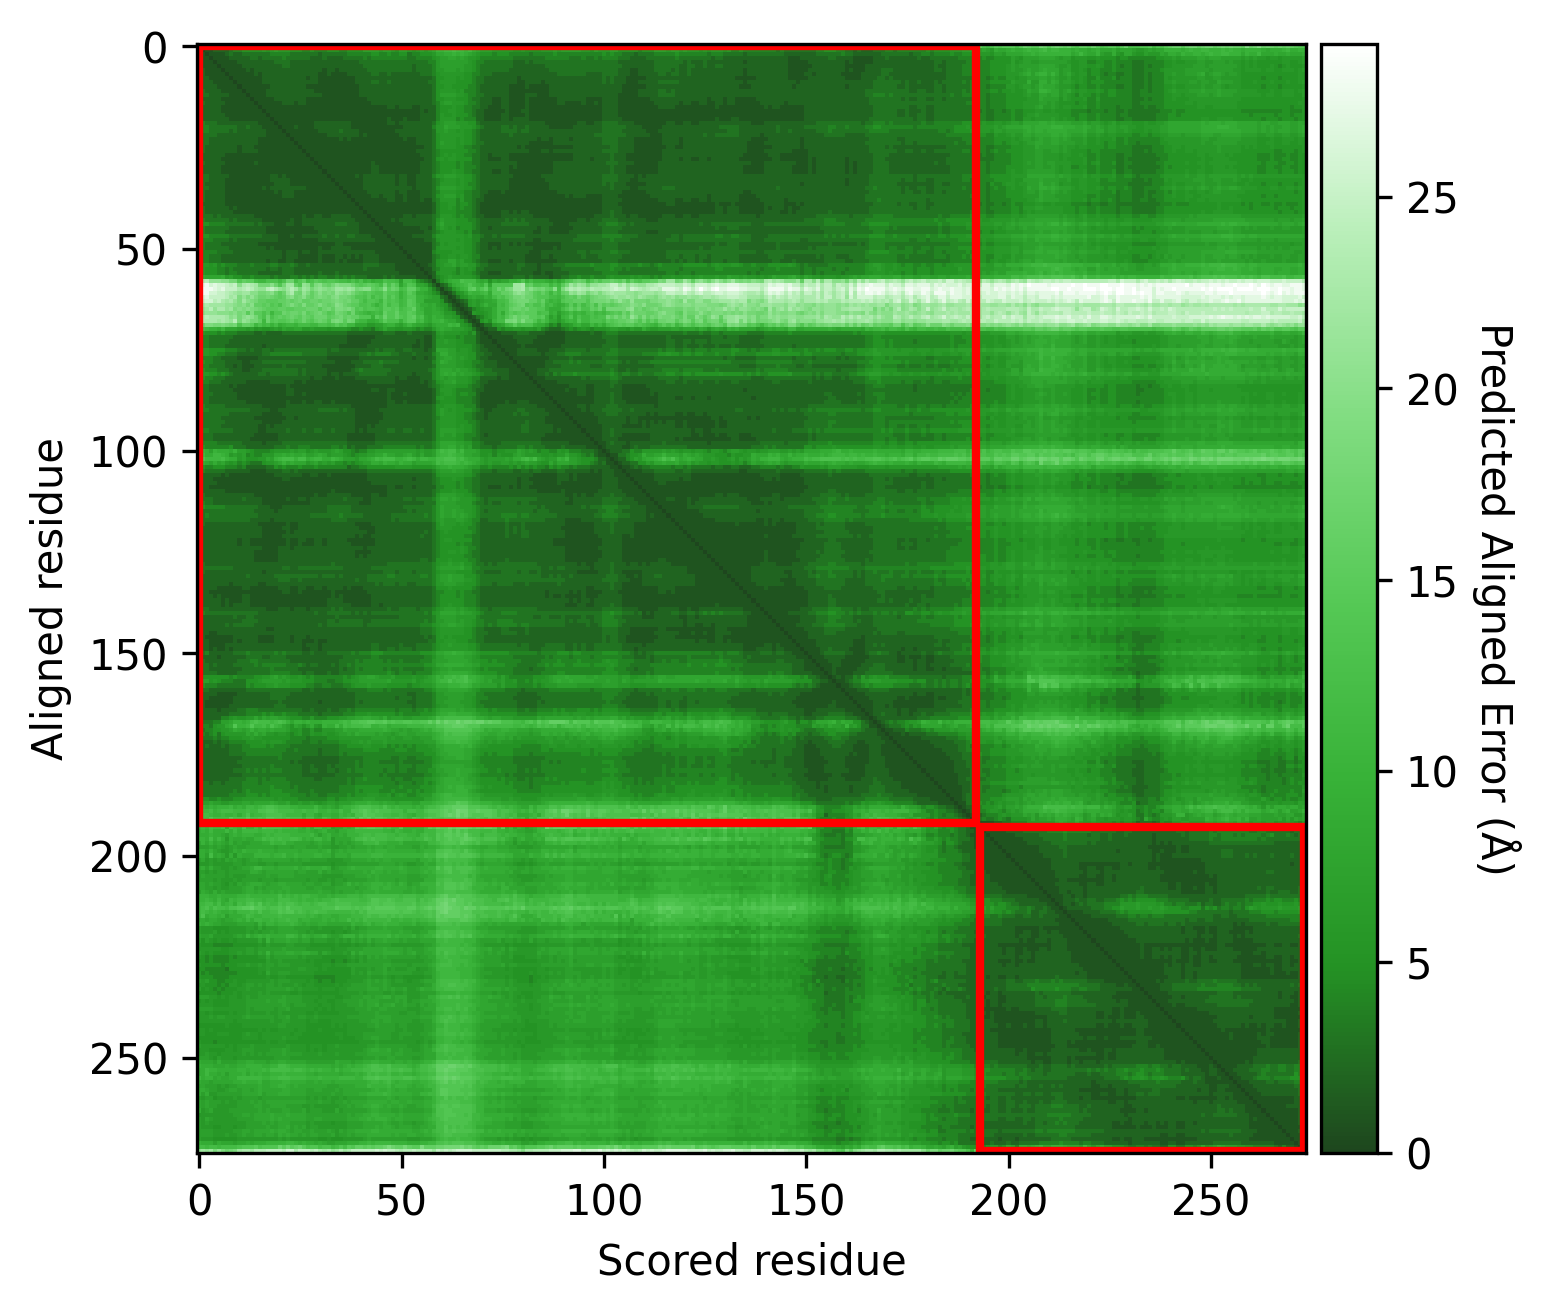
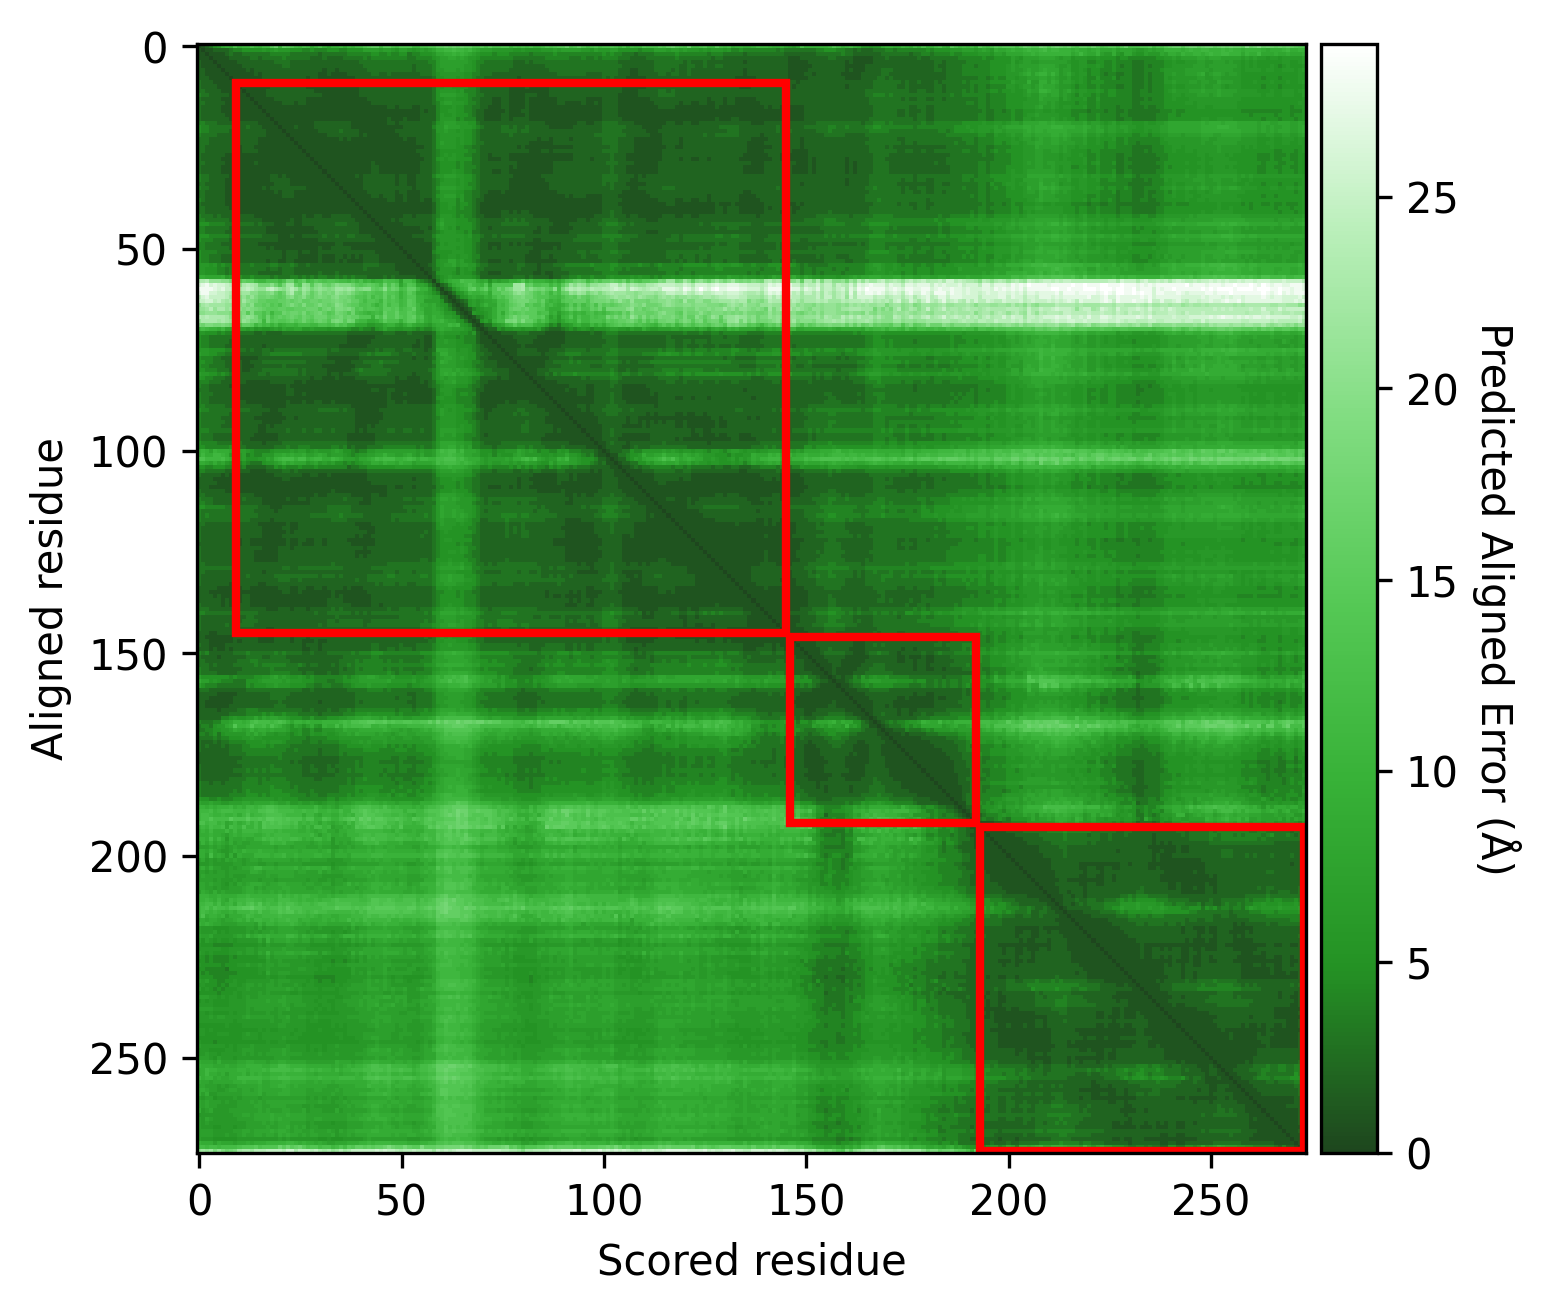
| Resolution = 0.7 | Resolution = 1.0 | Resolution = 0.2 |
|---|---|---|
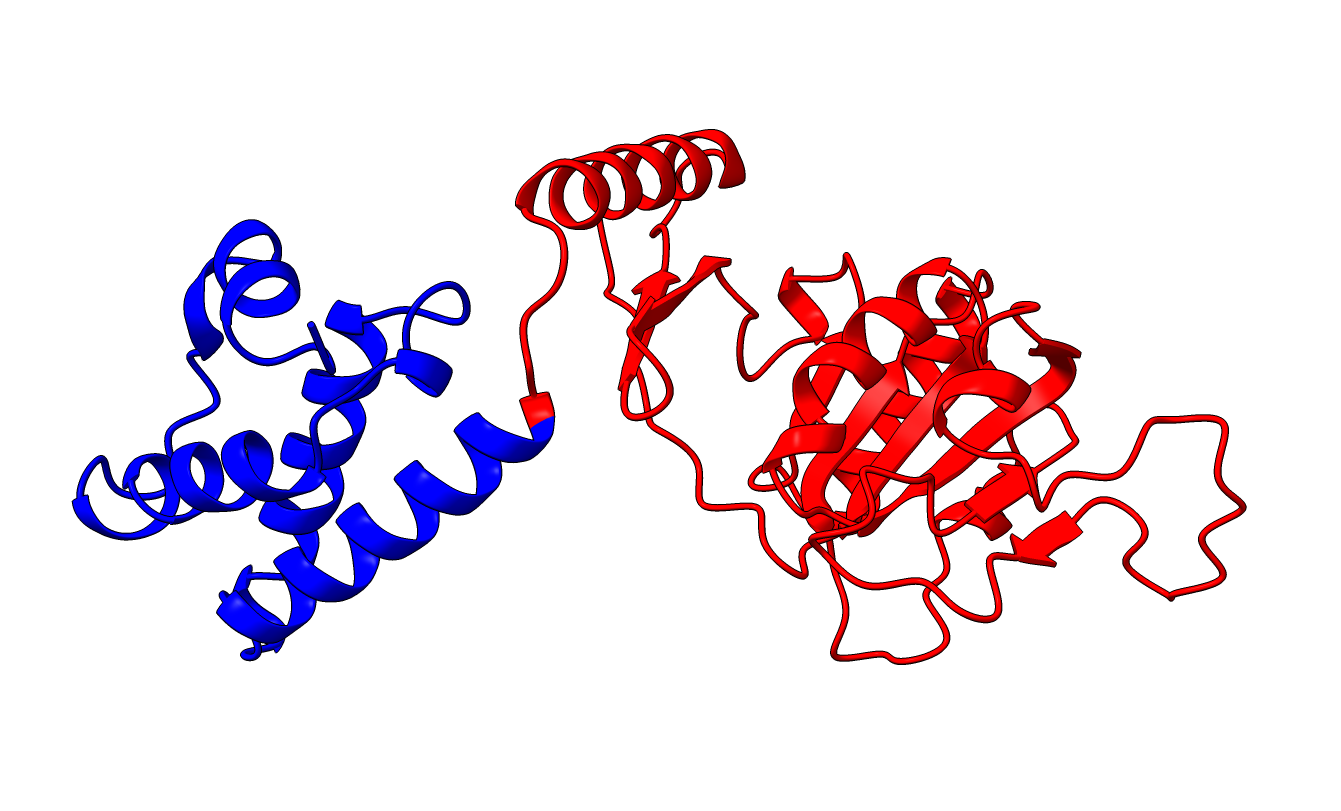 |
 |
 |
protein: P15807
How it works
-
Network representation: Each protein residue is treated as a node within a fully connected network
-
Edge weighting: The edges between the nodes are weighted using transformed Predicted Aligned Error (PAE) values from AlphaFold, reflecting relative positional confidence between residues.
Details on the use of PAE values
- PAE values show differences when looking between inter- versus intra-domain residue pairs.
- Intra-domain residue paris are expected to have lower PAE values compared to inter-domain residue pair.
- This difference is used to distinguish well-structured regions within a protein structure from other well-structured regions and from poorly structured regions.
- This enables us to cluster protein residue pairs of well-structured regions together.
-
Clustering with Leiden algorithm: Utilizes the Leiden clustering algorithm to group residues into domains, with adjustable resolution parameters to control cluster granularity.
Table of contents
Try it
The recommended way to use AFragmenter is through jupyter notebooks, where visualization and fine-tuning of parameters is most easily done. The easiest way to begin is by using our Google colab notebook.
- Note: While colab notebooks offers convenience, it can experience slower performance due to shared resources.
An alternative way to get started is by using the [webtool] (coming soon)
Installation
System Requirements
- Python Version: Python 3.9 or higher
- Operating Systems: Linux, macOS, or Windows.
Installation
AFragmenter is available through PyPI and bioconda.
pip install afragmenter
or
conda install -c conda-forge -c bioconda afragmenter
Optional Dependencies:
-
py3Dmol: Required for protein structure visualization.
pip install py3Dmol
Or
conda install -c conda-forge py3Dmol
Quick Tutorial
In this short tutorial, we will walk through the process of using AFragmenter to segment protein domains based on AlphaFold structures. We will use the example protein P15807 (PDB: 1KYQ) to demonstrate the steps involved. This protein is classified differently by various protein domain databases, making it an interesting case for domain segmentation.
P15807 is classified as a three-domain protein in both CATH and ECOD, a two-domain protein in SCOPe and InterPro, and a single-domain protein in SCOP.
Since AFragmenter is dependent on the PAE values of AlphaFold, it is a good idea to first have a look at the PAE plot.
from afragmenter import AFragmenter, fetch_afdb_data

pae, structure = fetch_afdb_data('P15807')
p15807 = AFragmenter(pae) # Or bring your own files: a = AFragmenter('filename.json')
p15807.plot_pae()
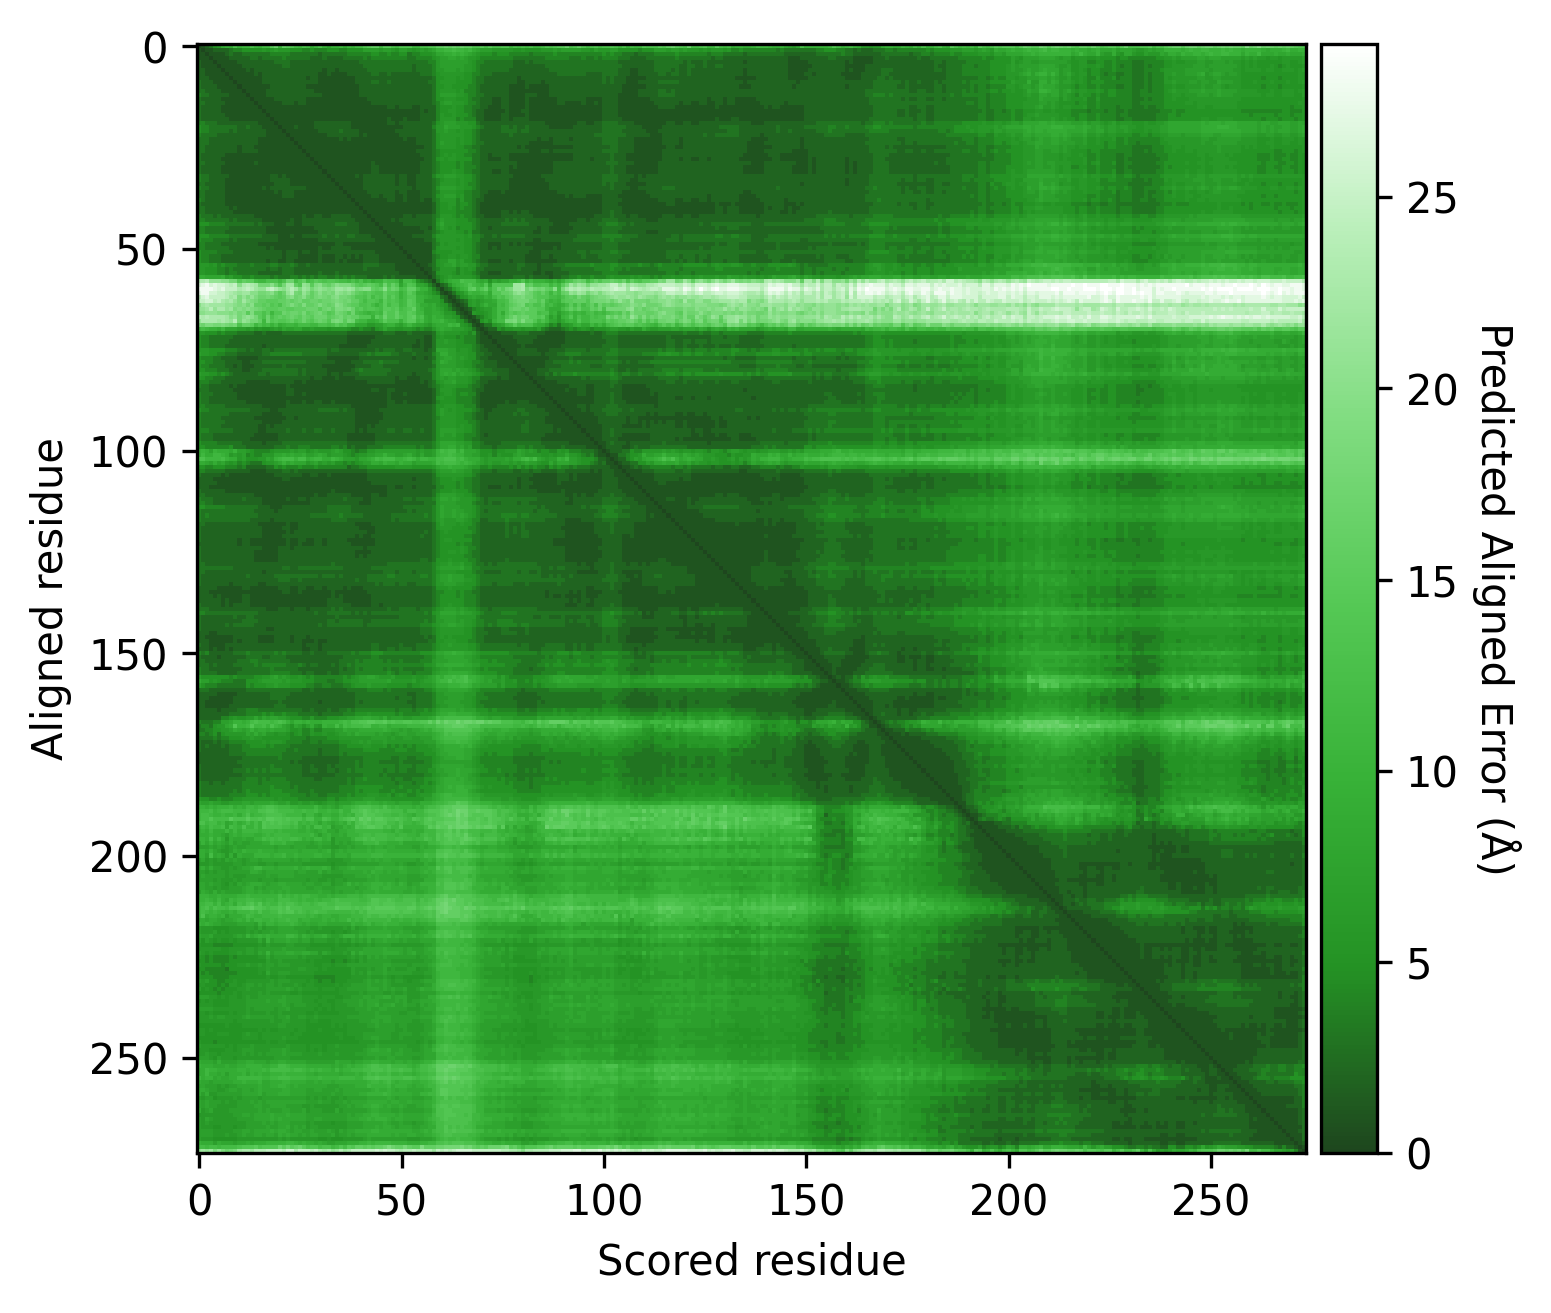
Here we see some regions of very low PAE values (dark green) on the PAE matrix, which could indicate different domains. However, there are still many green (low PAE) datapoints visible around these potential domains.
We will start the clustering process using AFragmenter's default settings, including a PAE contrast threshold of 2. While this default is a good starting point, remember that you may need to adjust this parameter for other proteins to more effectively distinguish between low-PAE regions, which can yield different clustering results when experimenting with various resolution values.
Next, we cluster the residues into domains using the Leiden clustering algorithm. We get a result, but the resolution parameter can be changed to explore multiple potential solutions.
p15807 = AFragmenter(pae, threshold=3)
result = p15807.cluster()
result.plot_result()
result.py3Dmol(structure)
p15807.cluster(resolution=1)
p15807.cluster(resolution=0.2)
Once a solution has been found that is satisfactory to the user, we can print the result and the FASTA file for each domain, or save them to files for further analysis.
p15807 = AFragmenter(pae)
result = p15807.cluster(resolution=1.1)
result.print_result()

    ┏━━━━━━━━┳━━━━━━━━━━━━━━━━━━━━┳━━━━━━━━━━┓
    ┃ Domain ┃ Number of Residues ┃ Chopping ┃
    ┡━━━━━━━━╇━━━━━━━━━━━━━━━━━━━━╇━━━━━━━━━━┩
    │ 1      │                137 │   10-146 │
    │ 2      │                 47 │  147-193 │
    │ 3      │                 81 │  194-274 │
    └────────┴────────────────────┴──────────┘

result.print_fasta(structure)

    >P15807_1 10-146
    QLKDKKILLIGGGEVGLTRLYKLIPTGCKLTLVSPDLHKSIIPKFGKFIQNEDQPDYRED
    AKRFINPNWDPTKNEIYEYIRSDFKDEYLDLEDENDAWYIIMTCIPDHPESARIYHLCKE
    RFGKQQLVNVADKPDLC
    >P15807_2 147-193
    DFYFGANLEIGDRLQILISTNGLSPRFGALVRDEIRNLFTQMGDLAL
    >P15807_3 194-274
    EDAVVKLGELRRGIRLLAPDDKDVKYRMDWARRCTDLFGIQHCHNIDVKRLLDLFKVMFQ
    EQNCSLQFPPRERLLSEYCSS


# Or save it
result.save_result('result.csv')
result.save_fasta(structure, 'result.fasta')
More examples
Q14914
Q14914 is a great example of an AlphaFold prediction with very high confidence, as indicated by a high pLDDT score and uniformly low PAE values. This could present a challenge for AFragmenter, since it's clustering method relies on a contrast between the intra-domain and inter-domain PAE values. When all PAE values are uniformly low, this contrast is minimal, which could cause the algorithm only ever produce a single large cluster (i.e. whole protein is one domain).
In these cases, it is a good idea to lower the PAE theshold value (default = 2) if changing the resolution parameter does not produce any different results.
However, as we can see below, this protein's PAE values still have enough subtle contrast for the default parameters to work, resulting in a good prediction without any adjustments.
from afragmenter import AFragmenter, fetch_afdb_data
import matplotlib.pyplot as plt

pae, structure = fetch_afdb_data("Q14914")
q14914 = AFragmenter(pae)
result = q14914.cluster() # default resolution = 0.7
result.plot_result()
plt.show()

view = result.py3Dmol(structure)
view.zoomTo()
view.show()
result2 = q14914.cluster(resolution = 0.5)
result2.plot_result()
plt.show()

view2 = result2.py3Dmol(structure)
view2.zoomTo()
view2.show()
Q9VK07
The predicted model structure for Uvrag (Q9VK07) obtained from the AlphaFold database (v4) has an average pLDDT score of 65.99, which is below the often advised minimun of 70.
from afragmenter import AFragmenter, fetch_afdb_data
import matplotlib.pyplot as plt

pae, structure = fetch_afdb_data("Q9VK07")
x = AFragmenter(pae)
x.plot_pae()
plt.show()
The PAE plot for this protein shows lots of very high PAE values. While we can still see some regions that could be protein domains, even these are not great. This is a difficult case for AFragmenter, as its method normally relies on discriminating between very low PAE values within a domain and somewhat higher PAE values between domains. However, here, most of the PAE values are high, even for residues within the supposed domains. To account for this low confidence, we need to increase the PAE threshold value, which makes the clustering algorithm more forgiving and allows it to group residues even if their PAE values are relatively high.
afrag = AFragmenter(pae, threshold = 10)
result = afrag.cluster(min_size=25)
result.plot_result()
plt.show()
So, when we run AFragmenter with a higher threshold, we get a result that groups some parts of the structure together as we'd expect. However, we also notice that a long, disordered region at the C-terminus of the protein gets assigned as a 'domain.' This happens because the Leiden clustering algorithm is designed to assign every residue to a cluster, so it even groups what the network considers 'noise' together. Fortunately, we can easily fix this. We can simply use the min_avg_pae filter to remove this unwanted cluster and be a bit more selective with our results.
result2 = afrag.cluster(min_size=25, min_avg_pae=15)
result2.plot_result()
plt.show()
Usage
Python
Docs coming soon...
Command line

Options
- Recommended
- Threshold
- Resolution
- More options
Recommended settings
Recommended starting parameter settings, based on benchmarking, are a resolution = 0.7 and a threshold = 2. For initial exporlation, resolution values in the range of 0.4-0.8 and threshold range 0-4 are suggested. Values outside these ranges may also be informative.
Higher values for either parameter tend to yield a larger number of smaller protein segments, while lower values result in fewer, broader segments.
Threshold
The 'contrast threshold' serves as a soft cut-off to increase the distinction between low and high PAE values. Used in calculating the edge weights of the network and will thus have a large impact on the clustering and segmentation results. It is important to consider this threshold in the context of the AlphaFold results for the protein of interest.
Examples:
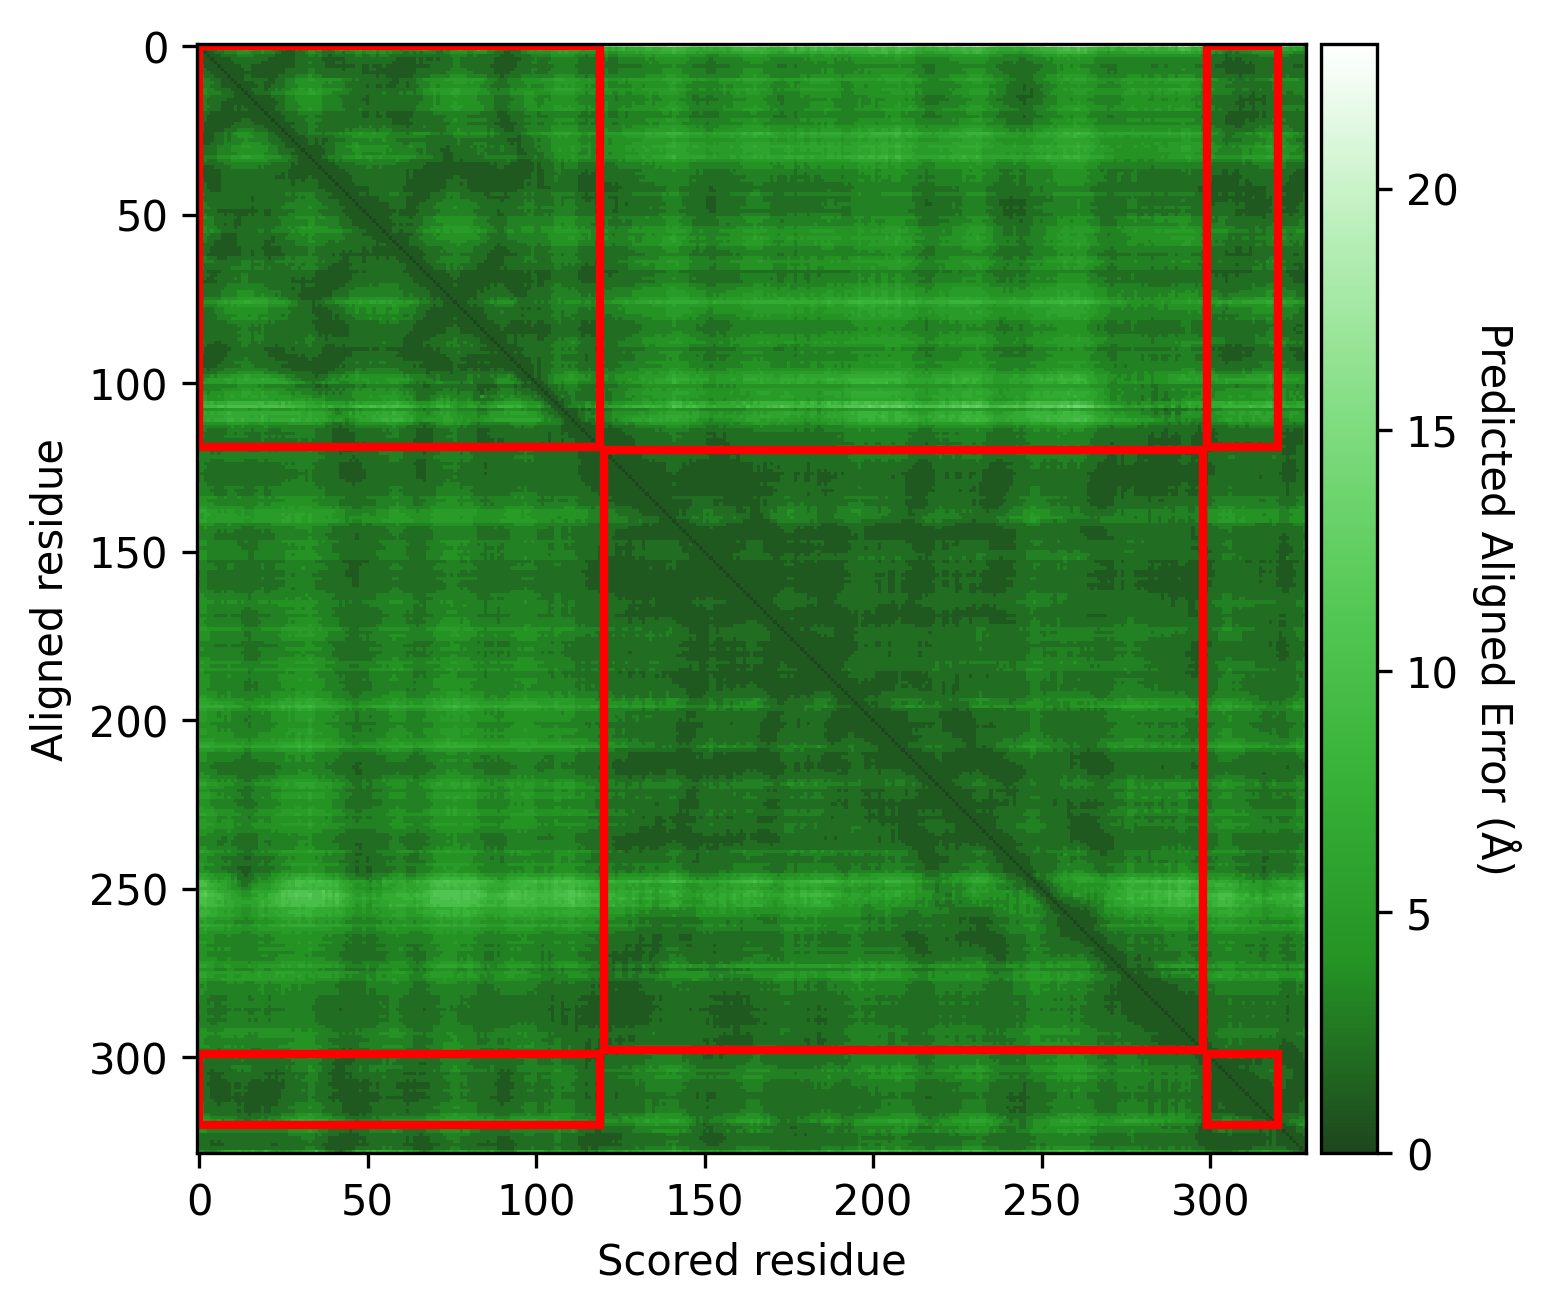
Q5VSL9
Overall good structure with high pLDDt and low PAE scores for the majority of the protein, and lower pLDDT and high PAE scores for the disordered regions / loops, like is expected. Default threshold should be good (default PAE threshold = 5).
| AlphaFold structure | PAE plot | Edge weights |
|---|---|---|
 |
 |
 |
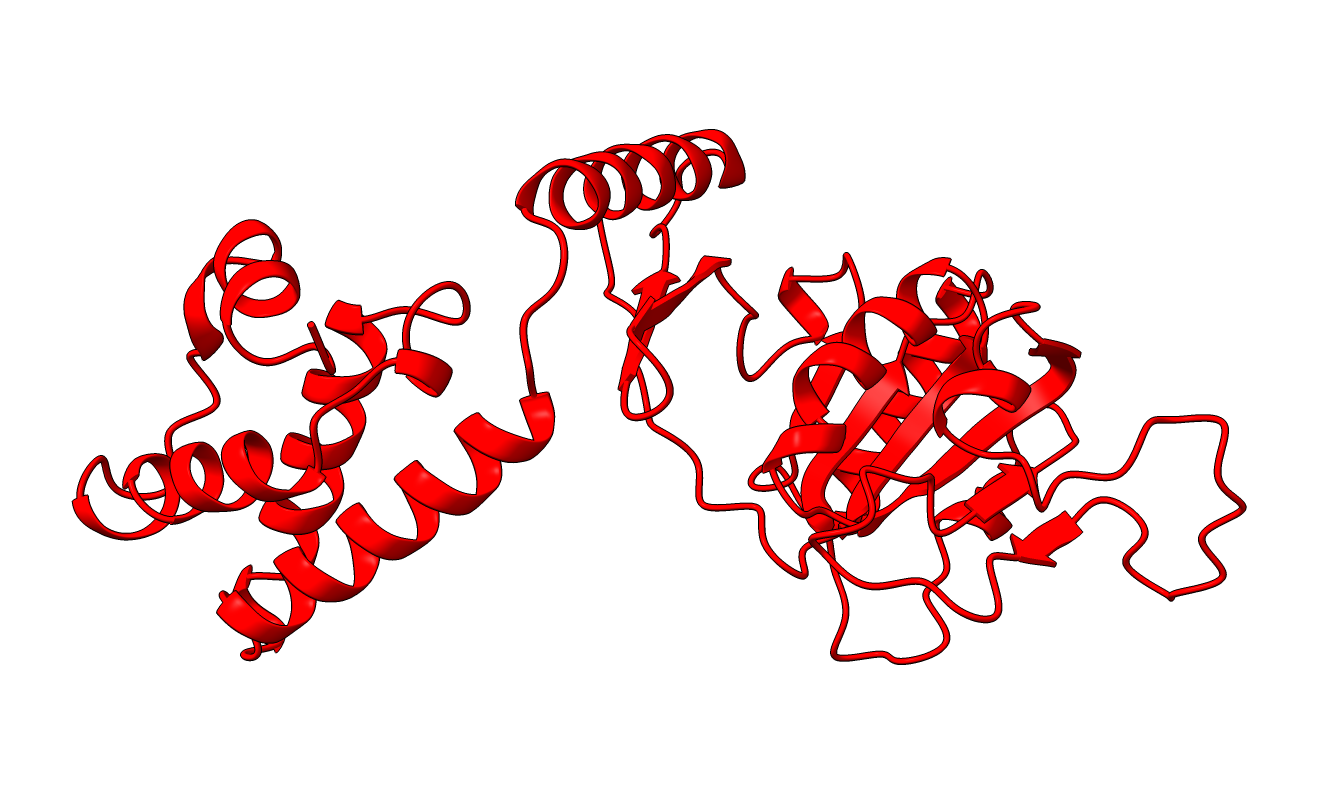
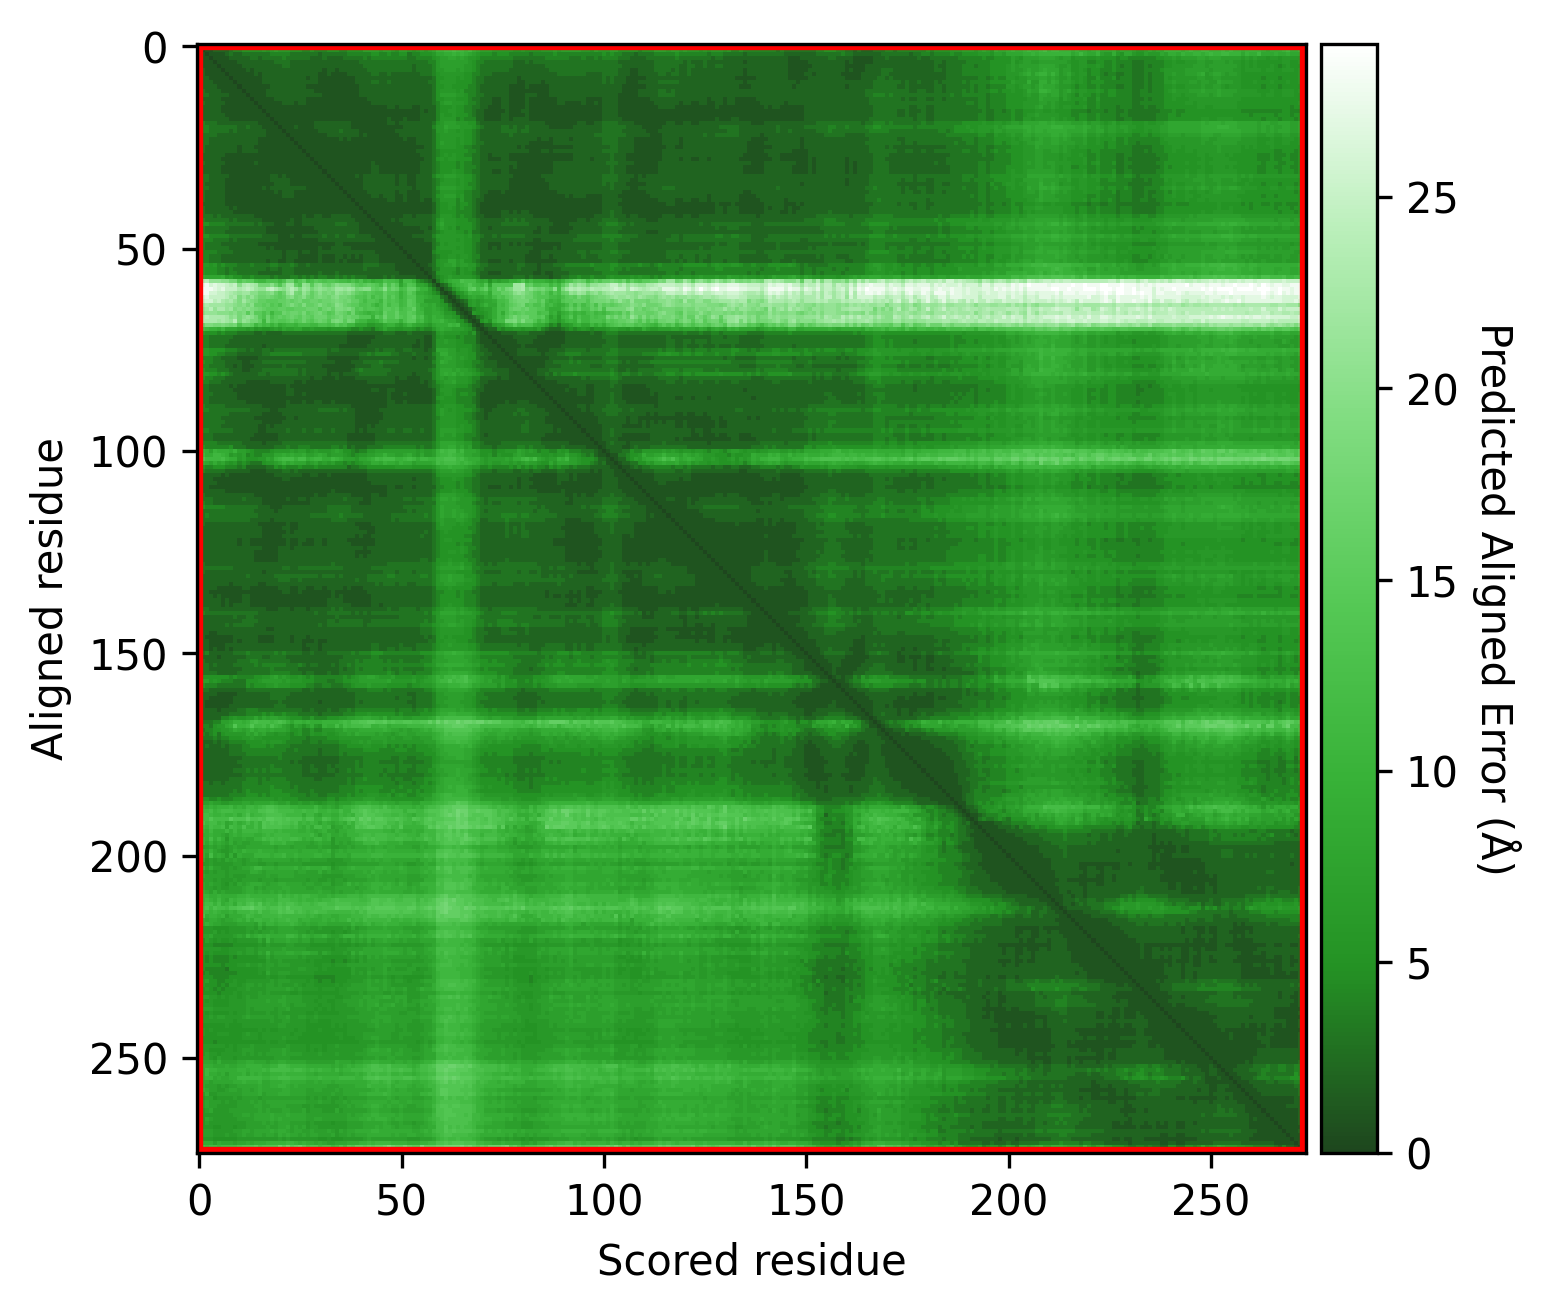
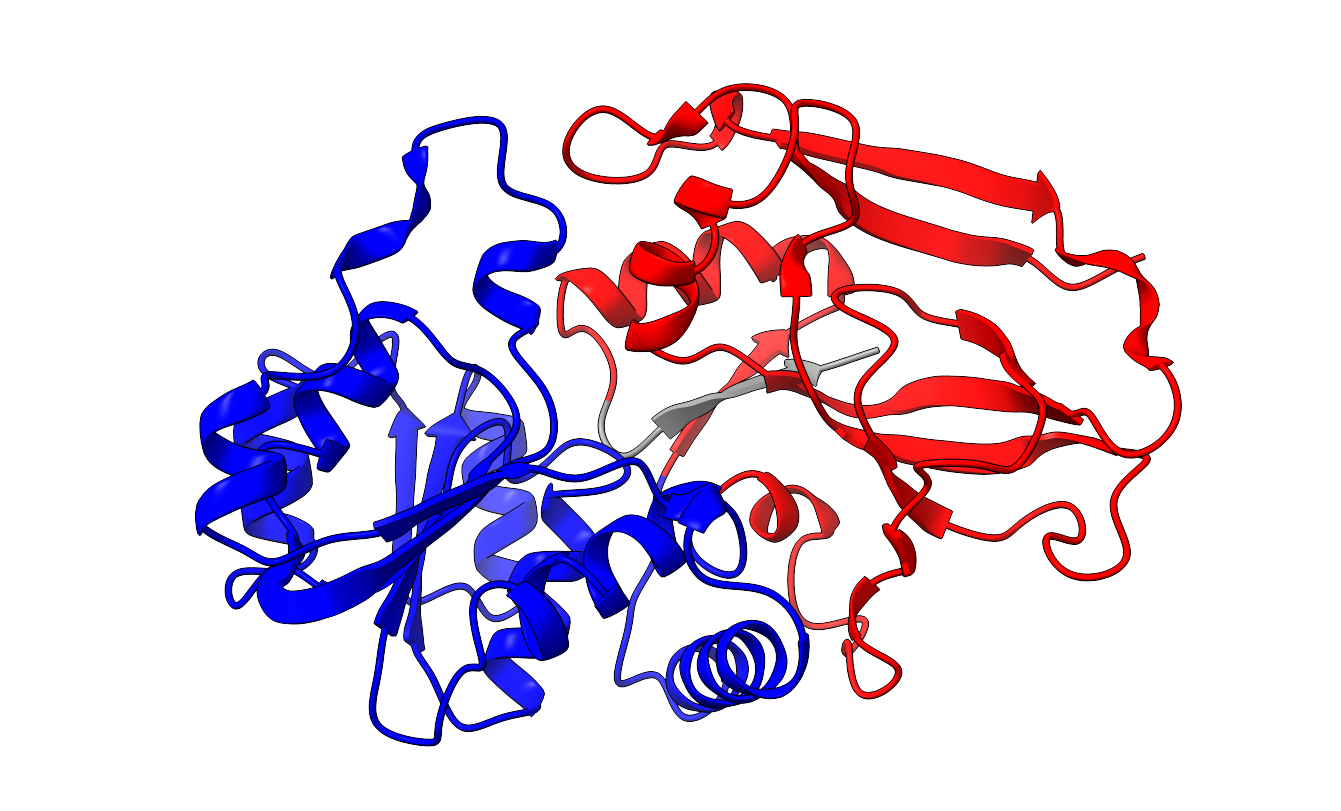
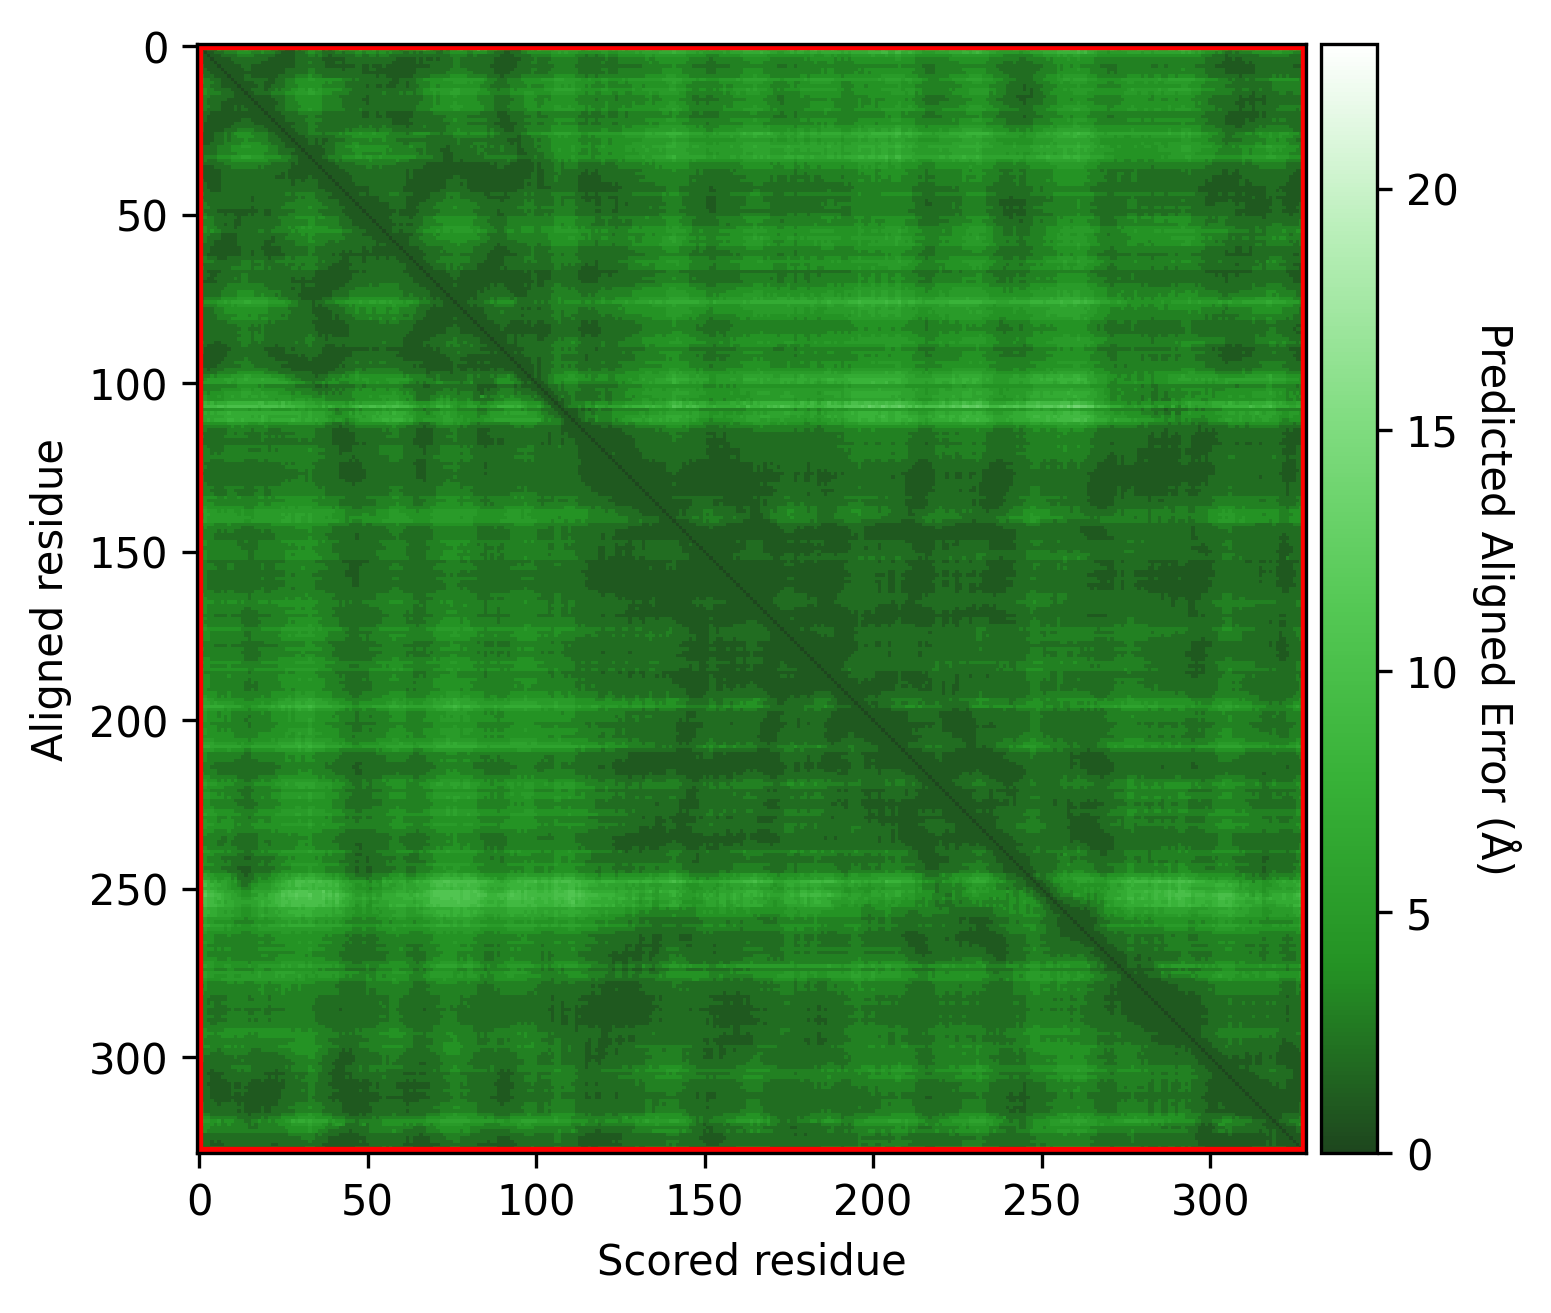
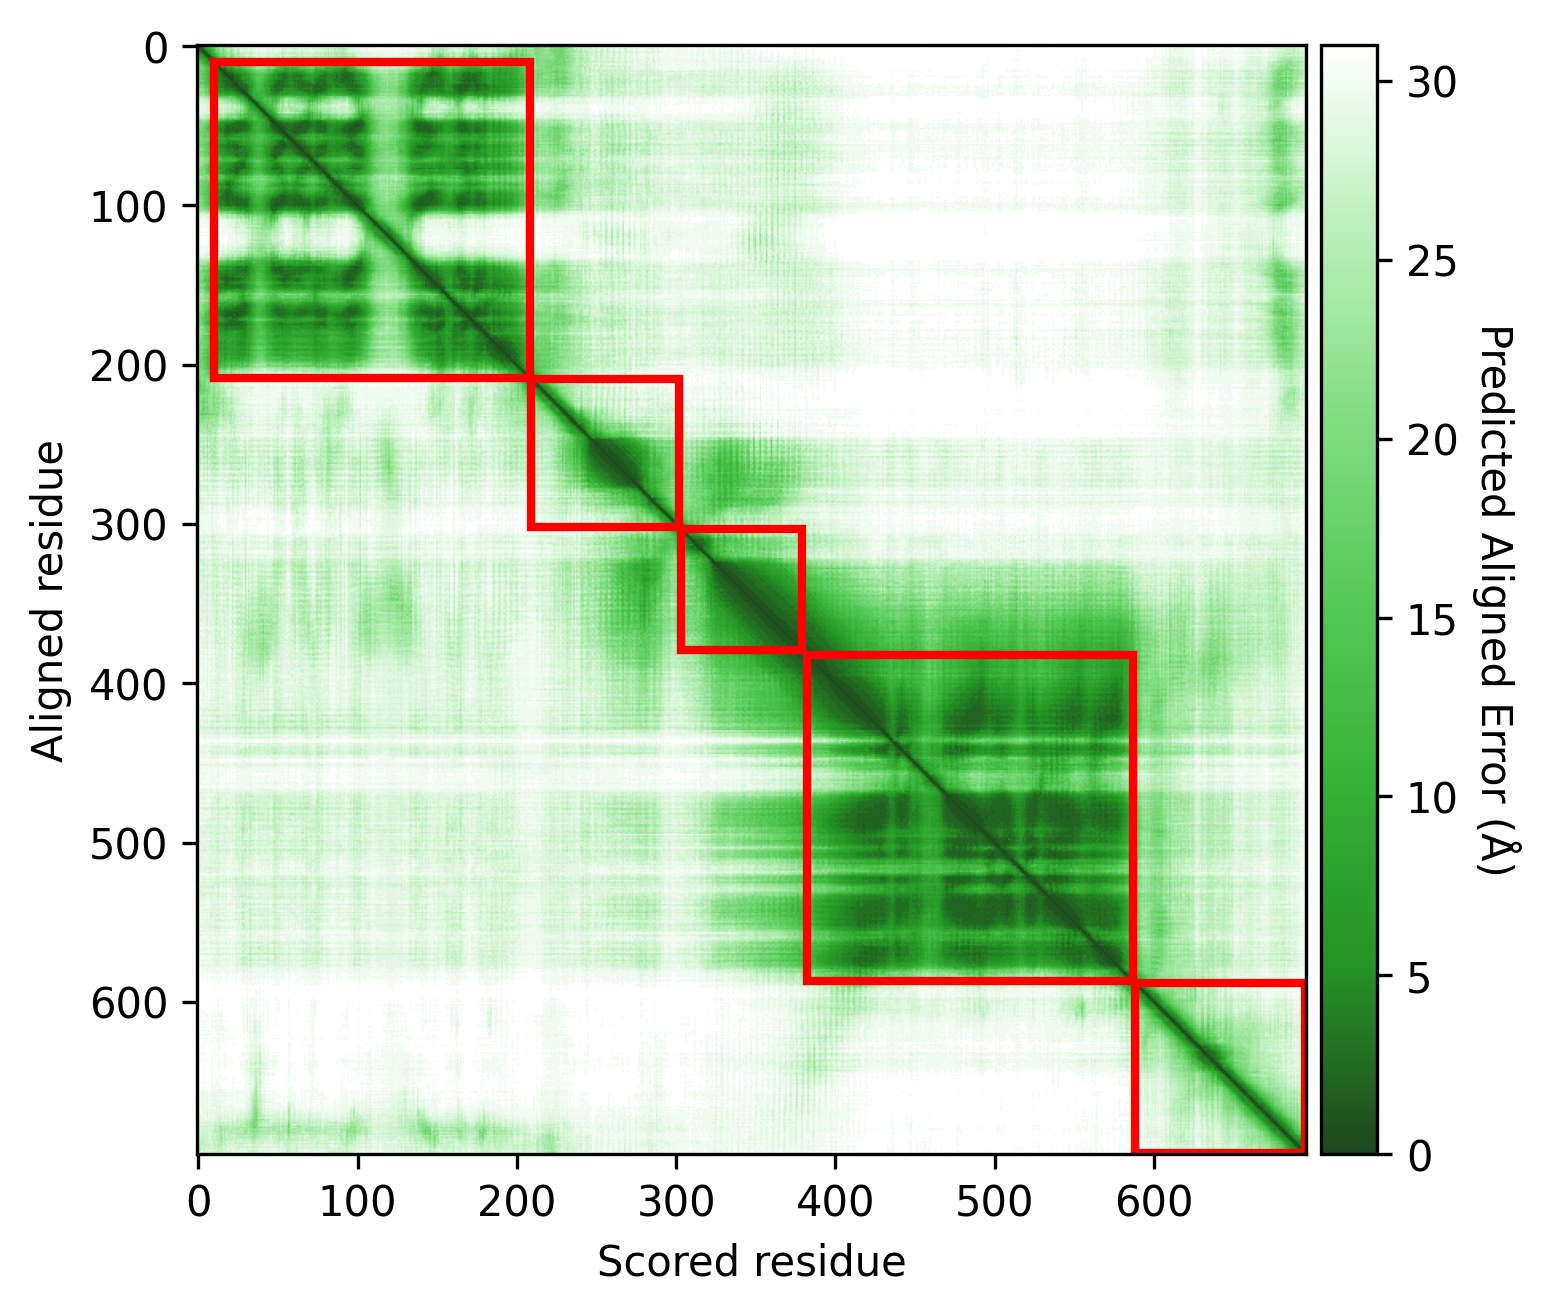
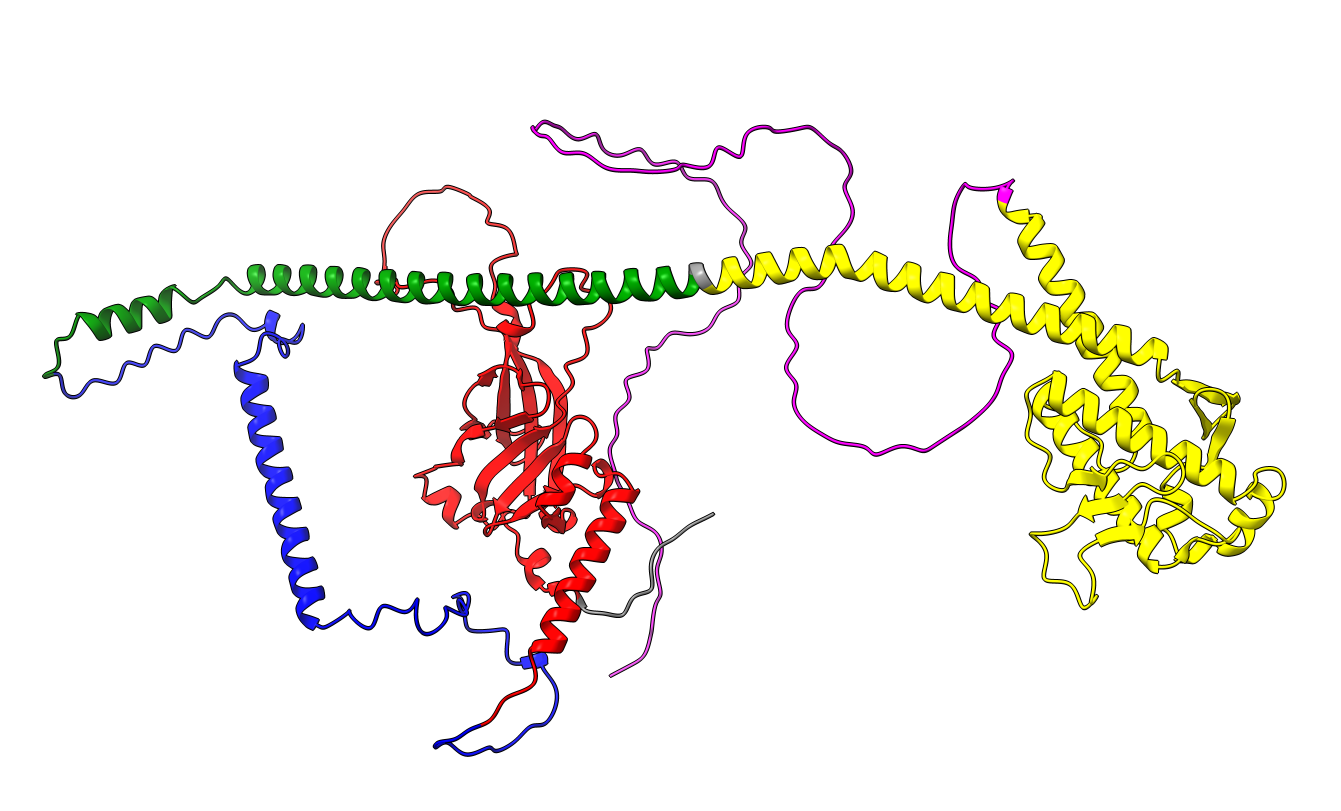
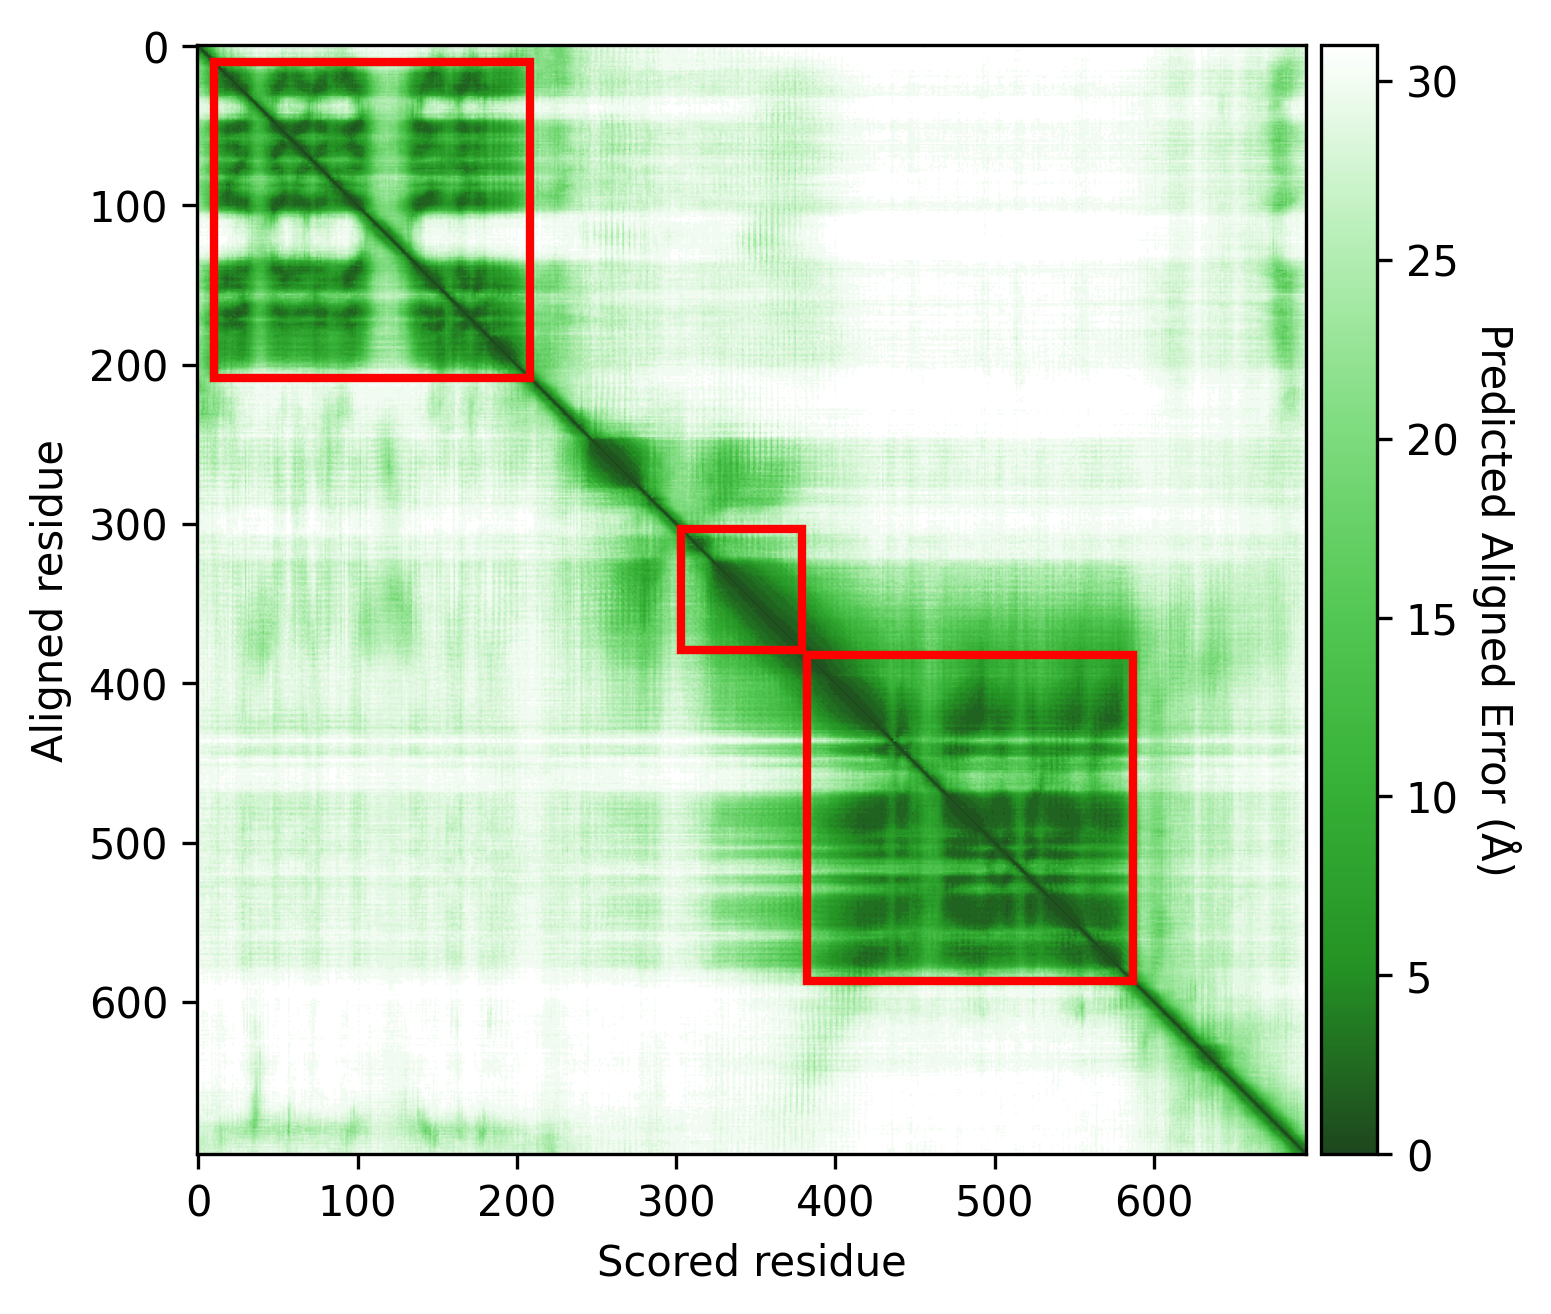
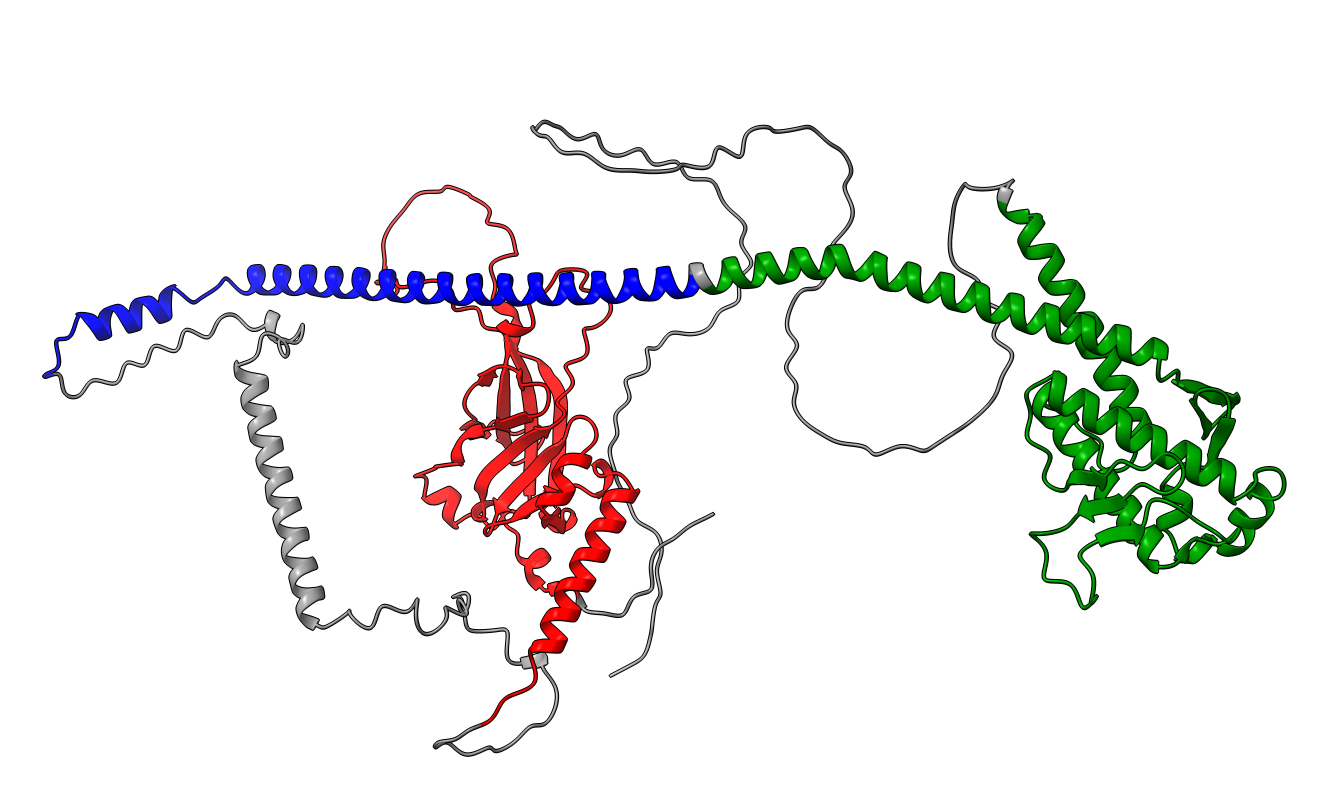
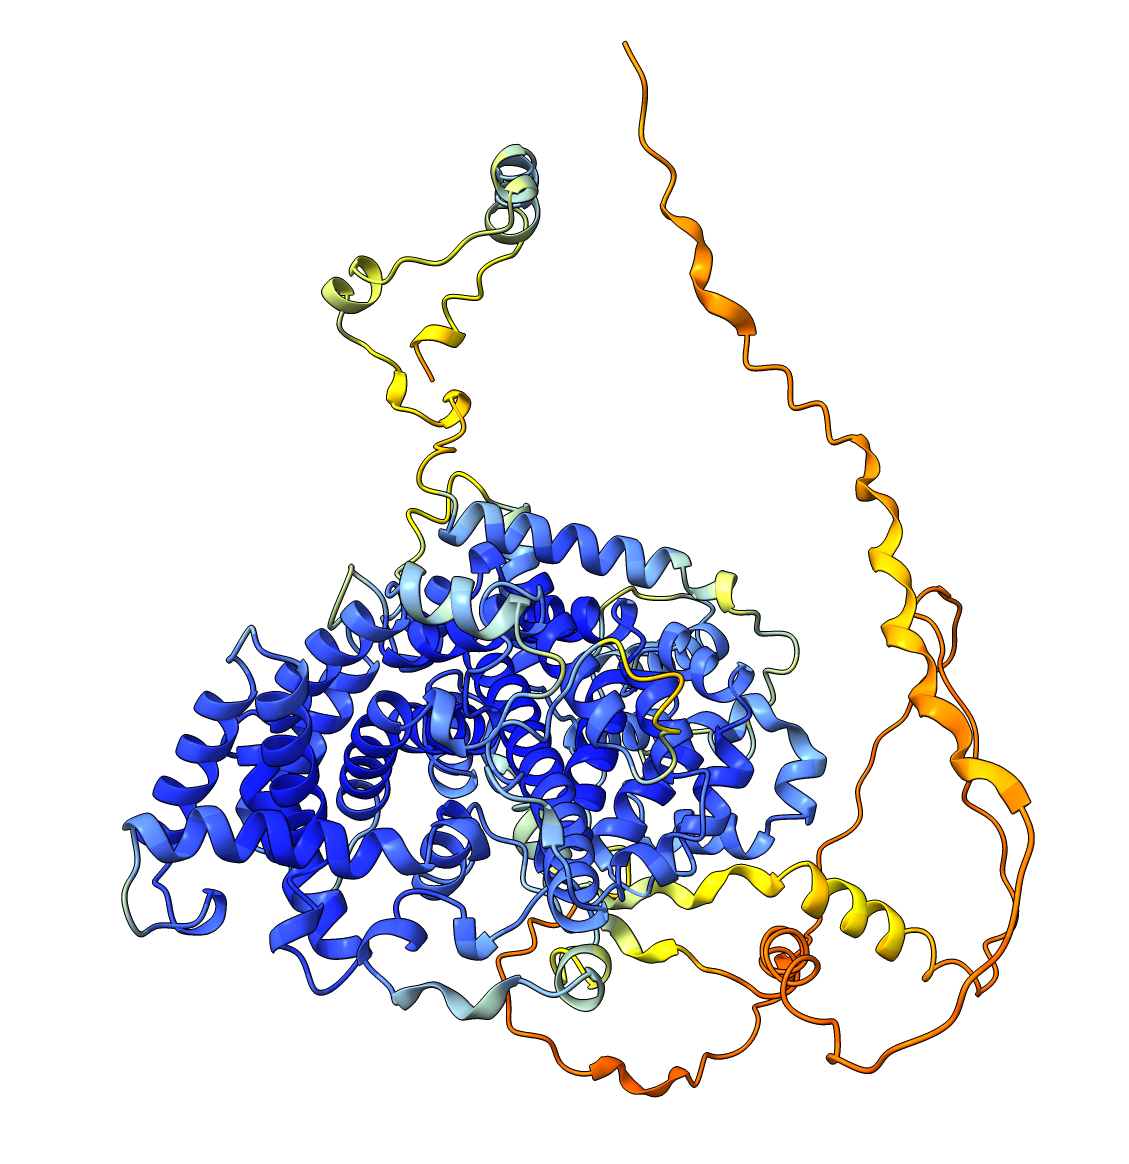
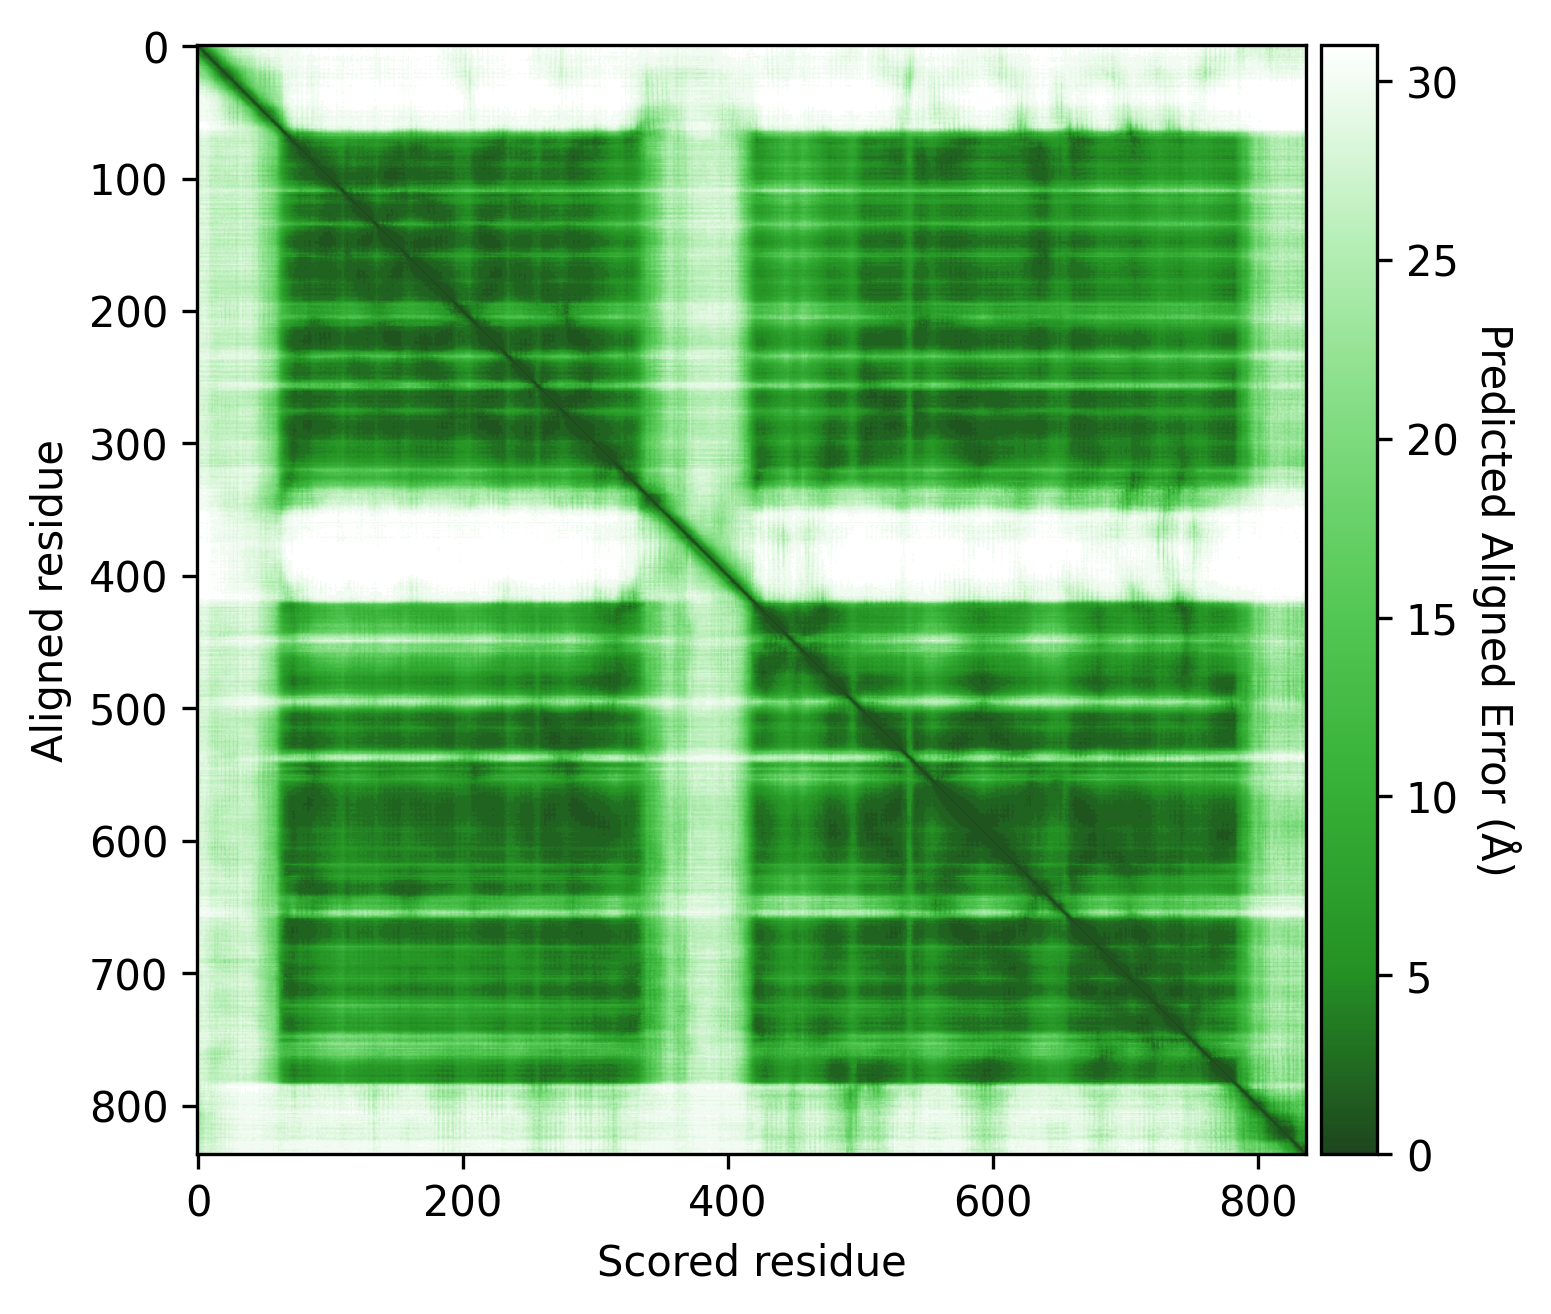
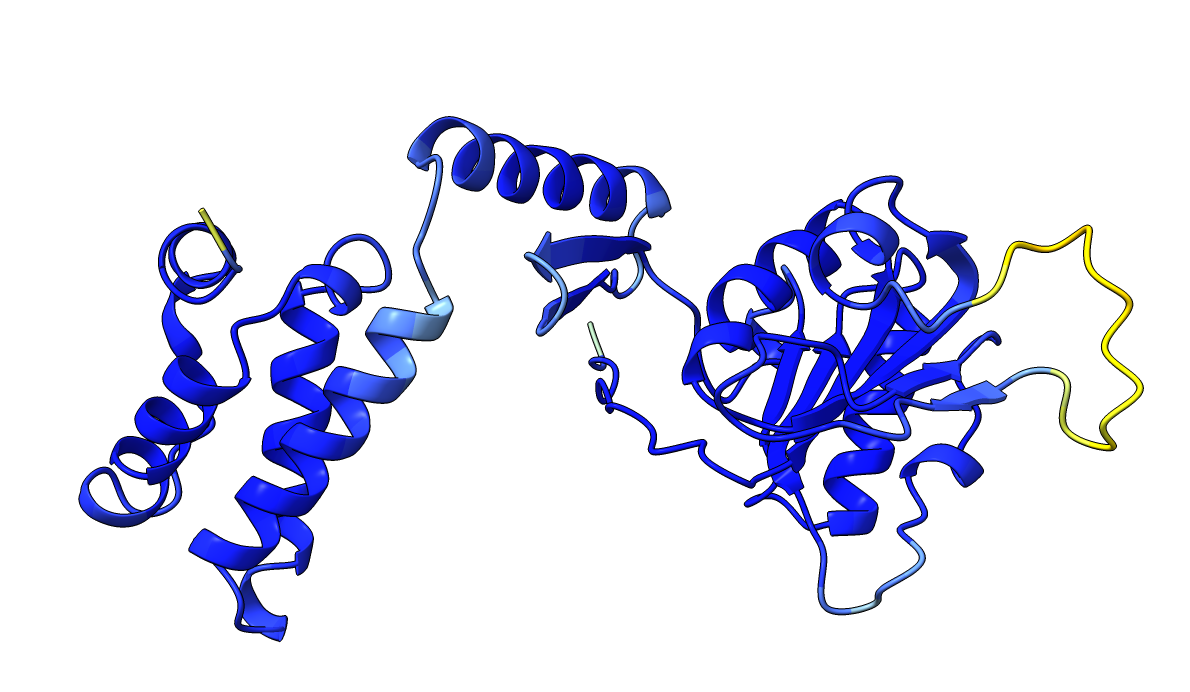
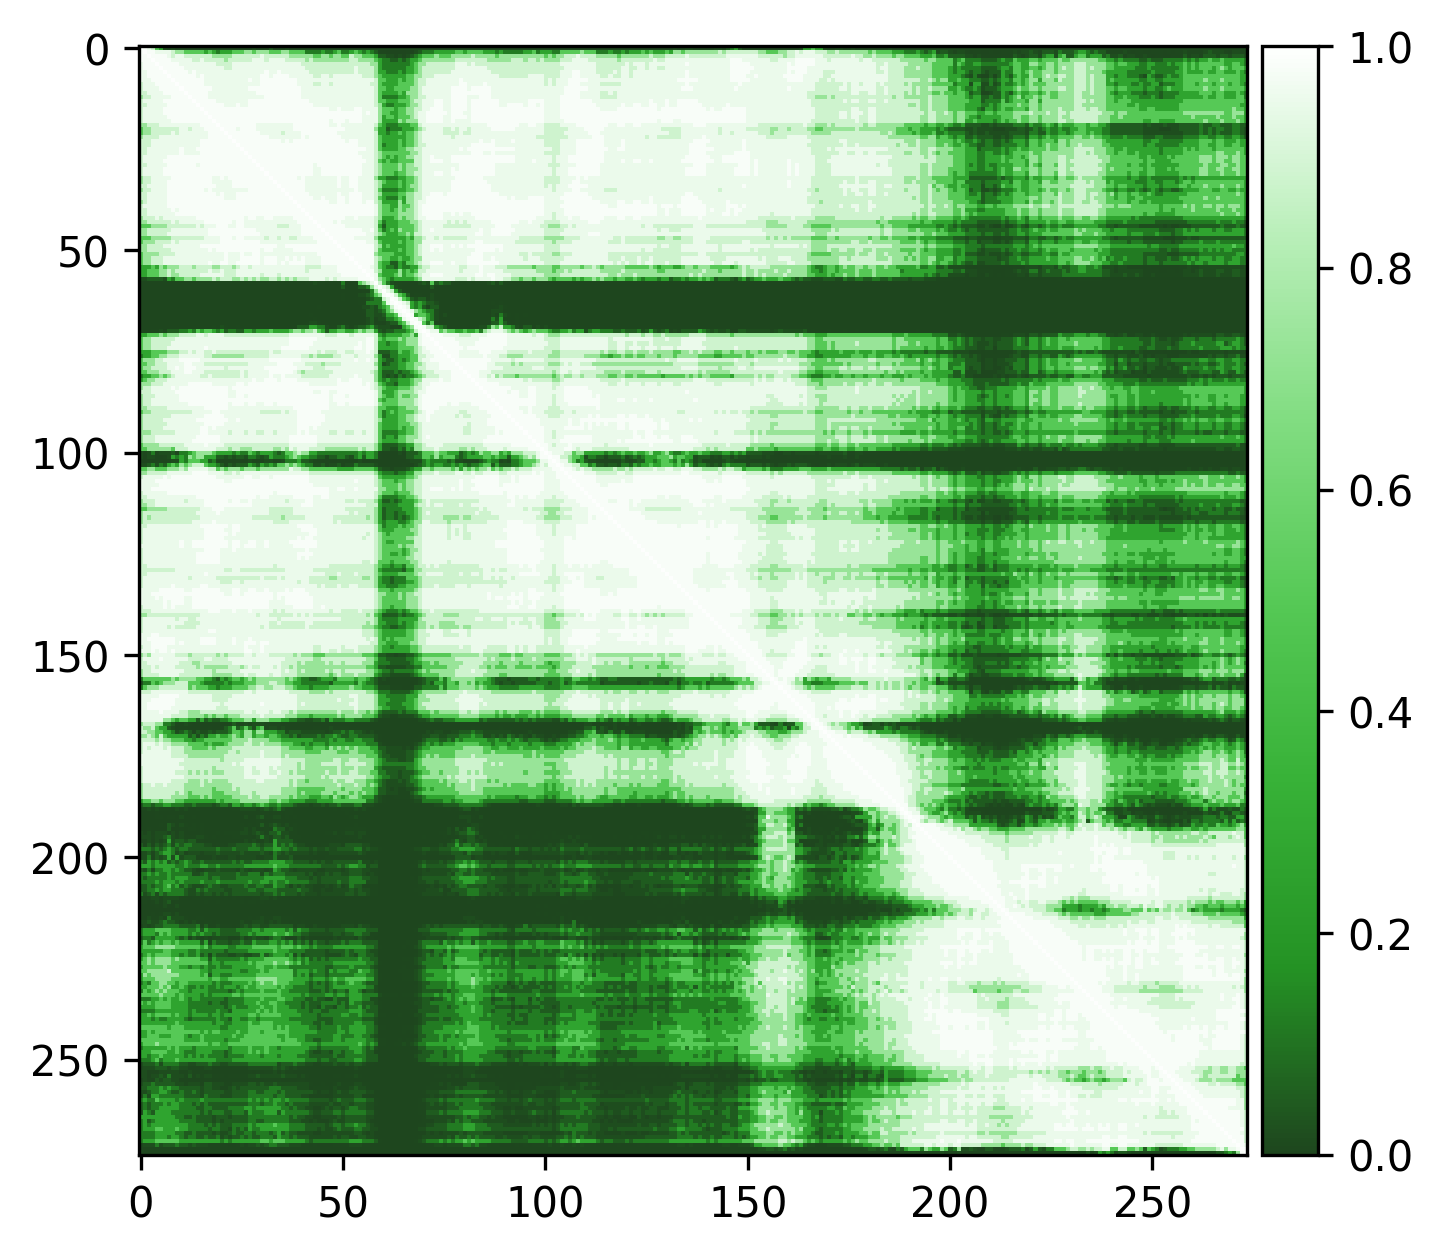
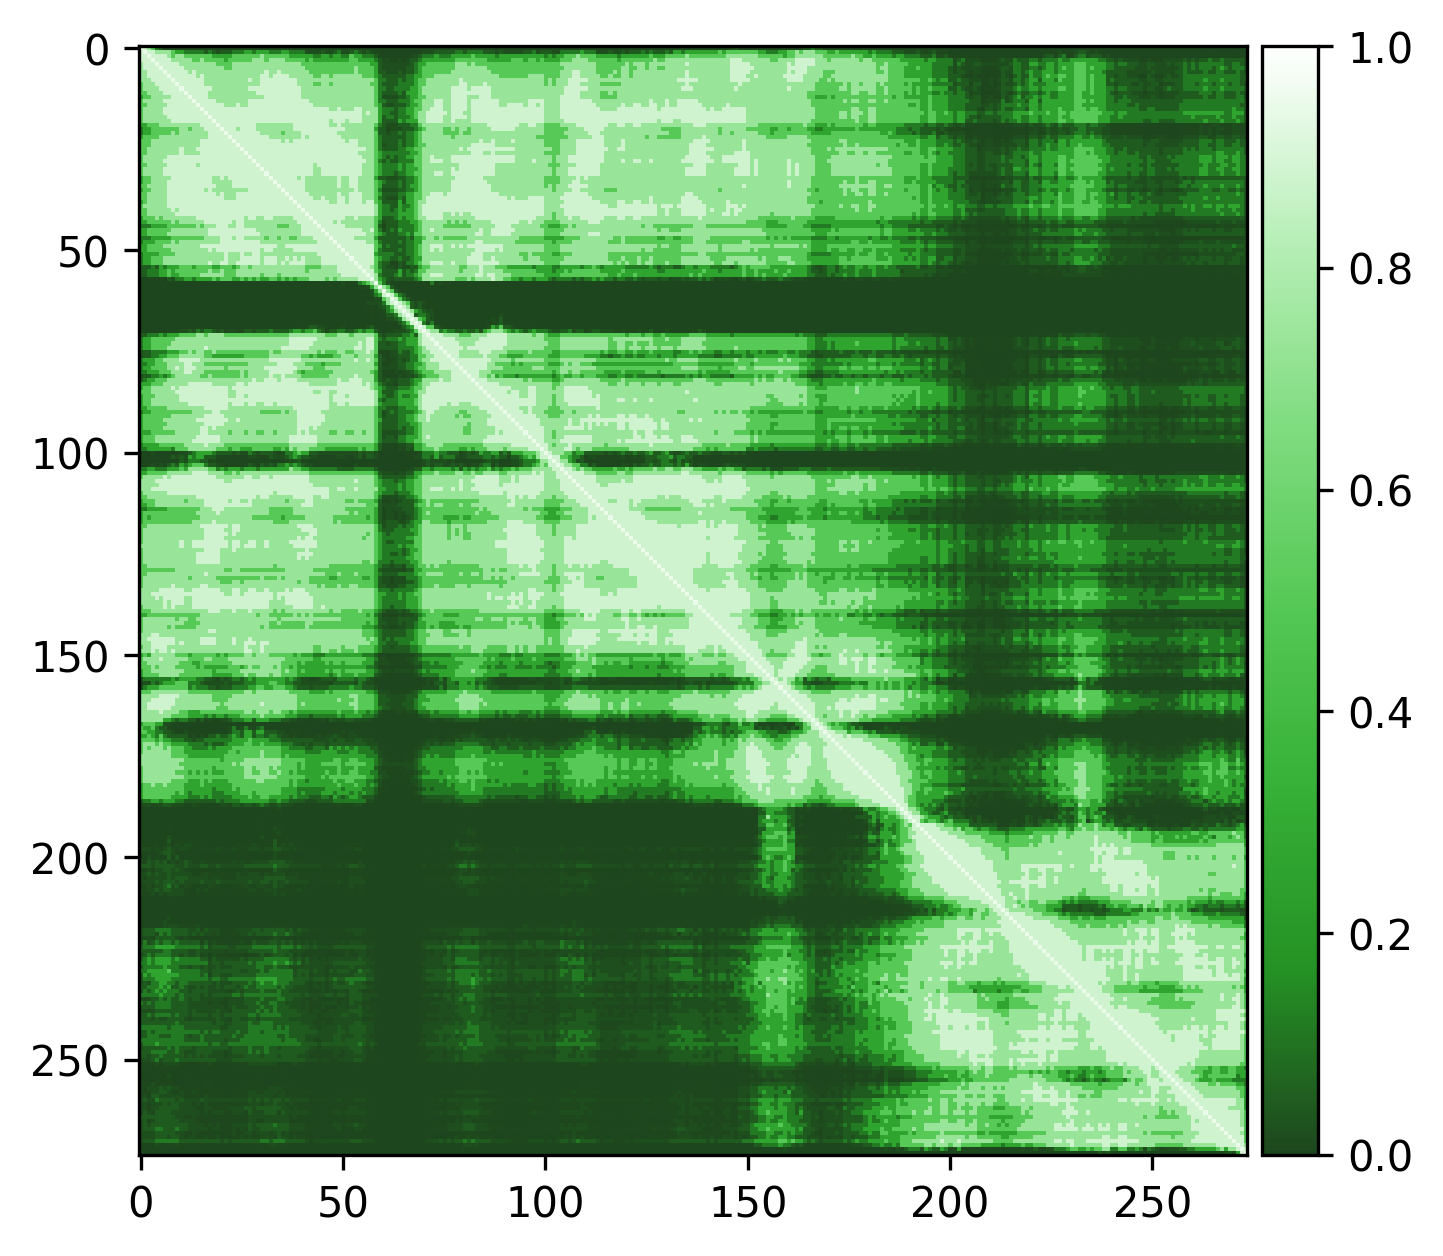
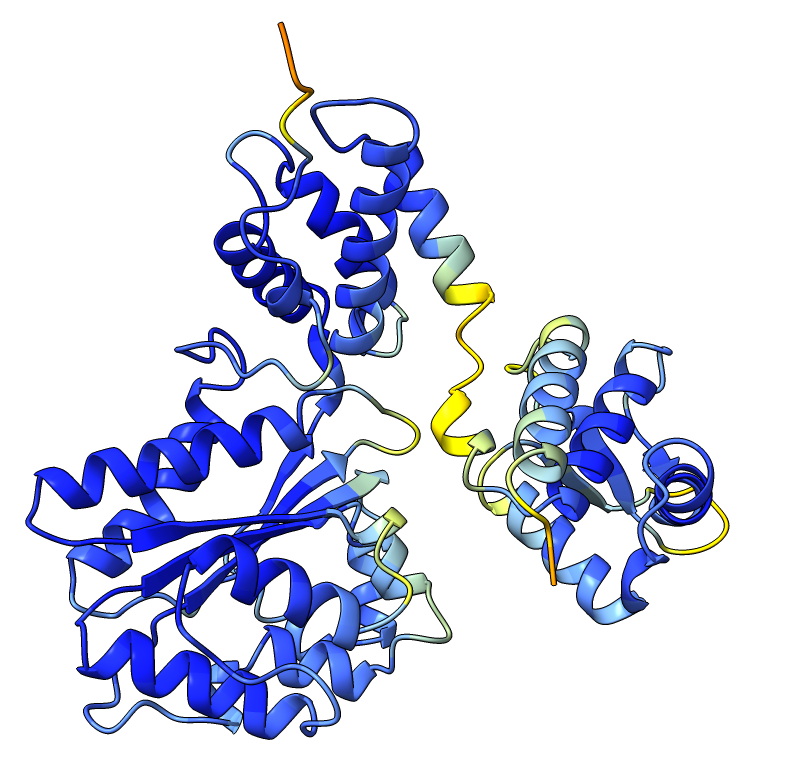
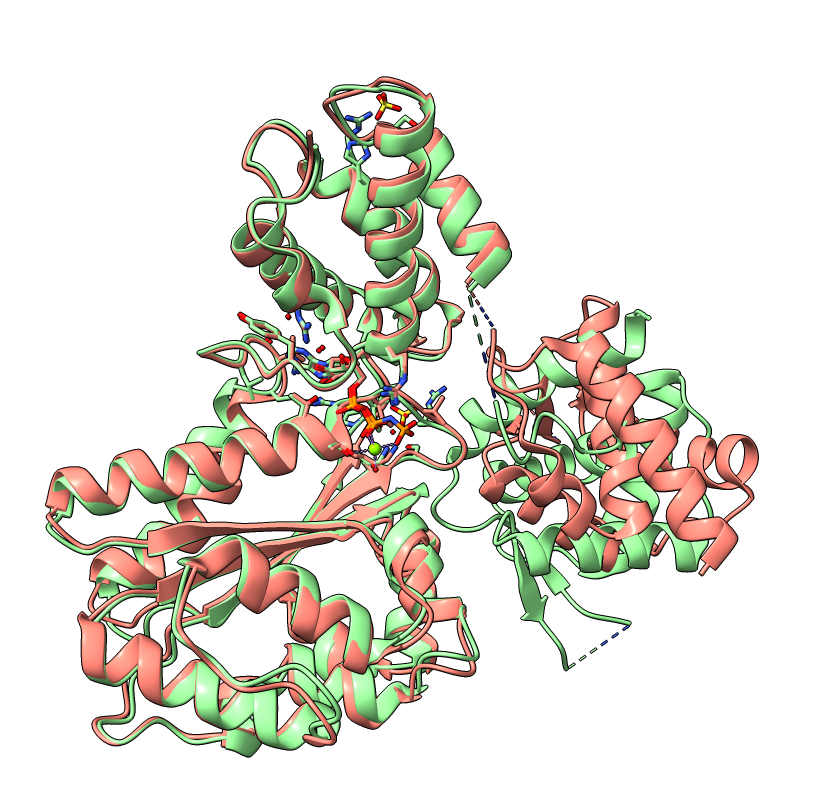
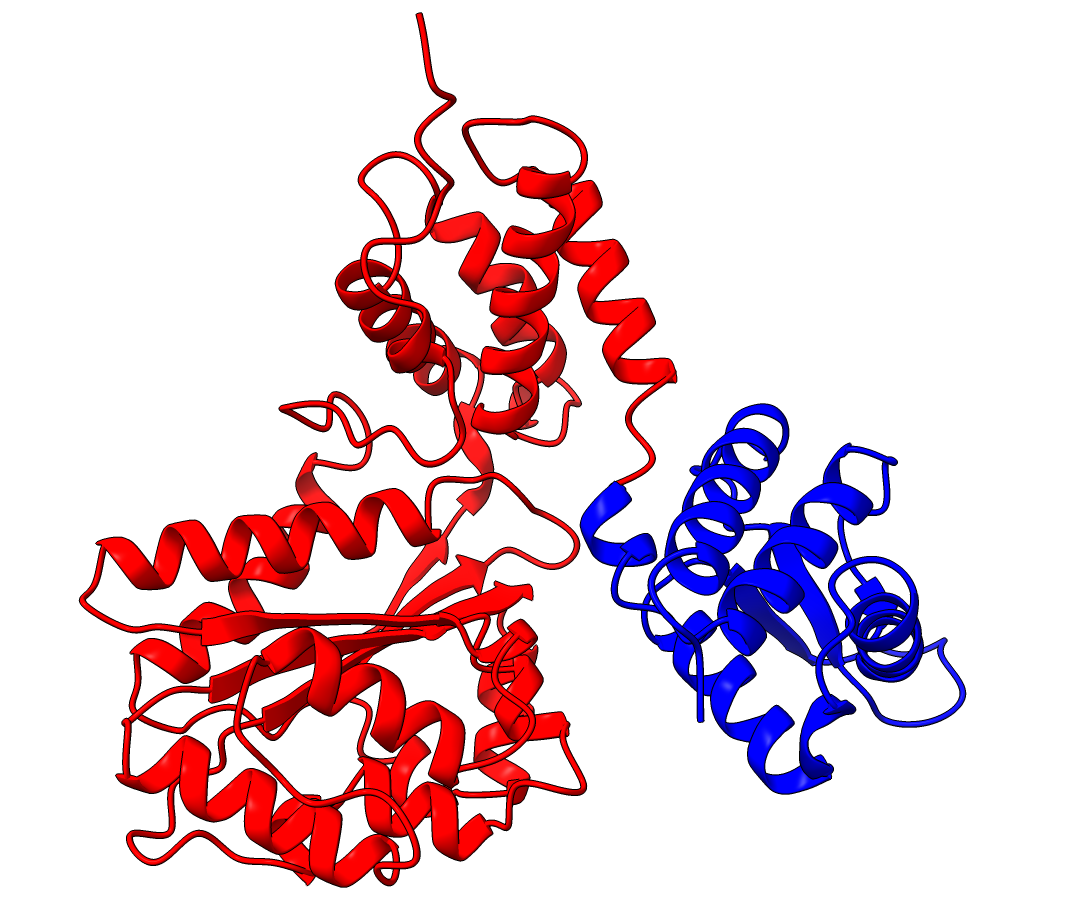
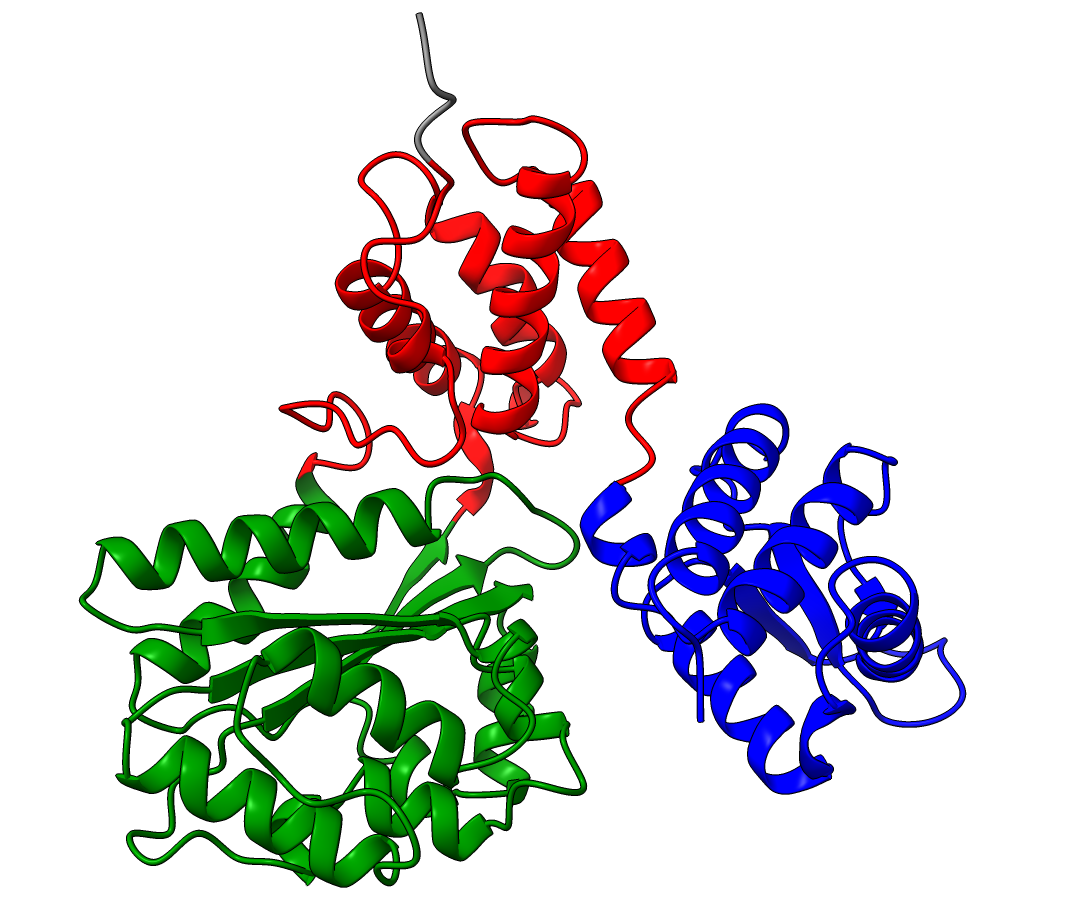
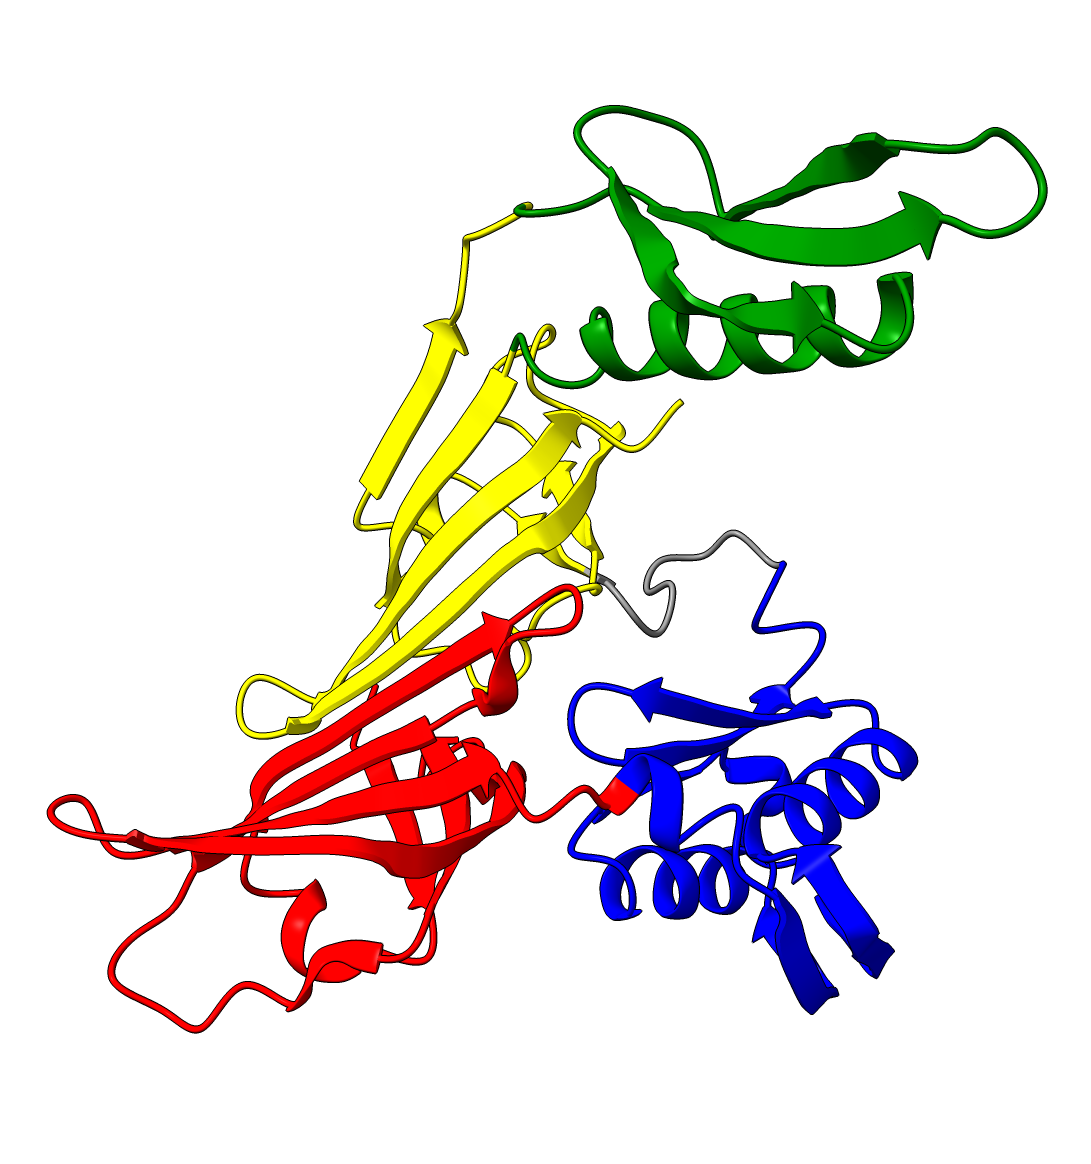
P15807
Very high pLDDT scores and low PAE scores for the AlphaFold structure indicating strong confidence, with one loop as exception. Several linkers, including the disordered N-terminal region, also show unexpectedly high pLDDT scores and low PAE scores, contrary to what would be expected for such regions. This apparent overconfidence is likely due to the inclusion of the crystal structure (1KYQ) in the AlphaFold training dataset.
Lowering the treshold can help reduce this apparent confidence, making it easier to differentiate between genuinely well-structured regions ans those that are more likely to be flexible or disordered.
| AlphaFold structure | PAE plot |
|---|---|
 |
|
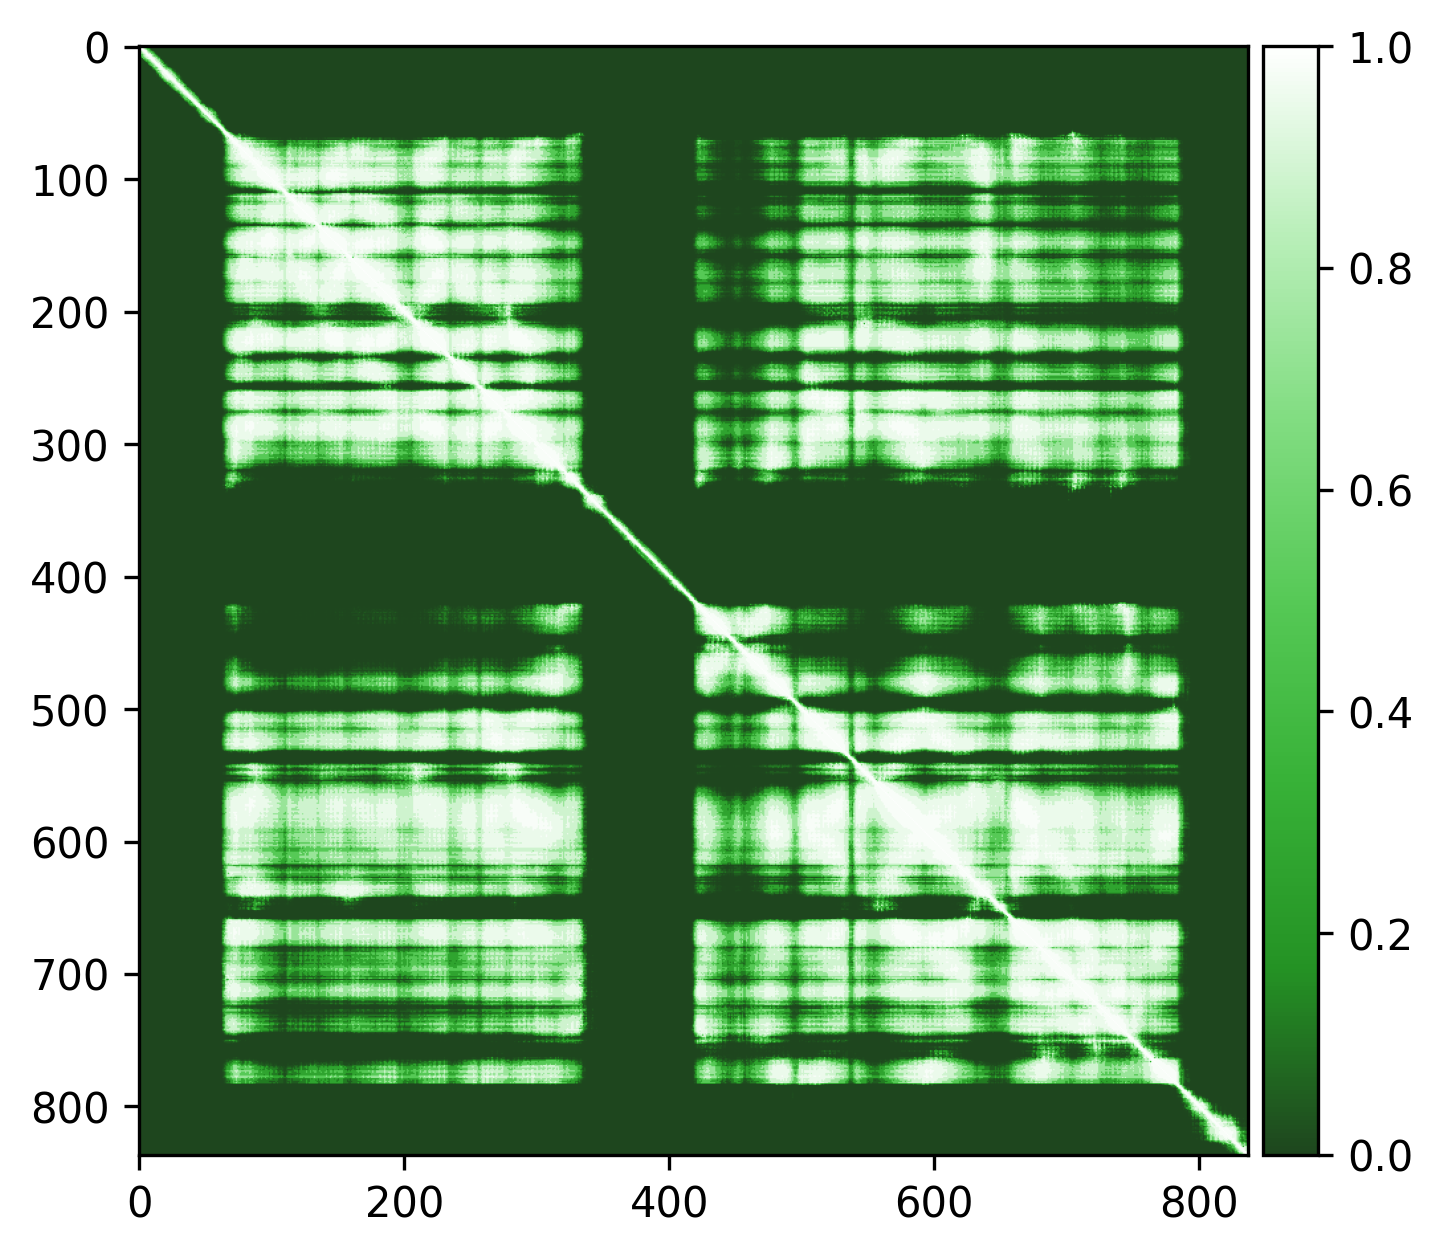
| Edge weights (default threshold = 5) | Edge weights (treshold = 3) |
 |
 |
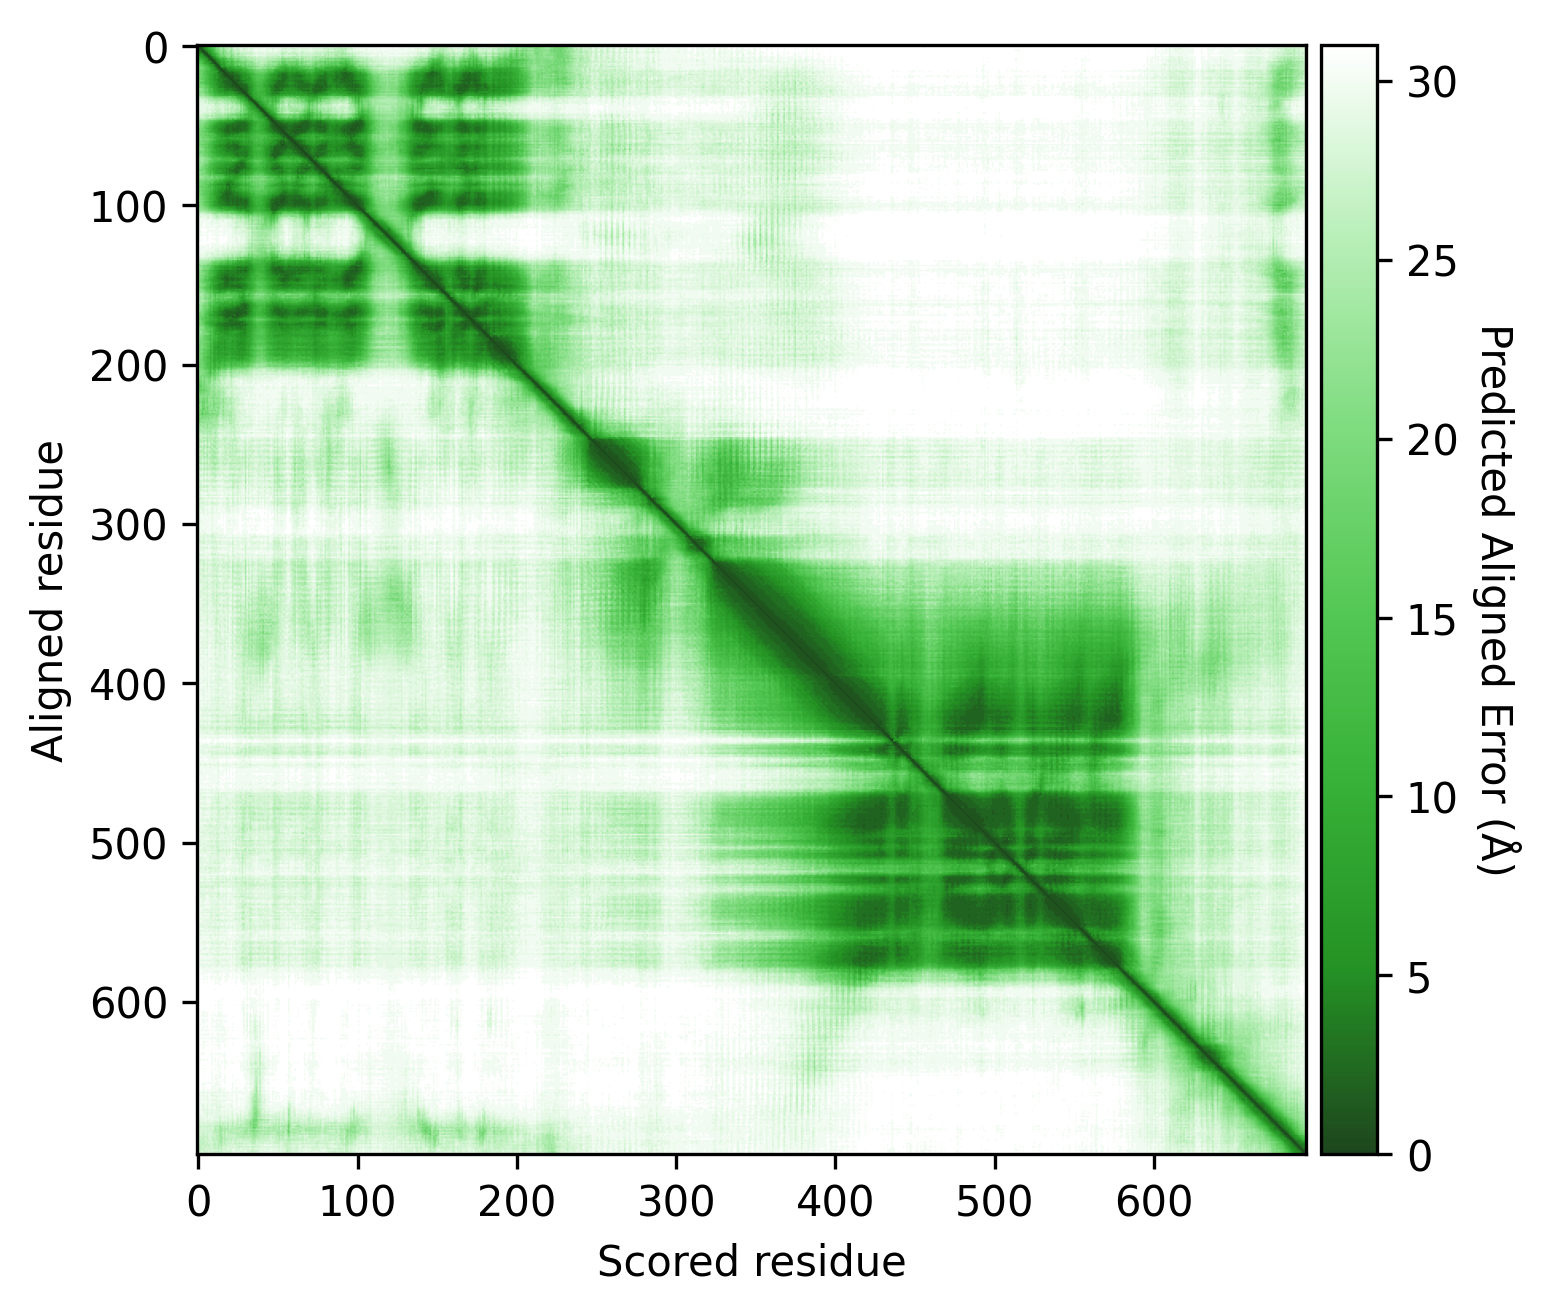
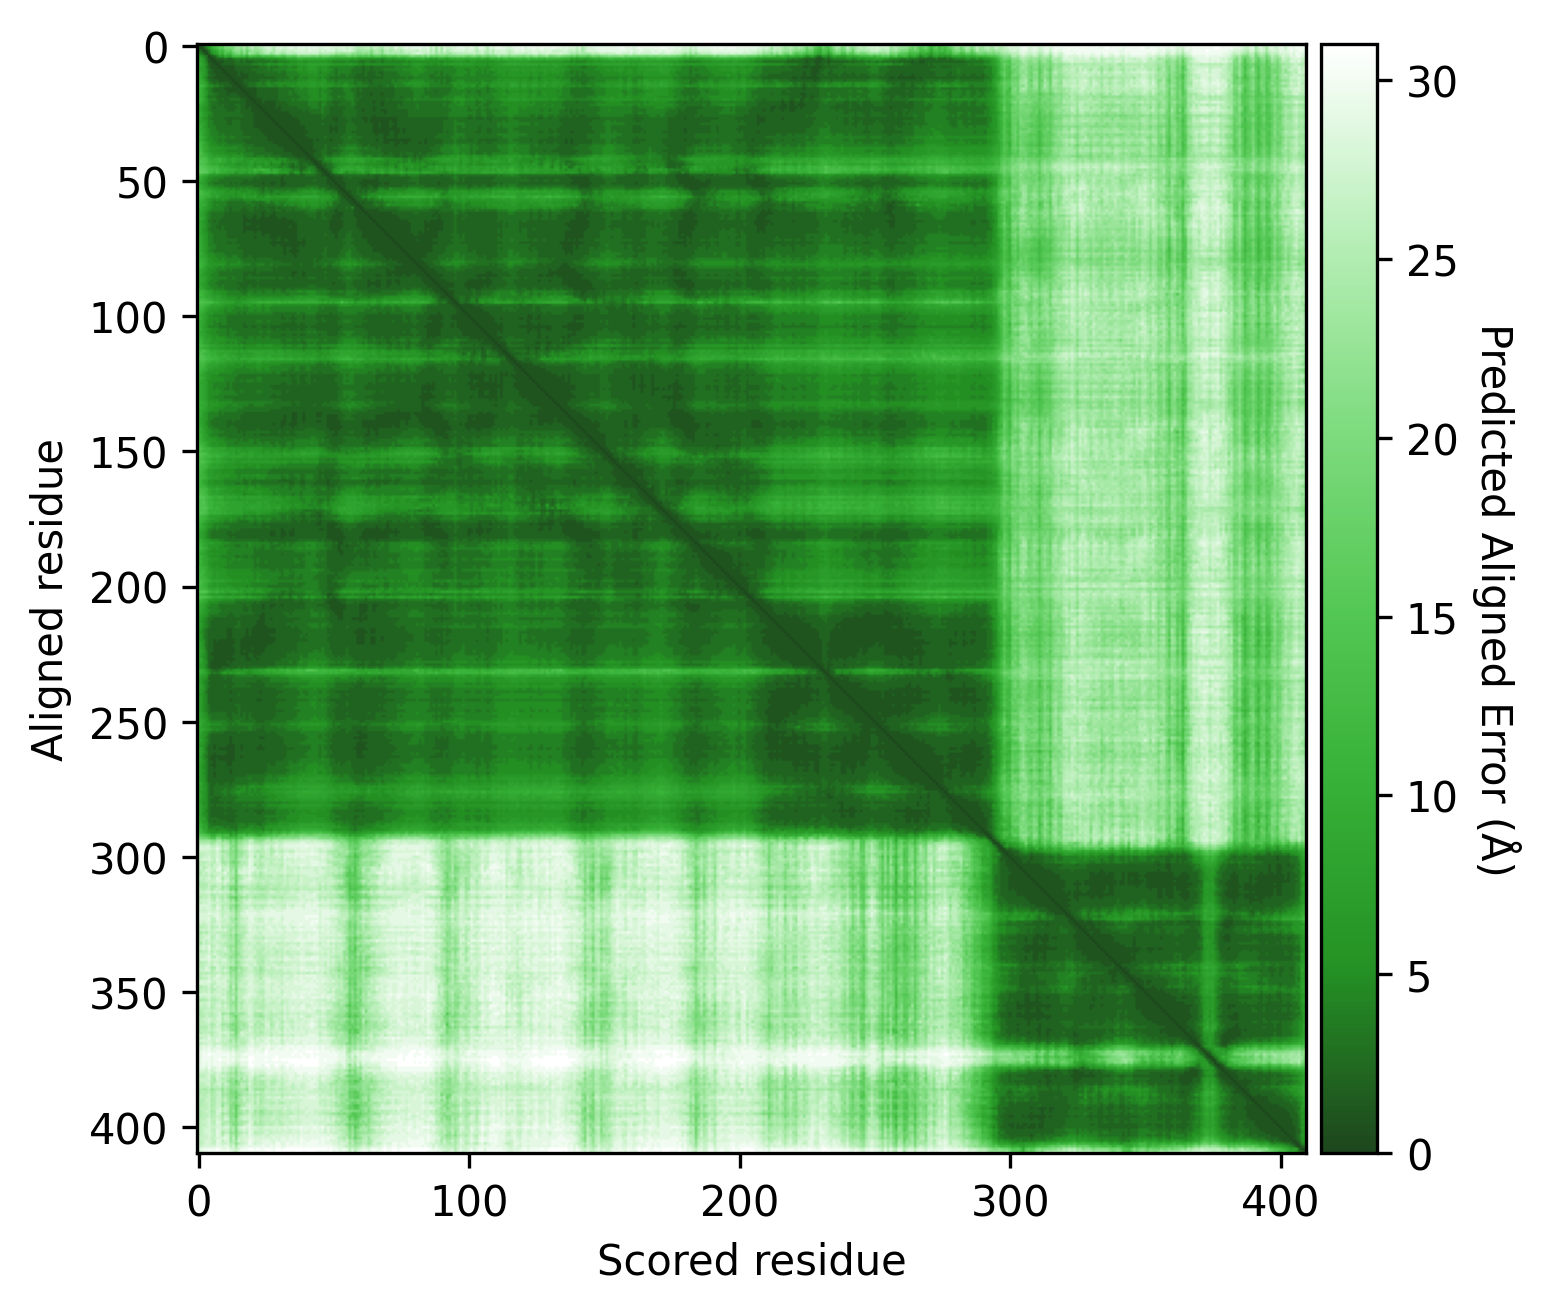
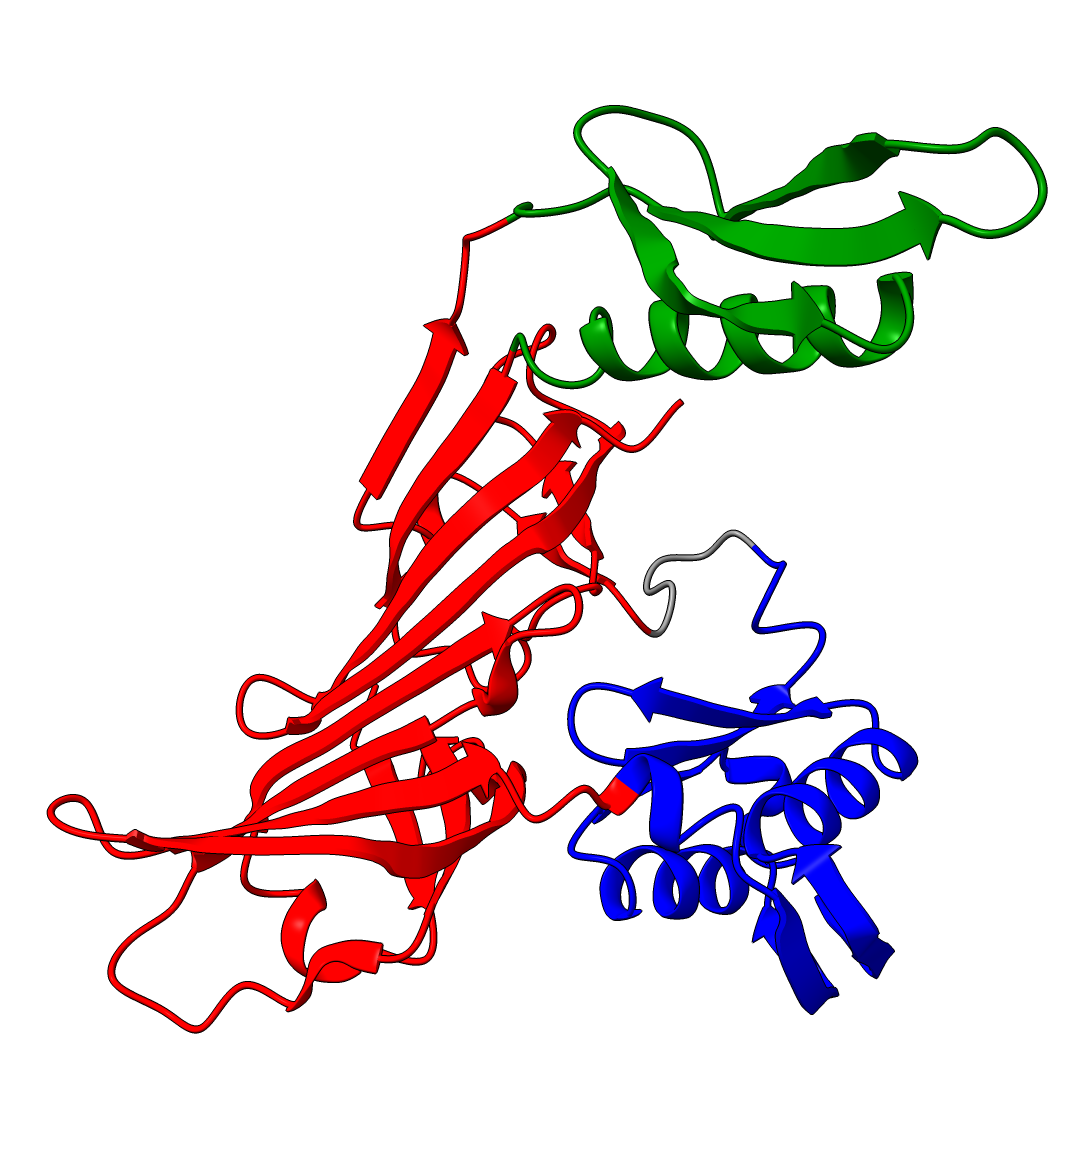
Q9YFU8
Q9YFU8 is a great example to remind us again that the PAE scores are not primarily intended to be used for domain segmentation, but instead are a measure of how confident AlphaFold is in the relative position of two residues.
The PAE plot for Q9YFU8 shows two distinct parts of the protein seperated with hight PAE values, indicating uncertainty in their relative positions. Going of off the previous examples, it would not be uncommon to assume there to be two distince domains in this protein, but this isn't necessarily the case. Q9YFU8 has two crystal structures in the PDB: 1W5S and 1W5T. Superpositioning of these crystal structures reveals that a significant portion of the protein overlays well, however another part shows a large deviation in orientation. AlphaFold likely learned this similarity and difference, resulting in low PAE scores for the overlapping regions and high PAE scores between the differently oriented parts. These structures might explain the resulting PAE scores, but this means we still need to pay attention choosing the threshold to properly segment the remaining parts of the protein structure.
| AlphaFold structure | PAE plot | Crystal structures: 1W5S (green) and 1W5T (red) |
|---|---|---|
 |
 |
 |
Lowering the treshold even if initial inspection deems it not necessary can still change the results. Without changing the threshold we see two domains, consistent with the results from SCOP and SCOPe. While lowering the threshold results in 3 domains, consistent with ECOD, CATH, Interpro and SCOP. (SCOP can contain multiple solutions)
| Threshold = 5 | Threshold = 3 |
|---|---|
 |
 |
(Other settings kept as default values)
Resolution
The resolution can be thought of as the coarseness of clustering. Increasing the resolution will result in more, smaller clusters (/domains). Decreasing the resolution will result in fewer but larger clusters.
- Default: dependent on objective_function
{"modularity": 0.7, "cpm": 0.3}
Examples:
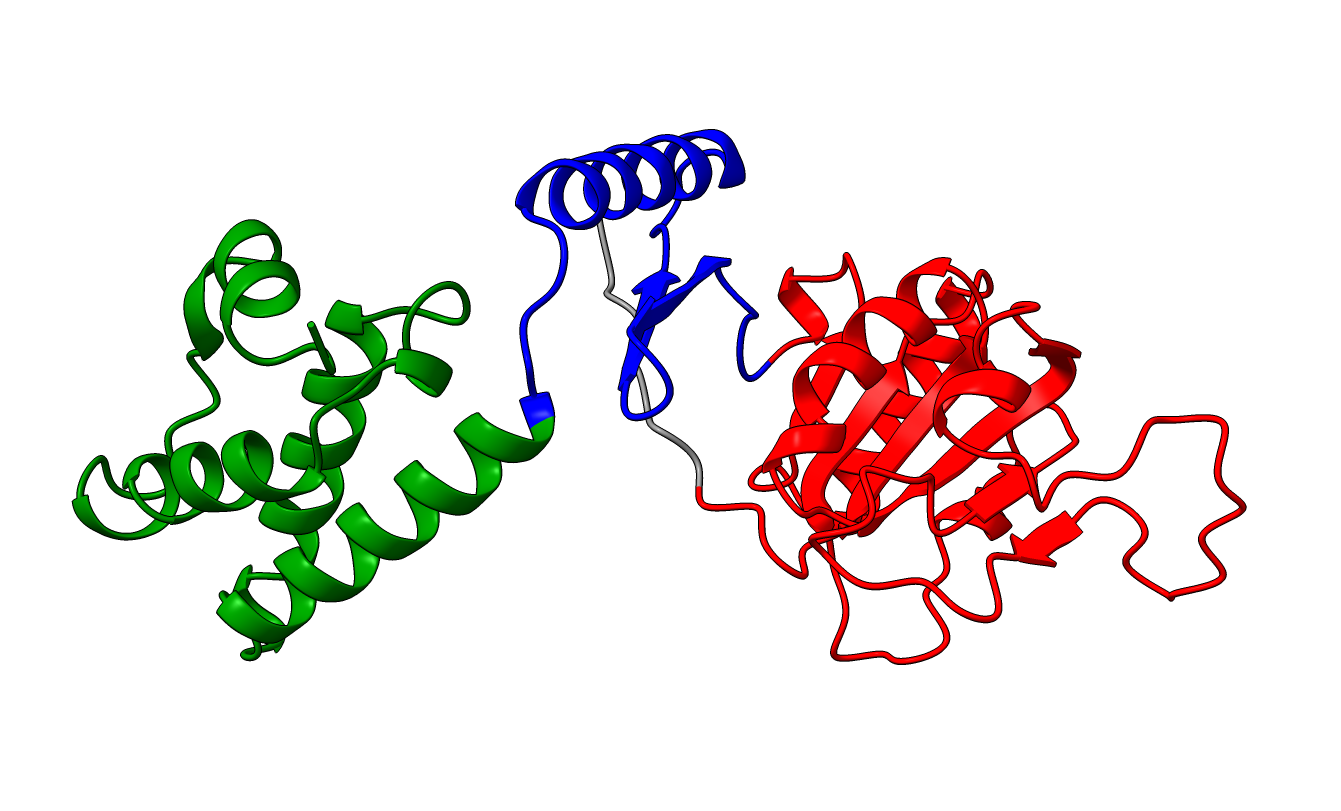
P15807
| Resolution = 0.8 | Resolution = 1.1 | Resolution = 0.3 |
|---|---|---|
 |
 |
 |
A0A098AQT8
| Resolution = 0.8 | Resolution = 1.4 |
|---|---|
 |
 |
More options
Minimum average PAE
The min_avg_pae parameter is a post-processing filter that serves to refine the clustering results. It is used to remove domains that do not meet a specified confidence criterion. Specifically, it filters out any domain for which the average PAE value is above a user-defined threshold.
No min_avg_pae |
min_avg_pae = 15 |
|---|---|
|
|
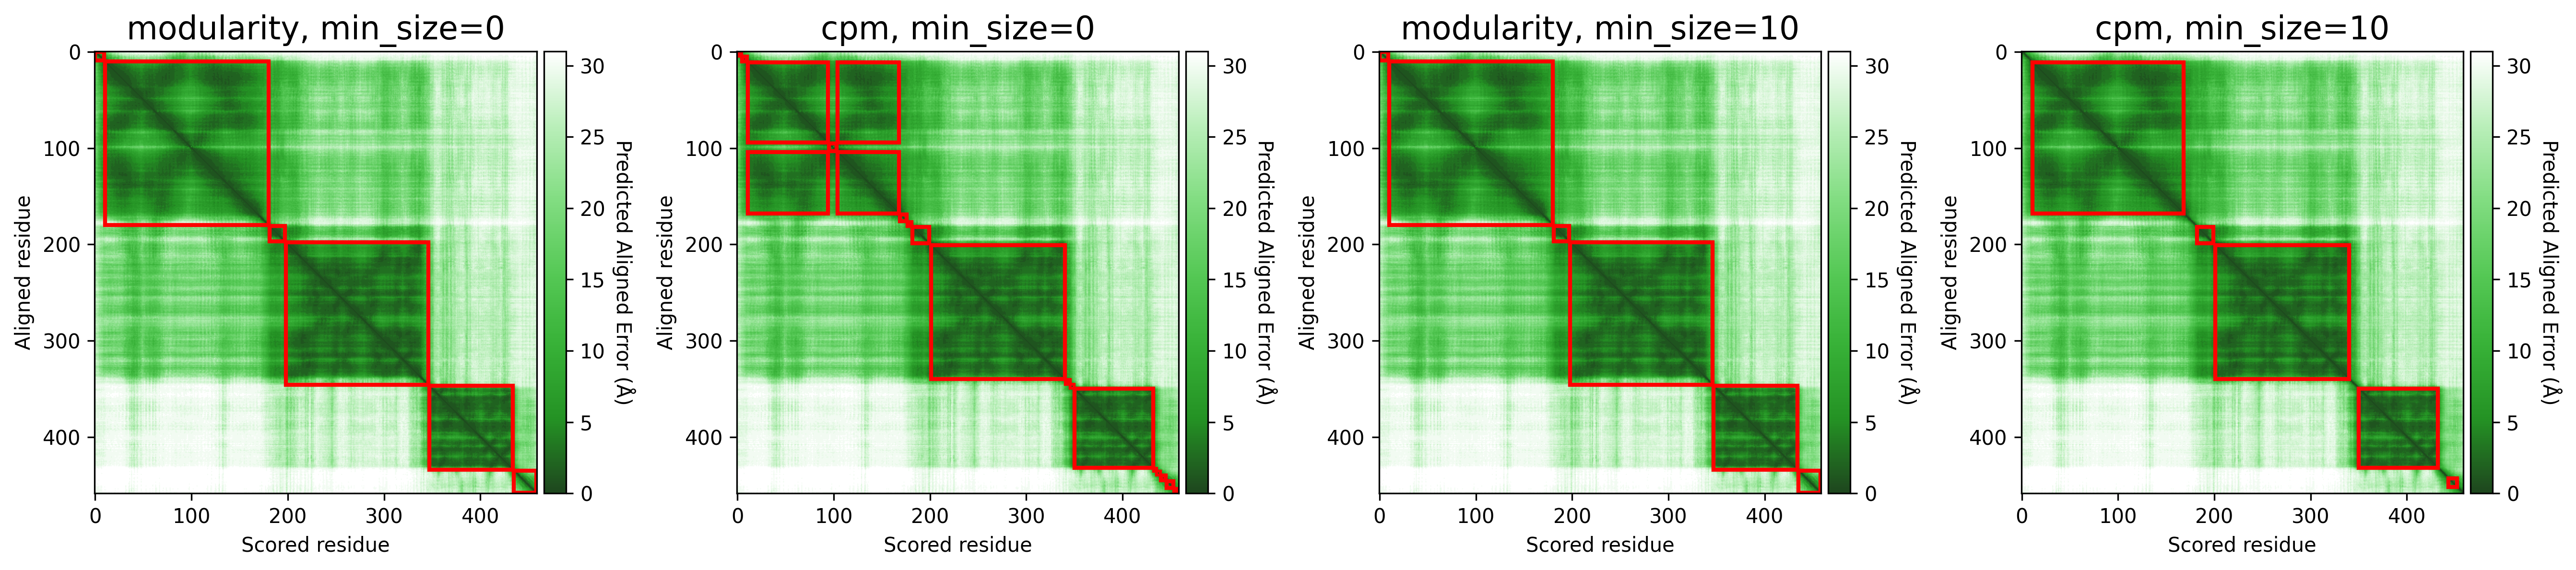
Objective function
The objective function that is optimized during clustering, choices are either CPM (constant potts model) or Modularity. The contant potts model does not suffer from the resolution limit problem like modularity does, leading to more, smaller well-defined clusters. This means that 'CPM' will result in more smaller, tightly connected clusters that represent specific subgroups or communities within the data. On the other hand, 'Modularity' will tend to produce fewer, larger clusters that encompass broader groups within the data.
For AFragmenter, 'CPM' translates to a more sensitive approach where we see many more smaller clusters, especially for disordered regions. 'Modularity' is less sensitive to small shifts in PAE values, and will be better at clustering residues from disordered regions together.
- Default:
modularity - Options:
[modularity, cpm]
Examples:
P04637
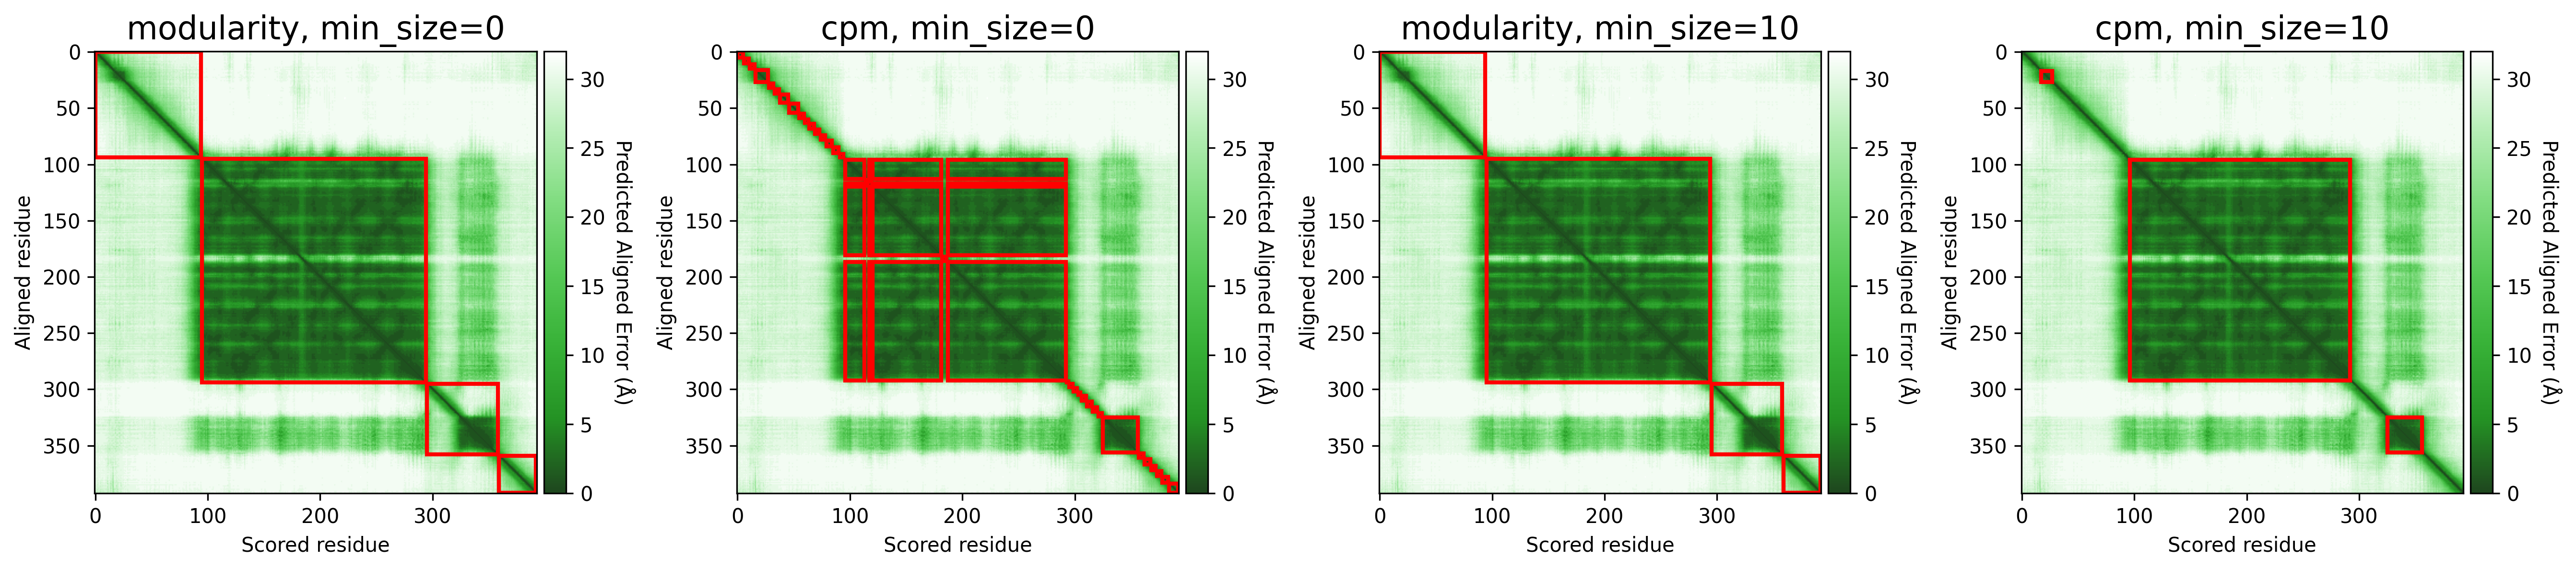
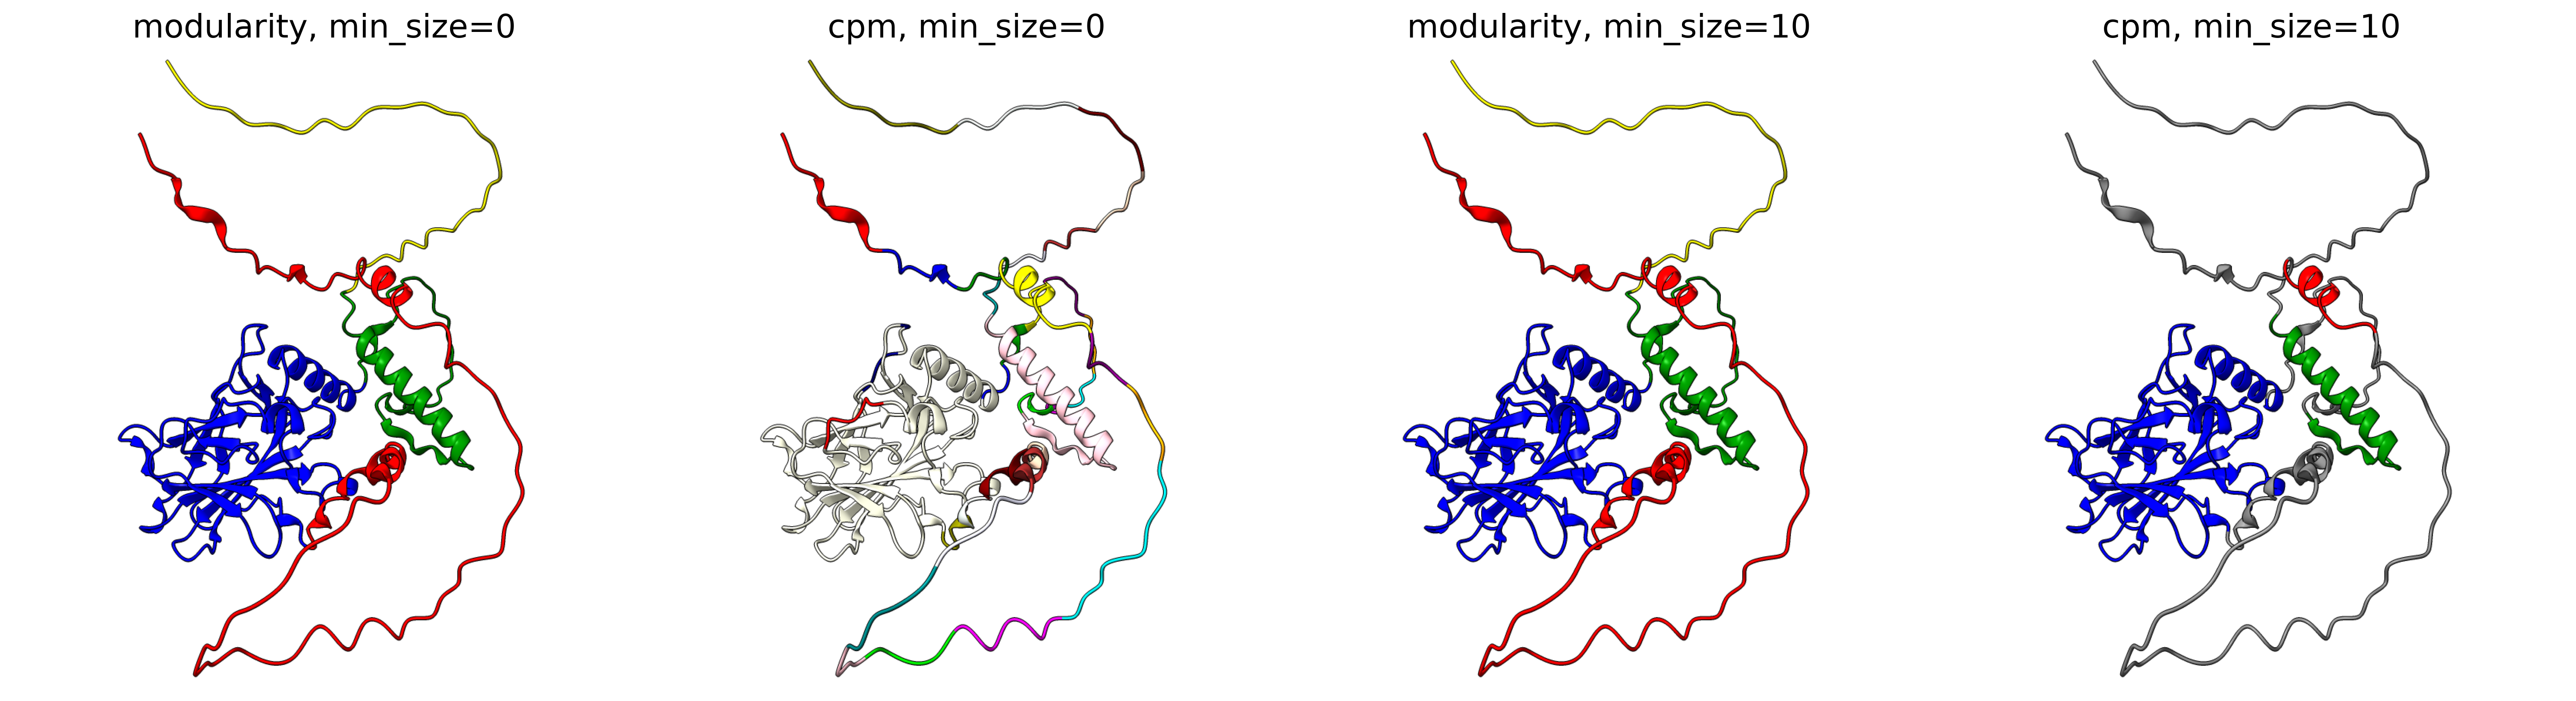
Q837X5
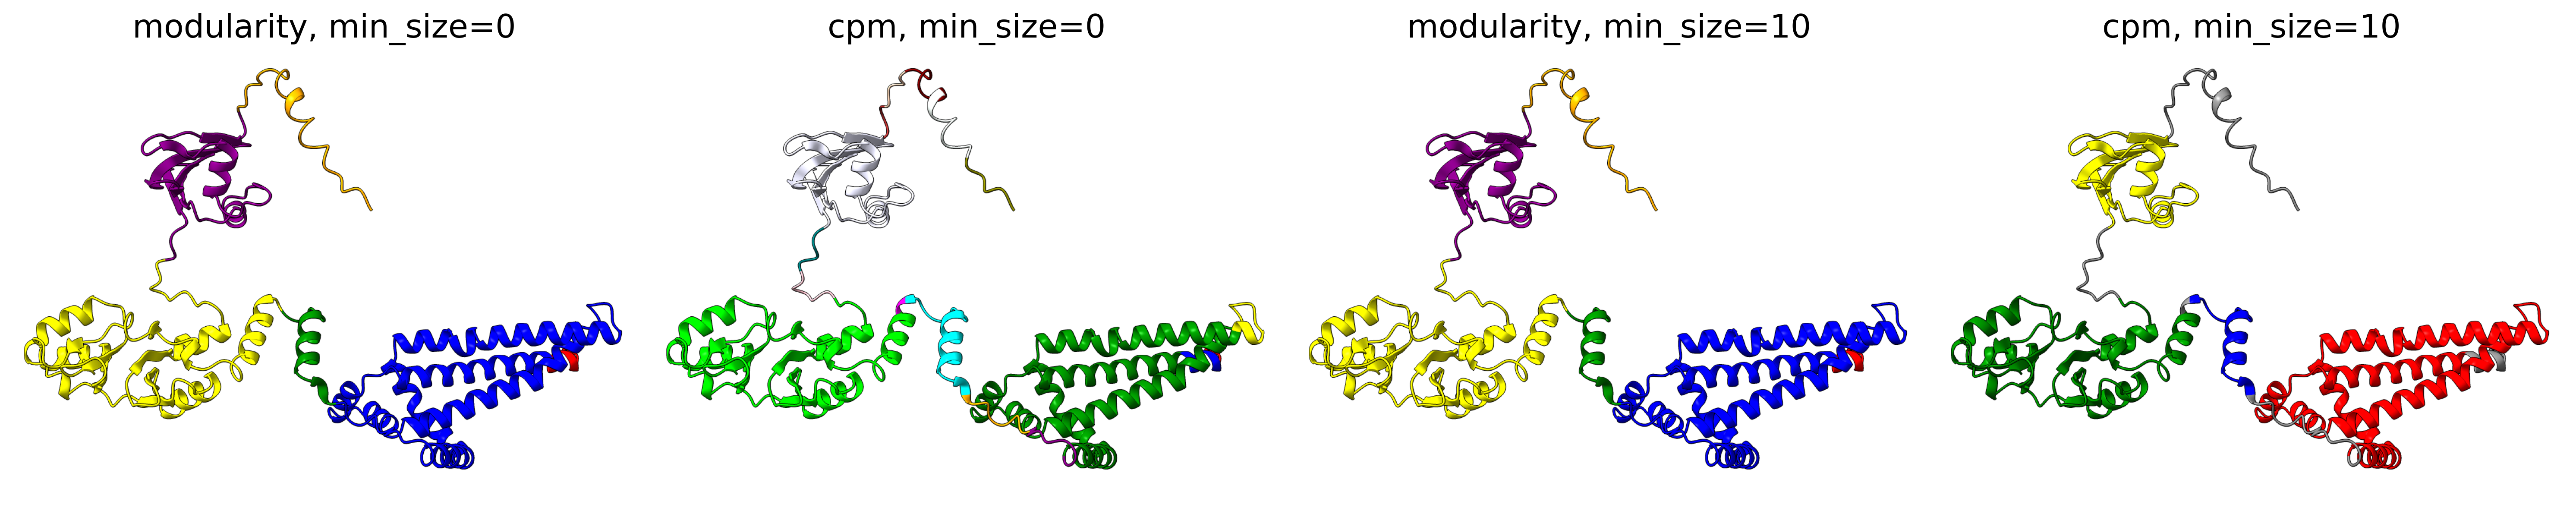
Minimum size (min_size)
The min_size parameter specifies the minimum number of residues required for a cluster / domain to be considered valid. Clusters below this threshold are filtered out during post-processing. This helps in reducing noise and focusing on significant structural or functional regions.
- Default value: 10
- Valid range: 0 ≤ min_size ≤ Number of Residues
A higher min_size is often used for larger proteins to focus on major domains, while a lower value allows capturing smaller but potentially important regions. Adjusting this parameter can impact the granularity of your clustering results.
For examples, refer to the examples in Objective function.
Merge
The merge parameter, also referred to as attempt_merge, plays a important role in refining the clustering process.
When enabled, it attempts to merge smaller clusters (= below min_size) with adjacent larger ones, ensuring that the resulting clusters are more meaningful and less fragmented. Resulting clusters below the min_size are first attempted to be merged with adjacent larger clusters. If merging is not possible, the small clusters are filtered out.
- Default value:
True


Download files
Download the file for your platform. If you're not sure which to choose, learn more about installing packages.
Source Distribution
Built Distribution
Filter files by name, interpreter, ABI, and platform.
If you're not sure about the file name format, learn more about wheel file names.
Copy a direct link to the current filters
File details
Details for the file afragmenter-0.0.6.tar.gz.
File metadata
- Download URL: afragmenter-0.0.6.tar.gz
- Upload date:
- Size: 35.3 kB
- Tags: Source
- Uploaded using Trusted Publishing? No
- Uploaded via: poetry/2.1.3 CPython/3.10.12 Linux/6.6.87.2-microsoft-standard-WSL2
File hashes
| Algorithm | Hash digest | |
|---|---|---|
| SHA256 |
652f03f39e37e549305e9f9181cd6fcd6d5daf03bac4eb237dcbe5cc12154e59
|
|
| MD5 |
8f2fa855e105e28316d9307fc17d944a
|
|
| BLAKE2b-256 |
7039ac274e4dbf29a79e2f4e5d69025a5f331fff25a8cf933d694b8edf5e8929
|
File details
Details for the file afragmenter-0.0.6-py3-none-any.whl.
File metadata
- Download URL: afragmenter-0.0.6-py3-none-any.whl
- Upload date:
- Size: 35.2 kB
- Tags: Python 3
- Uploaded using Trusted Publishing? No
- Uploaded via: poetry/2.1.3 CPython/3.10.12 Linux/6.6.87.2-microsoft-standard-WSL2
File hashes
| Algorithm | Hash digest | |
|---|---|---|
| SHA256 |
b923a892d82bbd349232461a04f049035aaf6a1c5c58d2e4bf763baf21ebc920
|
|
| MD5 |
53e4274c50e886203b89668d872c6c97
|
|
| BLAKE2b-256 |
f83ffbb3fbf913a496cc87df82b006ee9ce4e3b2837845c86a8c65e01d0a35ab
|


