Package for performing QC on Electronic Health Record (EHR) data

Project description
EHRQC
Introduction
The performance of the Machine Learning (ML) models is primarily dependent on the underlying data on which it is trained on. Therefore, it is very essential to ensure that the training data is of the highest quality possible. It is a standard practice to perform operations related to handling of the missing values, and outliers before feeding it to machine learning algorithms, for which there are well established procedures and dedicated libraries currently. However, they are generic in nature and do not cover the domain specific nuances. For instance, non standard data sanity checks are to be performed in addition, to remove further errors in the Electronic Health Records (EHRs) that are specific to the medical domain. This utility is aimed at providing functions that can summarize the errors that are specific to the healthcare domain in the data through various visualizations.
System architecture
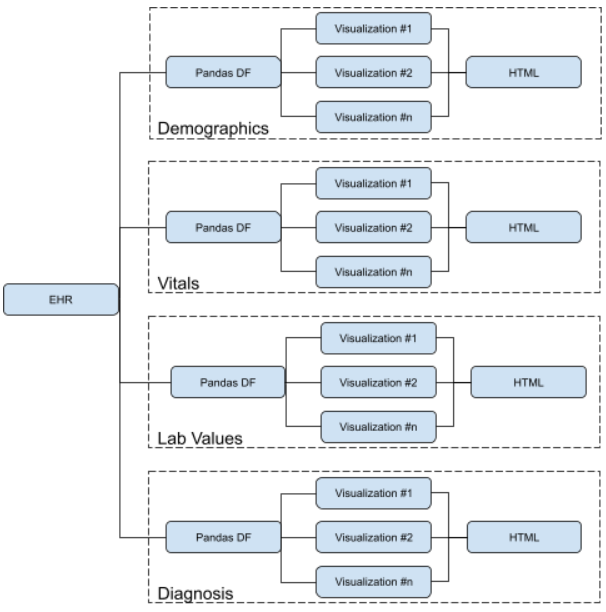
Example Output
Refer demographics.html, vitals.html, lab_measurements.html, vitals_anomalies.html, and lab_measurements_anomalies.html
Installation Guide
Install the following libraries
pip install numpy
pip install matplotlib
pip install yattag
pip install scipy
pip install sklearn
pip install pandas
Then install EHRQC
pip install EHRQC
User Guide
Extract Demographic data from OMOP schema
from qc.extract import extractOmopDemographics as extractOmopDemographics

omopDemographicsDf = extractOmopDemographics()
omopDemographicsDf.head()
Extract Vitals data from OMOP schema
from qc.extract import extractMimicOmopVitals as extractMimicOmopVitals

mimicOmopVitalsDf = extractMimicOmopVitals()
mimicOmopVitalsDf.head()
Extract Lab Measurements data from OMOP schema
from qc.extract import extractOmopLabMeasurements as extractOmopLabMeasurements

omopLabMeasurementsDf = extractOmopLabMeasurements()
omopLabMeasurementsDf.head()
Extract Demographic data from MIMIC schema
from qc.extract import extractMimicDemographics as extractMimicDemographics

mimicDemographicsDf = extractMimicDemographics()
mimicDemographicsDf.head()
Extract Vitals data from MIMIC schema
from qc.extract import extractMimicVitals as extractMimicVitals

mimicVitalsDf = extractMimicVitals()
mimicVitalsDf.head()
Extract Lab Measurements data from MIMIC schema
from qc.extract import extractMimicLabMeasurements as extractMimicLabMeasurements

mimicLabMeasurementsDf = extractMimicLabMeasurements()
mimicLabMeasurementsDf.head()
Demographics Graphs Example 1
import qc.demographicsGraphs as demographicsGraphs

data = [
    [0, 1, 2, 'male', 'white', date.fromisoformat('2020-09-13'), date.fromisoformat('2021-09-13')],
    [2, 3, 4, np.nan, 'white', date.fromisoformat('2020-09-14'), date.fromisoformat('2021-09-13')],
    [4, 5, 6, 'female', 'black', date.fromisoformat('2020-09-15'), date.fromisoformat('2021-09-13')],
    [6, 7, 8, np.nan, 'asian', date.fromisoformat('2020-09-14'), date.fromisoformat('2021-09-13')]]
demographicsGraphs.plot(pd.DataFrame(data, columns=['age', 'weight', 'height', 'gender', 'ethnicity', 'dob', 'dod']))
Demographics Graphs Example 2
import qc.demographicsGraphs as demographicsGraphs

df = dbUtils._getDemographics()
demographicsGraphs.plot(df)
Vitals Graphs Example 1
import qc.vitalsGraphs as vitalsGraphs

data = [
    [0, 1, 2],
    [2, np.nan, 4],
    [4, 5, np.nan],
    [0, 1, 2],
    [2, 3, 4],
    [4, 5, np.nan],
    [0, 1, 2],
    [2, 3, 4],
    [4, 5, 6],
    [6, 7, np.nan]]
vitalsGraphs.plot(pd.DataFrame(data, columns=['heartrate', 'sysbp', 'diabp']))
Vitals Graphs Example 2
import qc.vitalsGraphs as vitalsGraphs

df = dbUtils._getVitals()
vitalsGraphs.plot(df)
Lab Measurements Graphs Example 1
import qc.labMeasurementsGraphs as labMeasurementsGraphs

data = [
    [0, 1, 2],
    [2, np.nan, 4],
    [4, 5, np.nan],
    [0, 1, 2],
    [2, 3, 4],
    [4, 5, np.nan],
    [0, 1, 2],
    [2, 3, 4],
    [4, 5, 6],
    [6, 7, np.nan]]
labMeasurementsGraphs.plot(pd.DataFrame(data, columns=['glucose', 'hemoglobin', 'anion_gap']))
Lab Measurements Graphs Example 2
import qc.labMeasurementsGraphs as labMeasurementsGraphs

df = dbUtils._getLabMeasurements()
labMeasurementsGraphs.plot(df)
Missing Data Imputation Method Comparison Example 1
import qc.missingDataImputation as missingDataImputation

df = dbUtils._getVitals()
df = df.dropna()
meanR2, medianR2, knnR2, mfR2, emR2, miR2 = missingDataImputation.compare()
print(meanR2, medianR2, knnR2, mfR2, emR2, miR2)
Missing Data Imputation Method Comparison Example 2
import qc.missingDataImputation as missingDataImputation

df = dbUtils._getLabMeasurements()
df = df.dropna()
meanR2, medianR2, knnR2, mfR2, emR2, miR2 = missingDataImputation.compare()
print(meanR2, medianR2, knnR2, mfR2, emR2, miR2)
Missing Data Imputation Example 1
import qc.missingDataImputation as missingDataImputation

df = dbUtils._getVitals()
imputedDf = missingDataImputation.impute(df, 'miss_forest')
Vitals Anomaly Graphs Example
import qc.vitalsAnomalies as vitalsAnomalies

df = dbUtils._getVitals()
vitalsAnomalies.plot(df)
Lab Measurements Anomaly Graphs Example
import qc.labMeasurementsAnomalies as labMeasurementsAnomalies

df = dbUtils._getVitals()
labMeasurementsAnomalies.plot(df)
Running the Pipeline Example
from qc.pipeline import run

data = run(source='mimic', type='demographics', graph=True, impute_missing=True)
print(data.head())

## source -> Can be one of 'mimic' or 'omop'
## type -> Can be one of 'demographics', 'vitals', 'lab_measurements'
## graph -> If true, the EDA graph will be generated
## impute_missing -> If true, missing values will be imputed based on the best imputation method for the given data
Acknowledgements


Download files
Download the file for your platform. If you're not sure which to choose, learn more about installing packages.
Source Distribution
Built Distribution
Filter files by name, interpreter, ABI, and platform.
If you're not sure about the file name format, learn more about wheel file names.
Copy a direct link to the current filters
File details
Details for the file EHRQC-0.4.tar.gz.
File metadata
- Download URL: EHRQC-0.4.tar.gz
- Upload date:
- Size: 21.7 kB
- Tags: Source
- Uploaded using Trusted Publishing? No
- Uploaded via: twine/3.8.0 pkginfo/1.8.2 readme-renderer/32.0 requests/2.27.1 requests-toolbelt/0.9.1 urllib3/1.26.8 tqdm/4.62.3 importlib-metadata/4.11.2 keyring/23.5.0 rfc3986/2.0.0 colorama/0.4.4 CPython/3.9.1
File hashes
| Algorithm | Hash digest | |
|---|---|---|
| SHA256 |
bf562c6e7d3d64e7f13cc706158bb4ba768ec46479cceed7fd64b9e80bef0467
|
|
| MD5 |
a28eef9c2c3037baf97634c0f29215bc
|
|
| BLAKE2b-256 |
fea91c3ab0ebe8bdb9209303f2a3ed046355e6ed666fa109adfaad9ef9bc65af
|
File details
Details for the file EHRQC-0.4-py3-none-any.whl.
File metadata
- Download URL: EHRQC-0.4-py3-none-any.whl
- Upload date:
- Size: 27.8 kB
- Tags: Python 3
- Uploaded using Trusted Publishing? No
- Uploaded via: twine/3.8.0 pkginfo/1.8.2 readme-renderer/32.0 requests/2.27.1 requests-toolbelt/0.9.1 urllib3/1.26.8 tqdm/4.62.3 importlib-metadata/4.11.2 keyring/23.5.0 rfc3986/2.0.0 colorama/0.4.4 CPython/3.9.1
File hashes
| Algorithm | Hash digest | |
|---|---|---|
| SHA256 |
56cc4e923403be02e595bffbb4aae866edf74a0878011661b6510374b079030e
|
|
| MD5 |
f4cb169e23c6e9aed698dee35c2ac198
|
|
| BLAKE2b-256 |
fc479eec9a21a731e4f35e861154cac13f9bcb5b325e570d3b7aa293ce2203af
|


