Package for performing QC on Electronic Health Record (EHR) data
Project description
EHRQC
Introduction
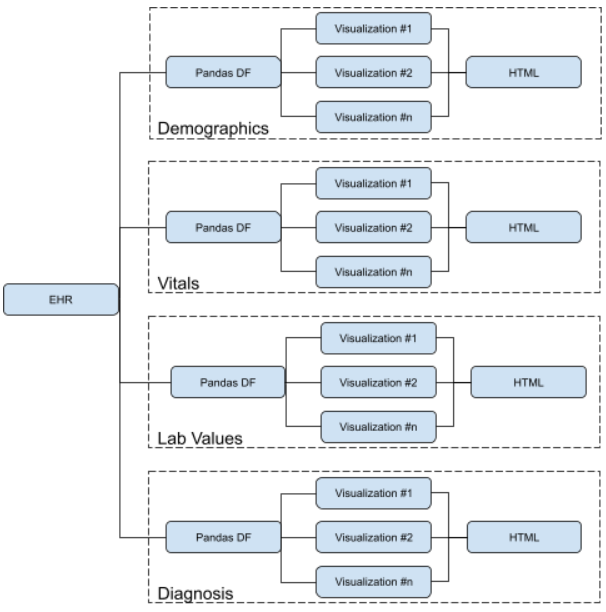
The performance of the Machine Learning (ML) models is primarily dependent on the underlying data on which it is trained on. Therefore, it is very essential to ensure that the training data is of the highest quality possible. It is a standard practice to perform operations related to handling of the missing values, and outliers before feeding it to machine learning algorithms, for which there are well established procedures and dedicated libraries currently. However, they are generic in nature and do not cover the domain specific nuances. For instance, non standard data sanity checks are to be performed in addition, to remove further errors in the Electronic Health Records (EHRs) that are specific to the medical domain. This utility is aimed at providing functions that can summarize the errors that are specific to the healthcare domain in the data through various visualizations.
System architecture
Example Output
Refer demographics.html, vitals.html, lab_measurements.html, vitals_anomalies.html, and lab_measurements_anomalies.html
User Guide
Demographics Graphs Example 1
import qc.demographicsGraphs as demographicsGraphs

data = [
    [0, 1, 2, 'male', 'white', date.fromisoformat('2020-09-13'), date.fromisoformat('2021-09-13')],
    [2, 3, 4, np.nan, 'white', date.fromisoformat('2020-09-14'), date.fromisoformat('2021-09-13')],
    [4, 5, 6, 'female', 'black', date.fromisoformat('2020-09-15'), date.fromisoformat('2021-09-13')],
    [6, 7, 8, np.nan, 'asian', date.fromisoformat('2020-09-14'), date.fromisoformat('2021-09-13')]]
demographicsGraphs.plot(pd.DataFrame(data, columns=['age', 'weight', 'height', 'gender', 'ethnicity', 'dob', 'dod']))
Demographics Graphs Example 2
import qc.demographicsGraphs as demographicsGraphs

df = dbUtils._getDemographics()
demographicsGraphs.plot(df)
Vitals Graphs Example 1
import qc.vitalsGraphs as vitalsGraphs

data = [
    [0, 1, 2],
    [2, np.nan, 4],
    [4, 5, np.nan],
    [0, 1, 2],
    [2, 3, 4],
    [4, 5, np.nan],
    [0, 1, 2],
    [2, 3, 4],
    [4, 5, 6],
    [6, 7, np.nan]]
vitalsGraphs.plot(pd.DataFrame(data, columns=['heartrate', 'sysbp', 'diabp']))
Vitals Graphs Example 2
import qc.vitalsGraphs as vitalsGraphs

df = dbUtils._getVitals()
vitalsGraphs.plot(df)
Lab Measurements Graphs Example 1
import qc.labMeasurementsGraphs as labMeasurementsGraphs

data = [
    [0, 1, 2],
    [2, np.nan, 4],
    [4, 5, np.nan],
    [0, 1, 2],
    [2, 3, 4],
    [4, 5, np.nan],
    [0, 1, 2],
    [2, 3, 4],
    [4, 5, 6],
    [6, 7, np.nan]]
labMeasurementsGraphs.plot(pd.DataFrame(data, columns=['glucose', 'hemoglobin', 'anion_gap']))
Lab Measurements Graphs Example 2
import qc.labMeasurementsGraphs as labMeasurementsGraphs

df = dbUtils._getLabMeasurements()
labMeasurementsGraphs.plot(df)
Missing Data Imputation Method Comparison Example 1
import qc.missingDataImputation as missingDataImputation

df = dbUtils._getVitals()
df = df.dropna()
meanR2, medianR2, knnR2, mfR2, emR2, miR2 = missingDataImputation.compare()
print(meanR2, medianR2, knnR2, mfR2, emR2, miR2)
Missing Data Imputation Method Comparison Example 2
import qc.missingDataImputation as missingDataImputation

df = dbUtils._getLabMeasurements()
df = df.dropna()
meanR2, medianR2, knnR2, mfR2, emR2, miR2 = missingDataImputation.compare()
print(meanR2, medianR2, knnR2, mfR2, emR2, miR2)
Missing Data Imputation Example 1
import qc.missingDataImputation as missingDataImputation

df = dbUtils._getVitals()
imputedDf = missingDataImputation.impute(df, 'miss_forest')
Vitals Anomaly Graphs Example
import qc.vitalsAnomalies as vitalsAnomalies

df = dbUtils._getVitals()
vitalsAnomalies.plot(df)
Lab Measurements Anomaly Graphs Example
import qc.labMeasurementsAnomalies as labMeasurementsAnomalies

df = dbUtils._getVitals()
labMeasurementsAnomalies.plot(df)
Project details
Download files
Download the file for your platform. If you're not sure which to choose, learn more about installing packages.


