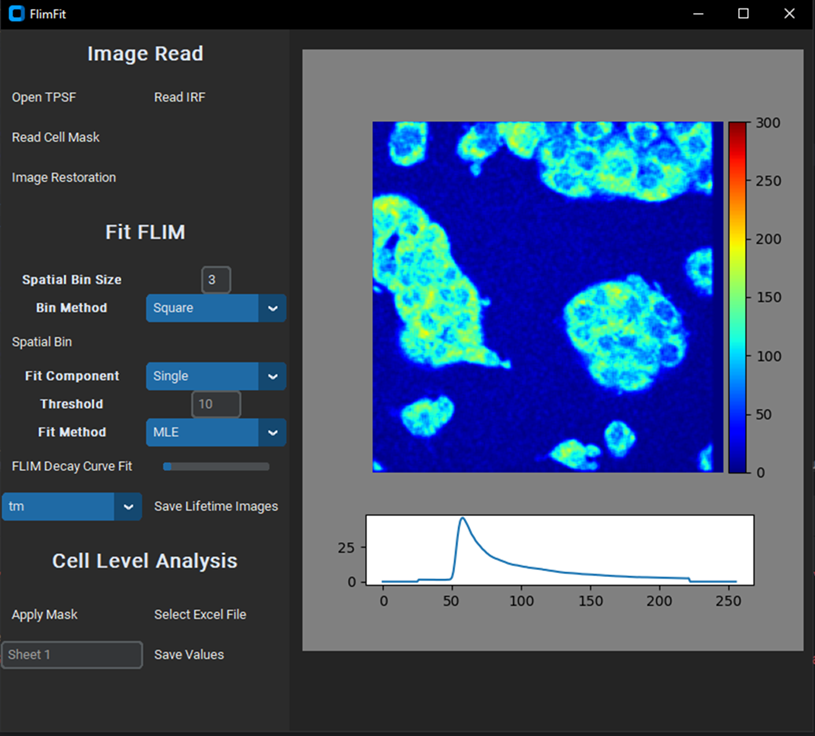
This GUI performs fluorescence lifetime decay analysis at cellular level.
Project description
Introduction
This Python code GUI aims to fit the fluorescence lifetime decay images and calculate the lifetime metrics of each cell. FLIMFit was written by Linghao Hu. To learn about the principles of FLIMfit, please refer to the book [W. Becker, The bh TCSPC Handbook]. Please see the install instructions below, and also check out the details for more information in github.
GUI:
Installation:
pip install FLIM-fit
System requirements:
Windows
Dependencies:
FLIMfit relies on the following excellent packages (which are automatically installed with conda/pip if missing): • customtkinter • numpy • pandas • scikit-learn • CTkMessagebox • scipy • sdtfile
Run Flimfit locally:
The quickest way to start is to open the GUI from a command line terminal. You might need to open an anaconda prompt if you did not add anaconda to the path: python -m flimfit
Step-by-step demo
- Download this folder of Test images and unzip it. These are a subset of the test images.
- Start the GUI with Python -m Flimfit.
Image Read:
- Open a temporal point spread function (TPSF) image (X x Y x T, 256 x 256 x 256 (12.5ns)) from the folder with the OPEN TPSF button. The format can be .asc file (generated from SPCImage software (Becker & Hickl) -> Export -> Decay Traces) or .sdt file (generated from SPCM64(Becker & Hickl)).
- Read the instrument response function (IRF) with the READ IRF button. The instrument response function file should be .txt file, with 256 rows, and each row represents the photon number in the corresponding time point, see the example test IRF image. The IRF file can be generated by copying an IRF function from SPCImage software, and pasting into a notepad.
- Optional: Click the IMAGE RESTORATION to enhance the TPSF image if the photon number is few for decay fitting. The image restoration is achieved by a 3D generative adversarial network trained with simulated images. This idea comes from the paper [Chen, YI., Chang, YJ., Liao, SC. et al. Commun Biol 5, 18 (2022). https://doi.org/10.1038/s42003-021-02938-w], and the details of the simulated images and the GAN model can be obtained from link.
Fit FLIM:
- Define the SPATIAL BIN SIZE and BIN METHOD, and click the SPATIAL BIN button to do spatial binning. Note: the cell binning method option can only be selected when already inputting a cell mask. Binning is performed by combining the decay data from a defined binning area and assigning the net decay curve to the central pixel. ‘Bin size’ defines the number of pixels including the current pixel position. ‘Bin method’ defines the shape of the bin area.
- Define the FITTING COMPONENT, THRESHOLD, and FITTING METHOD and click the FLIM DECAY CURVE FIT button to achieve fluorescence lifetime analysis of the TPSF images. The deconvolution with the IRF and exponential fitting will be applied to each pixel.
single-component decay function:
Bi-component decay function:
- Pixels with the photon number at the peak lower than the threshold are ignored. Three fitting methods: LSQ: Least-square. The outputted α1(%), and α2(%) are calculated by normalizing with the sum of α1 and α2 LSQN: Normalization of the actual decay curve to 0 to 1 before implementing least-square curve fitting, so it outputs α1(%), and α2(%) directly. MLE: Maximum likelihood estimation. MLE calculates the probability that a particular value of n appears in a particular time channel with the Poisson distribution.
For the photon number at each time point, the k is the fitted photon number, and λ is the actual photon number. Then it optimizes model parameters until the sum of probabilities is at maximum. Finally, the outputted α1(%), and α2(%) are calculated by normalizing with the sum of α1 and α2.
- Once fitting is done, Choose the option menu to visualize different FLIM images. Click the SAVE LIFETIME IMAGES to save all the FLIM output matrices as .tif images. Cell Level Analysis (Only applicable for two-component decay fitting)
- Input a cell mask with the READ CELL MASK Button.
- Calculate the average fluorescence lifetime values within cellular regions by clicking APPLY MASK.
- Choose an Excel file to save the calculated lifetime values of each cell (SELECT EXCEL FILE).
- Input the SHEET NAME you want to write the values and click the save values button. (The values will be saved in the excel-sheet, in which each row represents each number, and each column for different lifetime metrics)
Project details
Download files
Download the file for your platform. If you're not sure which to choose, learn more about installing packages.


