Panel for the Flask Debug toolbar to capture and view line-by-line profiling stats

Project description
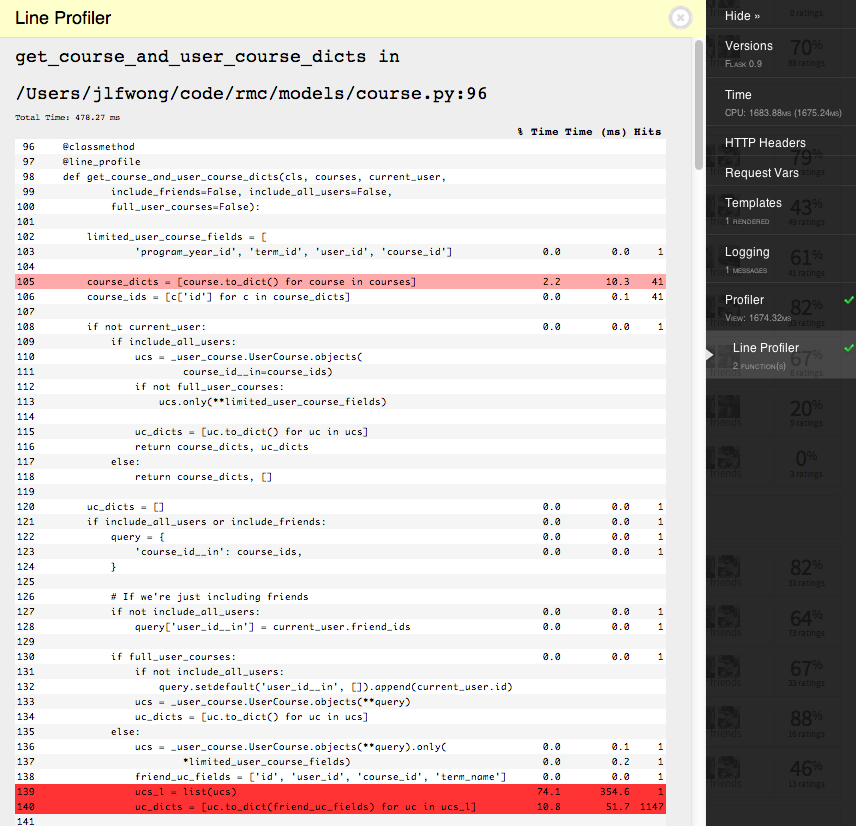
This is a panel for flask_debugtoolbar which enables the ability to view line profiling information from selected functions.
The line profile information comes from the line_profiler module, but you don’t need to worry about that.
Installation
First, you need to get the package. Install it with pip:
pip install flask-debugtoolbar-lineprofilerpanel
Somewhere after you’ve set app.debug = True and before app.run, you need to specify the flask_debugtoolbar panels that you want to use and include 'flask_debugtoolbar_lineprofilerpanel.panels.LineProfilerPanel' in that list.
For example, here’s a small flask app with the panel installed and with line profiling enabled for the hello_world:
from flask import Flask
app = Flask(__name__)

import flask_debugtoolbar

from flask_debugtoolbar_lineprofilerpanel.profile import line_profile

@app.route('/')
@line_profile
def hello_world():
    return flask.render_template('hello_world.html')

if __name__ == '__main__':
    app.debug = True

    # Specify the debug panels you want
    app.config['DEBUG_TB_PANELS'] = [
        'flask_debugtoolbar.panels.versions.VersionDebugPanel',
        'flask_debugtoolbar.panels.timer.TimerDebugPanel',
        'flask_debugtoolbar.panels.headers.HeaderDebugPanel',
        'flask_debugtoolbar.panels.request_vars.RequestVarsDebugPanel',
        'flask_debugtoolbar.panels.template.TemplateDebugPanel',
        'flask_debugtoolbar.panels.sqlalchemy.SQLAlchemyDebugPanel',
        'flask_debugtoolbar.panels.logger.LoggingPanel',
        'flask_debugtoolbar.panels.profiler.ProfilerDebugPanel',
        # Add the line profiling
        'flask_debugtoolbar_lineprofilerpanel.panels.LineProfilerPanel'
    ]
    toolbar = flask_debugtoolbar.DebugToolbarExtension(app)

    app.run()
Usage
Unlike the regular profile panel that comes with flask_debugtoolbar, the line profiler will only profile functions you specifically tell it to. You can either use it as a decorator or directly as a function.
from flask_debugtoolbar_lineprofilerpanel.profile import line_profile

# Using it as a decorator
@app.route('/profile')
@line_profile
def profile_page():
    ...
    return flask.render_template('profile_page')

# Explicit argument
line_profile(some_function)
Note that if I had done line_profile(profile_page) in the example above, it would’ve profiled the wrapper created by app.route. In general, you probably just want to use line_profile as a decorator.
Also note that the following will profile the decorator wrapper, not the inner function.
# Using it incorrectly as a decorator
@line_profile
@app.route('/profile')
def profile_page():
    ...
    return flask.render_template('profile_page')
Always use @line_profile as the inner-most decorator.
Using line_profiler with the Google AppEngine SDK
line_profiler is implemented as a C extension. Unfortunately, AppEngine does not support C extensions in the cloud, and dev_appserver simulates this restriction on your local machine. If you’d like to use line_profiler on your local machine, you can monkey-patch the AppEngine SDK to permit it. The Flask-DebugToolbar will make sure this plugin is disabled in production (it will catch any ImportErrors and disable the affected panel).
Simply open application/__init__.py, which should look something like this:
from __future__ import absolute_import

from flask import Flask

app = Flask('application')
app.config.from_object('application.settings')

if app.config['DEBUG']:
    from werkzeug.debug import DebuggedApplication

    app.wsgi_app = DebuggedApplication(app.wsgi_app, evalex=True)


    from flask.ext.debugtoolbar import DebugToolbarExtension

    toolbar = DebugToolbarExtension(app)


import application.urls
and insert the monkey-patch, like so:
from __future__ import absolute_import

from flask import Flask

app = Flask('application')
app.config.from_object('application.settings')

if app.config['DEBUG']:
    from werkzeug.debug import DebuggedApplication

    app.wsgi_app = DebuggedApplication(app.wsgi_app, evalex=True)


    # We can't use LineProfiler in production because it requires a C-extension,
    # but we can monkey-patch it in here for use on the dev server:
    try:
        import os, sys, re

        if 'SERVER_SOFTWARE' in os.environ and os.environ['SERVER_SOFTWARE'].startswith('Dev'):
            # white-list the line_profiler C extension
            sys.meta_path[3]._enabled_regexes.append(re.compile(r'.*line_profiler.*'))

            from flask_debugtoolbar_lineprofilerpanel.profile import line_profile


            ## import the methods you want to profile here, and whitelist them with line_profile:
            #from application.views import YourViewClass
            #
            #line_profile(YourViewClass.the_method_you_want_to_profile)
            #line_profile(YourViewClass.another_method_you_want_to_profile)
    except:
        pass


    # Make sure the monkey-patch is applied before you instantiate the DebugToolbarExtension.
    from flask.ext.debugtoolbar import DebugToolbarExtension

    toolbar = DebugToolbarExtension(app)


import application.urls
1.0.1 (2013-11-12)
- Make it >= 1.0.0 so the –pre flag isn’t needed to install the package
(it’s 1.0.1 instead of 1.0.0 because I’m bad at things)
Specify version 1.0b3 of line-profiler to make the install work
0.0.6 (2012-11-13)
No longer polluting the template namespace
Show all lines, not just those with profiling information
0.0.5 (2012-11-13)
Table output, ditch the default output given by LineProfiler.print_stats()
Usage instructions in the panel
0.0.1 (2012-11-12)
Got it “working”
Super Ugly


Download files
Download the file for your platform. If you're not sure which to choose, learn more about installing packages.
Source Distribution
File details
Details for the file Flask-DebugToolbar-LineProfilerPanel-1.0.1.tar.gz.
File metadata
- Download URL: Flask-DebugToolbar-LineProfilerPanel-1.0.1.tar.gz
- Upload date:
- Size: 5.4 kB
- Tags: Source
- Uploaded using Trusted Publishing? No
File hashes
| Algorithm | Hash digest | |
|---|---|---|
| SHA256 |
90e5adafb38493c6b782f4568fef4e50682d65a369ace6dd815883407070a930
|
|
| MD5 |
98cf5d8a955e485e362c6c075c95b95c
|
|
| BLAKE2b-256 |
542ed9d61d84a9992f10f9fb0b1837260f8b3ebce4d6eecac3c3a64f90ef8dba
|


