
Fetch geotagged tweets by geographic radius via the X API v2.
Verified details
These details have been verified by PyPIProject links
GitHub Statistics
Maintainers

Project description
GeoSocialX




GeoSocialX is a Python package designed to make geospatial analysis of tweets easier. Whether you are a social scientist, a data analyst, or just someone curious about the geospatial patterns of tweets, GeoSocialX is for you.
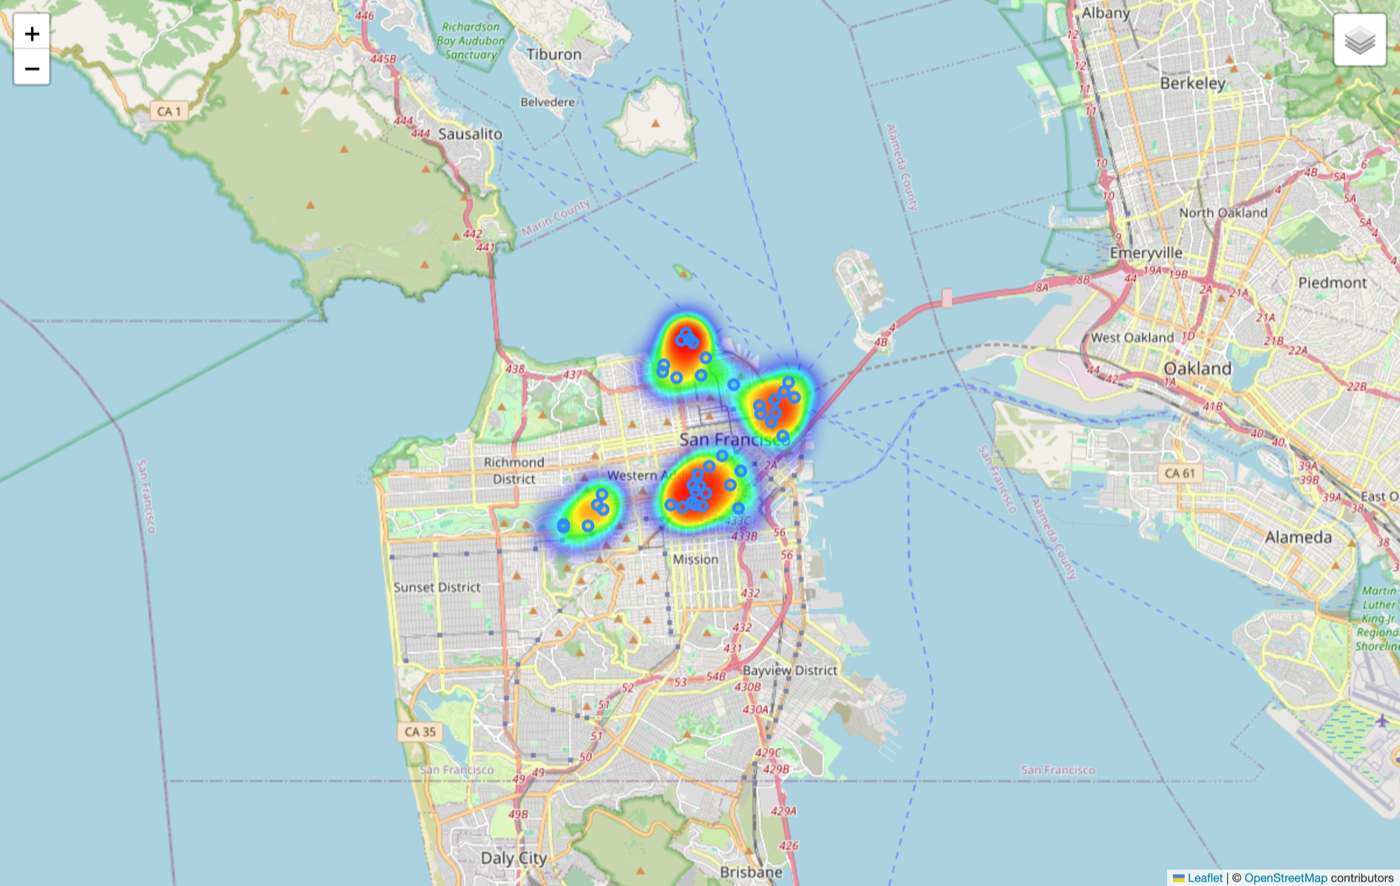
Example output: a density heatmap of geotagged posts across San Francisco (from the bundled sample data), rendered with MapVisualizer.to_html_map. See the Quickstart to reproduce it.
Overview
GeoSocialX bridges social media data and geospatial analysis. It provides a convenient wrapper around the X API v2 (via Tweepy) for fetching geotagged tweets within a geographic area and saving them for further analysis.
Project status: Alpha (0.3.0). The full pipeline — fetch, extract, analyze, visualize — is implemented. Fetching targets the X API v2 recent-search endpoint, which requires a paid X API tier (Basic or higher); the free tier does not include tweet search. The extraction, analysis, and GeoJSON steps are dependency-free; interactive maps use the optional
foliumextra.
Features
- X API v2 integration: Fetch recent tweets within a geographic area (latitude, longitude, and radius) using the
point_radiussearch operator. The geocode is validated locally, so out-of-range coordinates or an over-cap radius fail fast instead of wasting a paid API call. - Simple persistence: Save fetched tweets to a newline-delimited JSON file for downstream processing.
- Geospatial extraction: Pull exact
(longitude, latitude)points out of v2 tweet dicts, with a coverage report showing how many tweets carried exact coordinates vs. only a place reference. Place-only tweets can optionally be resolved to their place's bounding-box centroid, and every point records itssource("exact"or"place"). - Geospatial analysis: Bounding box, centroid, great-circle (haversine) distances, radius filtering, and a lightweight grid-based hotspot finder — all pure standard library.
- Visualization: Export points to GeoJSON (standard library) or render an interactive Leaflet map with markers and a density heatmap (optional
foliumextra).
Geo coverage caveat:
point_radiusonly matches tweets that carry geo data, and the radius is capped at 25 mi / 40 km. Only a small fraction of tweets are geotagged with exact coordinates, so results are far sparser than a naïve keyword search — resolvingplace_idreferences (see below) recovers a coarser but much larger share.
Requirements
- Python 3.10 or higher
- An X Developer account on a paid tier (Basic or higher) — recent search is not available on the free tier
- An X API bearer token (app-only auth is sufficient for recent search)
Dependencies
Declared in pyproject.toml:
tweepy>=4.10— X API v2 client
Optional extras:
example—python-dotenv, to load credentials from a.envfile (pip install "geosocialx[example]").maps—folium, to render interactive Leaflet maps (pip install "geosocialx[maps]"). Not needed for GeoJSON export.test—coverage, for running the suite with coverage measurement (pip install "geosocialx[test]").
Installation
From PyPI
GeoSocialX is published on PyPI under the distribution name geosocialx (the import name is geosocialx too):
pip install geosocialx
With optional extras (comma-separated):
pip install "geosocialx[example,maps,test]"
From source
git clone https://github.com/JayeshSuryavanshi/GeoSocialX.git
cd GeoSocialX
pip install .           # or:  pip install ".[example,maps,test]"
Quickstart
The analysis half needs no API key — point it at any newline-delimited dump of X API v2 tweets and explore where (and when) they happened:
from geosocialx import GeospatialExtractor, GeospatialAnalyzer, MapVisualizer

ex = GeospatialExtractor()
tweets = ex.load_tweets("tweets.json")
print(ex.coverage(tweets))  # how much of the data is geotagged

points = ex.extract_points(tweets)  # (lon, lat) points; place-only tweets included
analyzer = GeospatialAnalyzer(points)
print(analyzer.summary())  # count, bounding box, centroid, span_km, time range
print(analyzer.densest_cells(top=3))  # busiest ~1 km grid cells (hotspots)
print(analyzer.time_bins("day"))  # activity over time, e.g. {'2024-01-01': 12}

MapVisualizer(points).save_geojson("tweets.geojson")  # open in any GIS or geojson.io
No data on hand? A complete, runnable offline demo on a bundled sample is in examples/analyze.py.
To fetch your own geotagged tweets (needs an X API bearer token on a paid tier — see Configuration):
from geosocialx import XDataFetcher

fetcher = XDataFetcher(bearer_token="YOUR_BEARER_TOKEN")
tweets = fetcher.fetch_tweets("37.7749,-122.4194,10mi", count=100)  # 10 mi around SF
fetcher.save_tweets_to_file(tweets, "tweets.json")
…or straight from the shell:
geosocialx --geocode "37.7749,-122.4194,10mi" --count 100 --output tweets.json
Configuration
GeoSocialX needs an X API bearer token, read from the X_BEARER_TOKEN environment variable (loaded from a .env file when the example extra is installed):
X_BEARER_TOKEN=your_bearer_token
Note:
.envis git-ignored. Never commit real credentials. The legacyTWITTER_BEARER_TOKENvariable is still read as a fallback.
XDataFetcher can also authenticate in user context with the four OAuth 1.0a credentials (api_key, api_key_secret, access_token, access_token_secret) passed as keyword arguments, but app-only bearer-token auth is the simplest path for recent search. (TwitterDataFetcher remains as a deprecated alias of XDataFetcher.)
Usage
Command line
Installing the package registers a geosocialx console command:
geosocialx --geocode "37.7749,-122.4194,10mi" --count 100 --output tweets.json
This writes the fetched tweets to tweets.json (one JSON object per line) and, when any tweets reference a place, the collected place bounding boxes to tweets.json.places.json. The same entry point is available as python main.py (run either with --help for all options).
Programmatic
from geosocialx import XDataFetcher

fetcher = XDataFetcher(bearer_token="your_bearer_token")

# Fetch up to 100 tweets within 10 miles of San Francisco.
tweets = fetcher.fetch_tweets("37.7749,-122.4194,10mi", count=100)
if tweets is not None:  # None means the API/network call failed
    fetcher.save_tweets_to_file(tweets, "tweets.json")
    fetcher.save_places_to_file("tweets.json.places.json")  # place bboxes, if any
fetch_tweets returns None (and logs the error) if the call fails, so guard with if tweets is not None. save_tweets_to_file raises ValueError if handed None, so it never truncates an existing file on a failed fetch.
Analyze and visualize saved tweets
Once you have a tweets.json (from the step above, or any newline-delimited v2 tweet dump), the rest of the pipeline is offline and needs no API access:
from geosocialx import GeospatialExtractor, GeospatialAnalyzer, MapVisualizer

extractor = GeospatialExtractor()
tweets = extractor.load_tweets("tweets.json")
print(extractor.coverage(tweets))  # e.g. {'total': 100, 'with_point': 12, ...}

# Pass a {place_id: bbox} map (from save_places_to_file) to also resolve
# place-only tweets to their bounding-box centroid; omit it for exact points only.
places = extractor.load_places("tweets.json.places.json")
points = extractor.extract_points(tweets, places=places)

analyzer = GeospatialAnalyzer(points)
print(analyzer.summary())  # count, bounding_box, centroid, span_km
print(analyzer.densest_cells(top=3))  # busiest grid cells

viz = MapVisualizer(points)
viz.save_geojson("tweets.geojson")  # standard library, always available
viz.to_html_map("tweets_map.html")  # interactive map — needs the `maps` extra
A complete, offline version of this that needs no API access or paid tier is in examples/analyze.py; it runs against a committed sample dump:
python examples/analyze.py
Key Modules & Functions
geosocialx.data_fetcher
XDataFetcher(bearer_token=None, *, api_key=None, api_key_secret=None, access_token=None, access_token_secret=None, wait_on_rate_limit=True)
Builds a Tweepy v2 Client. Pass a bearer_token for app-only auth, or all four OAuth 1.0a credentials as keyword arguments for user-context auth. Raises ValueError if neither is provided. By default it waits out rate limits (429s); pass wait_on_rate_limit=False to fail fast instead.
fetch_tweets(geocode, count=100, extra_query="-is:retweet", tweet_fields=(...), start_time=None, end_time=None)— Returns alistof tweet dicts within the given area, orNone(logging the error) if the API call or network transport fails.geocodeis"latitude,longitude,radius"(e.g."37.7749,-122.4194,10mi", radius ≤ 25mi/40km), validated locally and translated to the v2point_radius:[longitude latitude radius]operator (note: v2 puts longitude first).start_time/end_time(datetime) optionally narrow the search inside the ~7-day recent-search window. The place bounding boxes referenced by the results are collected into theplacesattribute.save_tweets_to_file(tweets, file_name)— Writes each tweet dict as newline-delimited JSON. RaisesValueErroronNonerather than truncating the destination.save_places_to_file(file_name)— Writes the collected{place_id: bbox}map as JSON.
geosocialx.geospatial_extractor
GeospatialExtractor turns raw v2 tweet dicts into geographic points.
extract_points(tweets, places=None)— Returns a list ofGeoPoint(tweet_id, longitude, latitude, text, created_at, author_id, source)for every tweet with a usable location. Tweets with exact coordinates yieldsource="exact"; if aplacesmap is given, place-only tweets are additionally resolved to their bounding-box centroid assource="place". Malformed or out-of-range coordinates are skipped.coverage(tweets)— Returns{total, with_point, place_only, no_geo}so you can see how sparse the geo data is (with_pointcounts exactly whatextract_pointskeeps as exact points).load_tweets(path)/load_places(path)— Load the newline-delimited tweets /{place_id: bbox}map written by the fetcher.
geosocialx.geospatial_analyzer
GeospatialAnalyzer(points) computes spatial statistics with no third-party dependencies.
count(),bounding_box()→(min_lon, min_lat, max_lon, max_lat),centroid()→(lon, lat).haversine_km(lon1, lat1, lon2, lat2)— great-circle distance in km (static).points_within(lon, lat, radius_km)— points inside a radius.densest_cells(cell_size_deg=0.01, top=5)— busiest grid cells. Cells are equal in degrees, not equal in area (~1.1 km tall but ~1.1·cos(lat) km wide at0.01°), so it is a within-city hotspot heuristic, not a cross-latitude density estimate.time_bins(freq="day"|"hour")— bucket points by theircreated_attimestamp as{bucket: count}(ordered by bucket), skipping any point without a parseable timestamp.summary()—count,bounding_box,centroid, bbox diagonalspan_km, andearliest/latest(UTC ISO-8601) when the points carry timestamps.
geosocialx.data_visualization
MapVisualizer(points) renders points to disk.
to_geojson()/save_geojson(path)— a GeoJSONFeatureCollection(standard library only; each feature carries the point'ssource).to_html_map(path, zoom_start=12, heatmap=True)— an interactive Leaflet map with markers and an optional heatmap layer. Requires themapsextra (folium); raisesImportErrorwith an install hint if it is missing.
Running the tests
The test suite is network-free (Tweepy is mocked):
python -m unittest discover -s tests
With coverage (install the test extra first) and the folium-backed map tests exercised (install the maps extra):
pip install ".[maps,test]"
coverage run -m unittest discover -s tests
coverage report
Project Structure
GeoSocialX/
├── geosocialx/
│   ├── __init__.py              # exports the pipeline classes + __version__
│   ├── data_fetcher.py          # XDataFetcher (X API v2)
│   ├── geospatial_extractor.py  # GeospatialExtractor, GeoPoint
│   ├── geospatial_analyzer.py   # GeospatialAnalyzer (pure stdlib)
│   ├── data_visualization.py    # MapVisualizer (GeoJSON + optional folium)
│   ├── cli.py                   # `geosocialx` console entry point
│   └── py.typed                 # PEP 561 marker (ships the type hints)
├── examples/
│   ├── analyze.py               # offline analyze/visualize demo
│   ├── sample_tweets.json       # committed sample dump
│   └── sample_places.json       # committed sample place bboxes
├── tests/                       # network-free unit tests
├── .github/workflows/ci.yml     # test matrix (3.10–3.13) + lint
├── main.py                      # thin shim over geosocialx.cli
├── pyproject.toml
└── README.md
License
Released under the MIT License (see the LICENSE file).
Author
Jayesh Kishor Suryavanshi
Project details
Verified details
These details have been verified by PyPIProject links
GitHub Statistics
Maintainers


Download files
Download the file for your platform. If you're not sure which to choose, learn more about installing packages.
Source Distribution
Built Distribution
Filter files by name, interpreter, ABI, and platform.
If you're not sure about the file name format, learn more about wheel file names.
Copy a direct link to the current filters






