Generator of random mandalas.
Project description
Random Mandala Python package
Anton Antonov
Python-packages at GitHub/antononcube
November 2021
February 2022
Introduction
This Python package implements the function random_mandala that generates plots (and images) of random mandalas.
The design, implementation strategy, and unit tests closely resemble the Wolfram Repository Function (WFR)
RandomMandala,
[AAf1].
(Another, very similar function at WFR is
RandomScribble, [AAf2].)
The Bezier mandala seeds are created using the Python package
bezier,
[DHp1].
For detailed descriptions of Machine Learning studies that use collections of random mandalas see the articles [AA1, AA2].
Installation
To install from GitHub use the shell command:
python -m pip install git+https://github.com/antononcube/Python-packages.git#egg=RandomMandala\&subdirectory=RandomMandala
To install from PyPI:
python -m pip install RandomMandala
Details and arguments
-
The mandalas made by
random_mandalaare generated through rotational symmetry of a “seed segment”. -
The function
random_mandalareturnsmatplotlibfigures (objects of typematplotlib.figure.Figure) -
The function
random_mandalacan be given arguments of the creation functionmatplotlib.pyplot.figure. -
If
n_rowsandn_columnsareNoneamatplotlibfigure object with one axes object is returned. -
There are two modes of making random mandalas: (i) single-mandala mode and (ii) multi-mandala mode. The multi-mandala mode is activated by giving the
radiusargument a list of positive numbers. -
If the argument
radiusis a list of positive reals, then a "multi-mandala" is created with the mandalas corresponding to each number in the radius list being overlain. -
Here are brief descriptions of the arguments:
-
n_rows: Number of rows in the result figure. -
n_columns: Number of columns in the result figure. -
radius: Radius for the mandalas, a flot or a list of floats. If a list of floats the mandalas are overlain. -
rotational_symmetry_order: Number of copies of the seed segment that comprise the mandala. -
connecting_function: Connecting function, one of "line", "fill", "bezier", "bezier_fill", "random", orNone. If 'random' orNonea random choice of the rest of values is made. -
number_of_elements: Controls how may graphics elements are in the seed segment. -
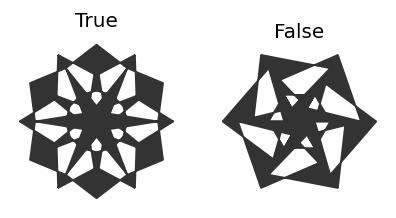
symmetric_seed: Specifies should the seed segment be symmetric or not. If 'random' of None random choice betweenTrueandFalseis made. -
face_color: Face (fill) color. -
edge_color: Edge (line) color.
-
Examples
Load the package RandomMandala, matplotlib, and PIL:
from RandomMandala import random_mandala, figure_to_image
import matplotlib
import matplotlib.pyplot as plt
import matplotlib.cm
from PIL import Image, ImageOps
from mpl_toolkits.axes_grid1 import ImageGrid
import random
Here we generate a random mandala:
random.seed(99)
fig = random_mandala()
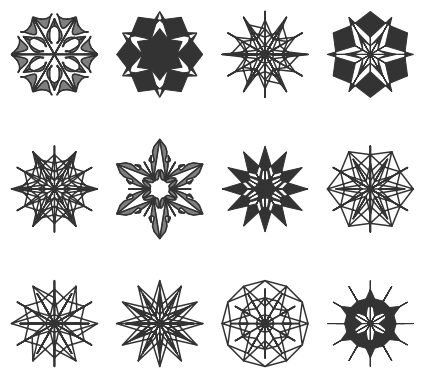
Here we generate a figure with 12 (3x4) random mandalas:
random.seed(33)
fig2 = random_mandala(n_rows=3, n_columns=4, figsize=(6,6))
fig2.tight_layout()
plt.show()
Arguments details
n_rows, n_columns
With the argument n_rows and n_columns are specified the number of rows and columns respectively in the figure object; n_rows * n_columns mandalas are generated:
random.seed(22)
fig=random_mandala(n_rows=1, n_columns=3)
connecting_function
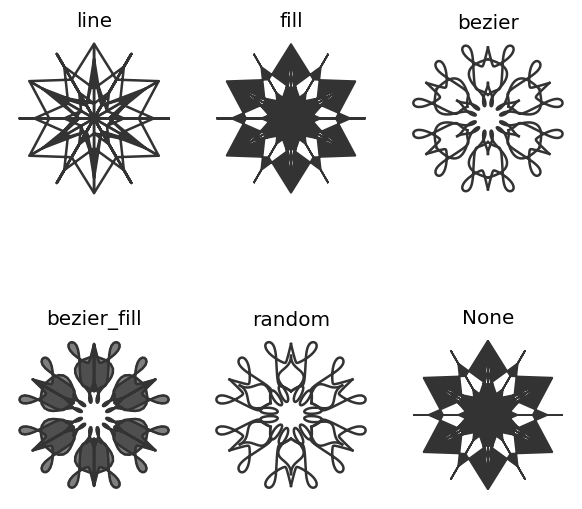
The argument connecting_function specifies which graphics primitives to be used over the seed segment points:
fig = matplotlib.pyplot.figure(figsize=(6, 6), dpi=120)

k = 1
for cf in ['line', 'fill', 'bezier', 'bezier_fill', 'random', None]:
    random.seed(667)
    fig = random_mandala(connecting_function=cf,
                         figure=fig,
                         location=(2, 3, k))
    ax = fig.axes[-1]
    ax.set_title(str(cf))
    k = k + 1
plt.show()
plt.close(fig)
With values None or "random" a random choice is made from ['line', 'fill', 'bezier', 'bezier_fill'].
radius
In single-mandala mode the argument radius specifies the radius of the seed segment and the mandala:
fig = matplotlib.pyplot.figure(figsize=(8, 4), dpi=120)
k = 1
for r in [5, 10, 15, 20]:
    random.seed(2)
    fig = random_mandala(connecting_function="line",
                         radius=r,
                         figure = fig,
                         location = (1, 4, k))
    ax = fig.axes[-1]
    ax.set_title("radius:" + str(r))
    ax.axis("on")
    k = k + 1
plt.show()
plt.close(fig)
If the value given to radius is a list of positive numbers then multi-mandala mode is used.
If radius=[r[0],...,r[k]], then for each r[i] is made a mandala with radius r[i] and the mandalas are drawn upon each other according to their radii order:
random.seed(99)
fig3=random_mandala(radius=[8,5,3],
                    face_color=["blue", "green", 'red'],
                    connecting_function="fill")
Remark: The code above used different colors for the different radii.
rotational_symmetry_order
The argument rotational_symmetry_order specifies how many copies of the seed segment comprise the mandala:
fig = matplotlib.pyplot.figure(figsize=(6, 12), dpi=120)
k = 1
for rso in [2, 3, 4, 6]:
    random.seed(122)
    fig = random_mandala(connecting_function="fill",
                         symmetric_seed=True,
                         rotational_symmetry_order=rso,
                         figure = fig,
                         location = (1, 4, k))
    ax = fig.axes[-1]
    ax.set_title("order:" + str(rso))
    k = k + 1
plt.show()
plt.close(fig)
number_of_elements
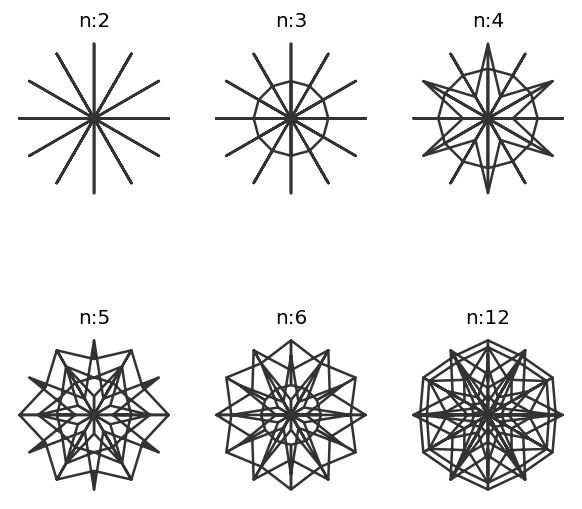
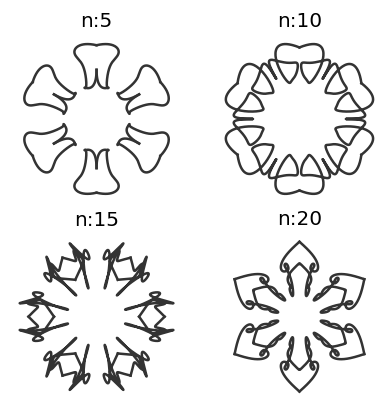
The argument number_of_elements controls how may graphics elements are in the seed segment:
fig = matplotlib.pyplot.figure(figsize=(6, 6), dpi=120)
k = 1
for ne in [2, 3, 4, 5, 6, 12]:
    random.seed(2)
    fig = random_mandala(connecting_function="line",
                         symmetric_seed=True,
                         rotationa_symmetry_order=6,
                         number_of_elements=ne,
                         figure = fig,
                         location = (2, 3, k))
    ax = fig.axes[-1]
    ax.set_title("n:" + str(ne))
    k = k + 1
plt.show()
plt.close(fig)
fig = matplotlib.pyplot.figure(figsize=(4, 4), dpi=120)
k = 1
for ne in [5, 10, 15, 20]:
    random.seed(26)
    fig = random_mandala(connecting_function="bezier",
                         radius=[1],
                         symmetric_seed=True,
                         rotationa_symmetry_order=6,
                         number_of_elements=ne,
                         figure = fig,
                         location = (2, 2, k))
    ax = fig.axes[-1]
    ax.set_title("n:" + str(ne))
    k = k + 1
plt.show()
plt.close(fig)
symmetric_seed
The argument symmetric_seed specifies should the seed segment be symmetric or not:
fig = matplotlib.pyplot.figure(figsize=(4, 4), dpi=120)
k = 1
for ssd in [True, False]:
    random.seed(2)
    fig = random_mandala(connecting_function="fill",
                         symmetric_seed=ssd,
                         figure = fig,
                         location = (1, 2, k))
    ax = fig.axes[-1]
    ax.set_title(str(ssd))
    k = k + 1
plt.show()
plt.close(fig)
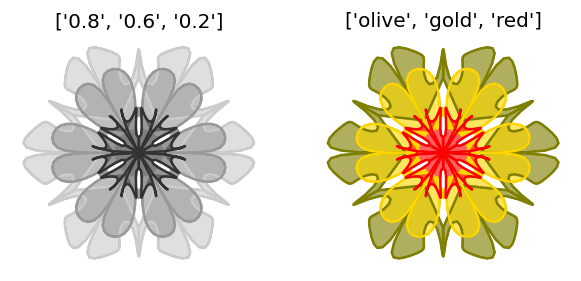
face_color and edge_color
The arguments face_color and edge_color take as values strings or list of strings that specify the coloring of the filled-in polygons and lines respectively:
fig = matplotlib.pyplot.figure(figsize=(6,3), dpi=120)
k = 1
for fc in [["0.8", "0.6", "0.2"], ["olive", "gold", "red"]]:
    random.seed(11)
    fig = random_mandala(radius=[10,6,4],
     					 connecting_function="bezier_fill",
                         symmetric_seed=True,
                         face_color=fc,
                         figure = fig,
                         location = (1, 2, k))
    ax = fig.axes[-1]
    ax.set_title(str(fc))
    k = k + 1

plt.show()
plt.close(fig)
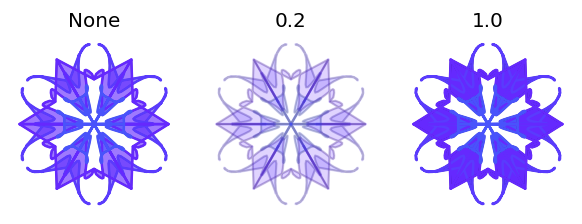
alpha
The argument alpha controls the opacity of the plots; it takes as values None and floats between 0 and 1.
fig = matplotlib.pyplot.figure(figsize=(6,3), dpi=120)
k = 1
for al in [None, 0.2, 1.0]:
    random.seed(23)
    fig = random_mandala(radius=[10,6,4],
     					 connecting_function="bezier_fill",
                         symmetric_seed=True,
                         alpha=al,
                         color_mapper=matplotlib.cm.rainbow_r,
                         figure = fig,
                         location = (1, 3, k))
    ax = fig.axes[-1]
    ax.set_title(str(al))
    k = k + 1

plt.show()
plt.close(fig)
color_mapper
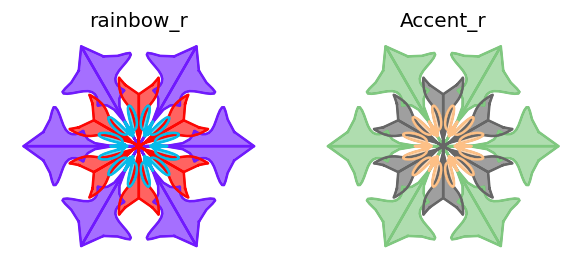
The argument color_mapper takes as values None and matplotlib.colors.Colormap objects.
See the color mappers in the reference page "color example code: colormaps_reference.py".
If color_mapper is specified then the arguments face_color and edge_color are ignored.
Here is an example using two color mappers:
fig = matplotlib.pyplot.figure(figsize=(6,3), dpi=120)
cMappers=[matplotlib.cm.rainbow_r, matplotlib.cm.Accent_r]
cMappersNames=["rainbow_r", "Accent_r"]
for k in range(2):
    random.seed(15)
    fig = random_mandala(radius=[10,6,4],
                         connecting_function="bezier_fill",
                         symmetric_seed=True,
                         color_mapper=cMappers[k],
                         figure = fig,
                         location = (1, 2, k+1))
    ax = fig.axes[-1]
    ax.set_title(cMappersNames[k])

plt.show()
plt.close(fig)
Applications
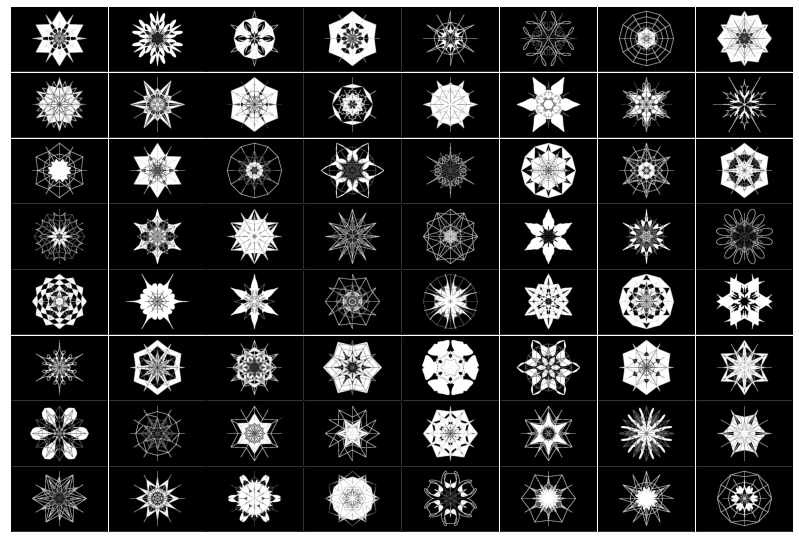
Generate a collection of images
In certain Machine Learning (ML) studies it can be useful to be able to generate large enough collections of (random) images.
In the code block below we:
- Generate 64 random mandala plots
- Convert them into
PILimages using the package functionfigure_to_image - Invert and binarize images
- Plot the images in an image grid
# A list to accumulate random mandala images
mandala_images = []

# Generation loop
random.seed(443)
for i in range(64):

    # Generate one random mandala figure
    fig2 = random_mandala(n_rows=None,
                          n_columns=None,
                          radius=[8, 6, 3],
                          rotational_symmetry_order=6,
                          symmetric_seed=True,
                          connecting_function='random',
                          face_color="0.")
    fig2.tight_layout()

    # Convert the figure into an image and add it to the list
    mandala_images = mandala_images + [figure_to_image(fig2)]

    # Close figure to save memoru
    plt.close(fig2)

# Invert image colors
mandala_images2 = [ImageOps.invert(img) for img in mandala_images]

# Binarize images
mandala_images3 = [im.convert('1') for im in mandala_images2]

# Make a grid of images and display it
fig3 = plt.figure(figsize=(14., 14.))
grid = ImageGrid(fig3, 111,
                 nrows_ncols=(8, 8),
                 axes_pad=0.02,
                 )

for ax, img in zip(grid, mandala_images3):
    ax.imshow(img)
    ax.set(xticks=[], yticks=[])

plt.show()
Neat examples
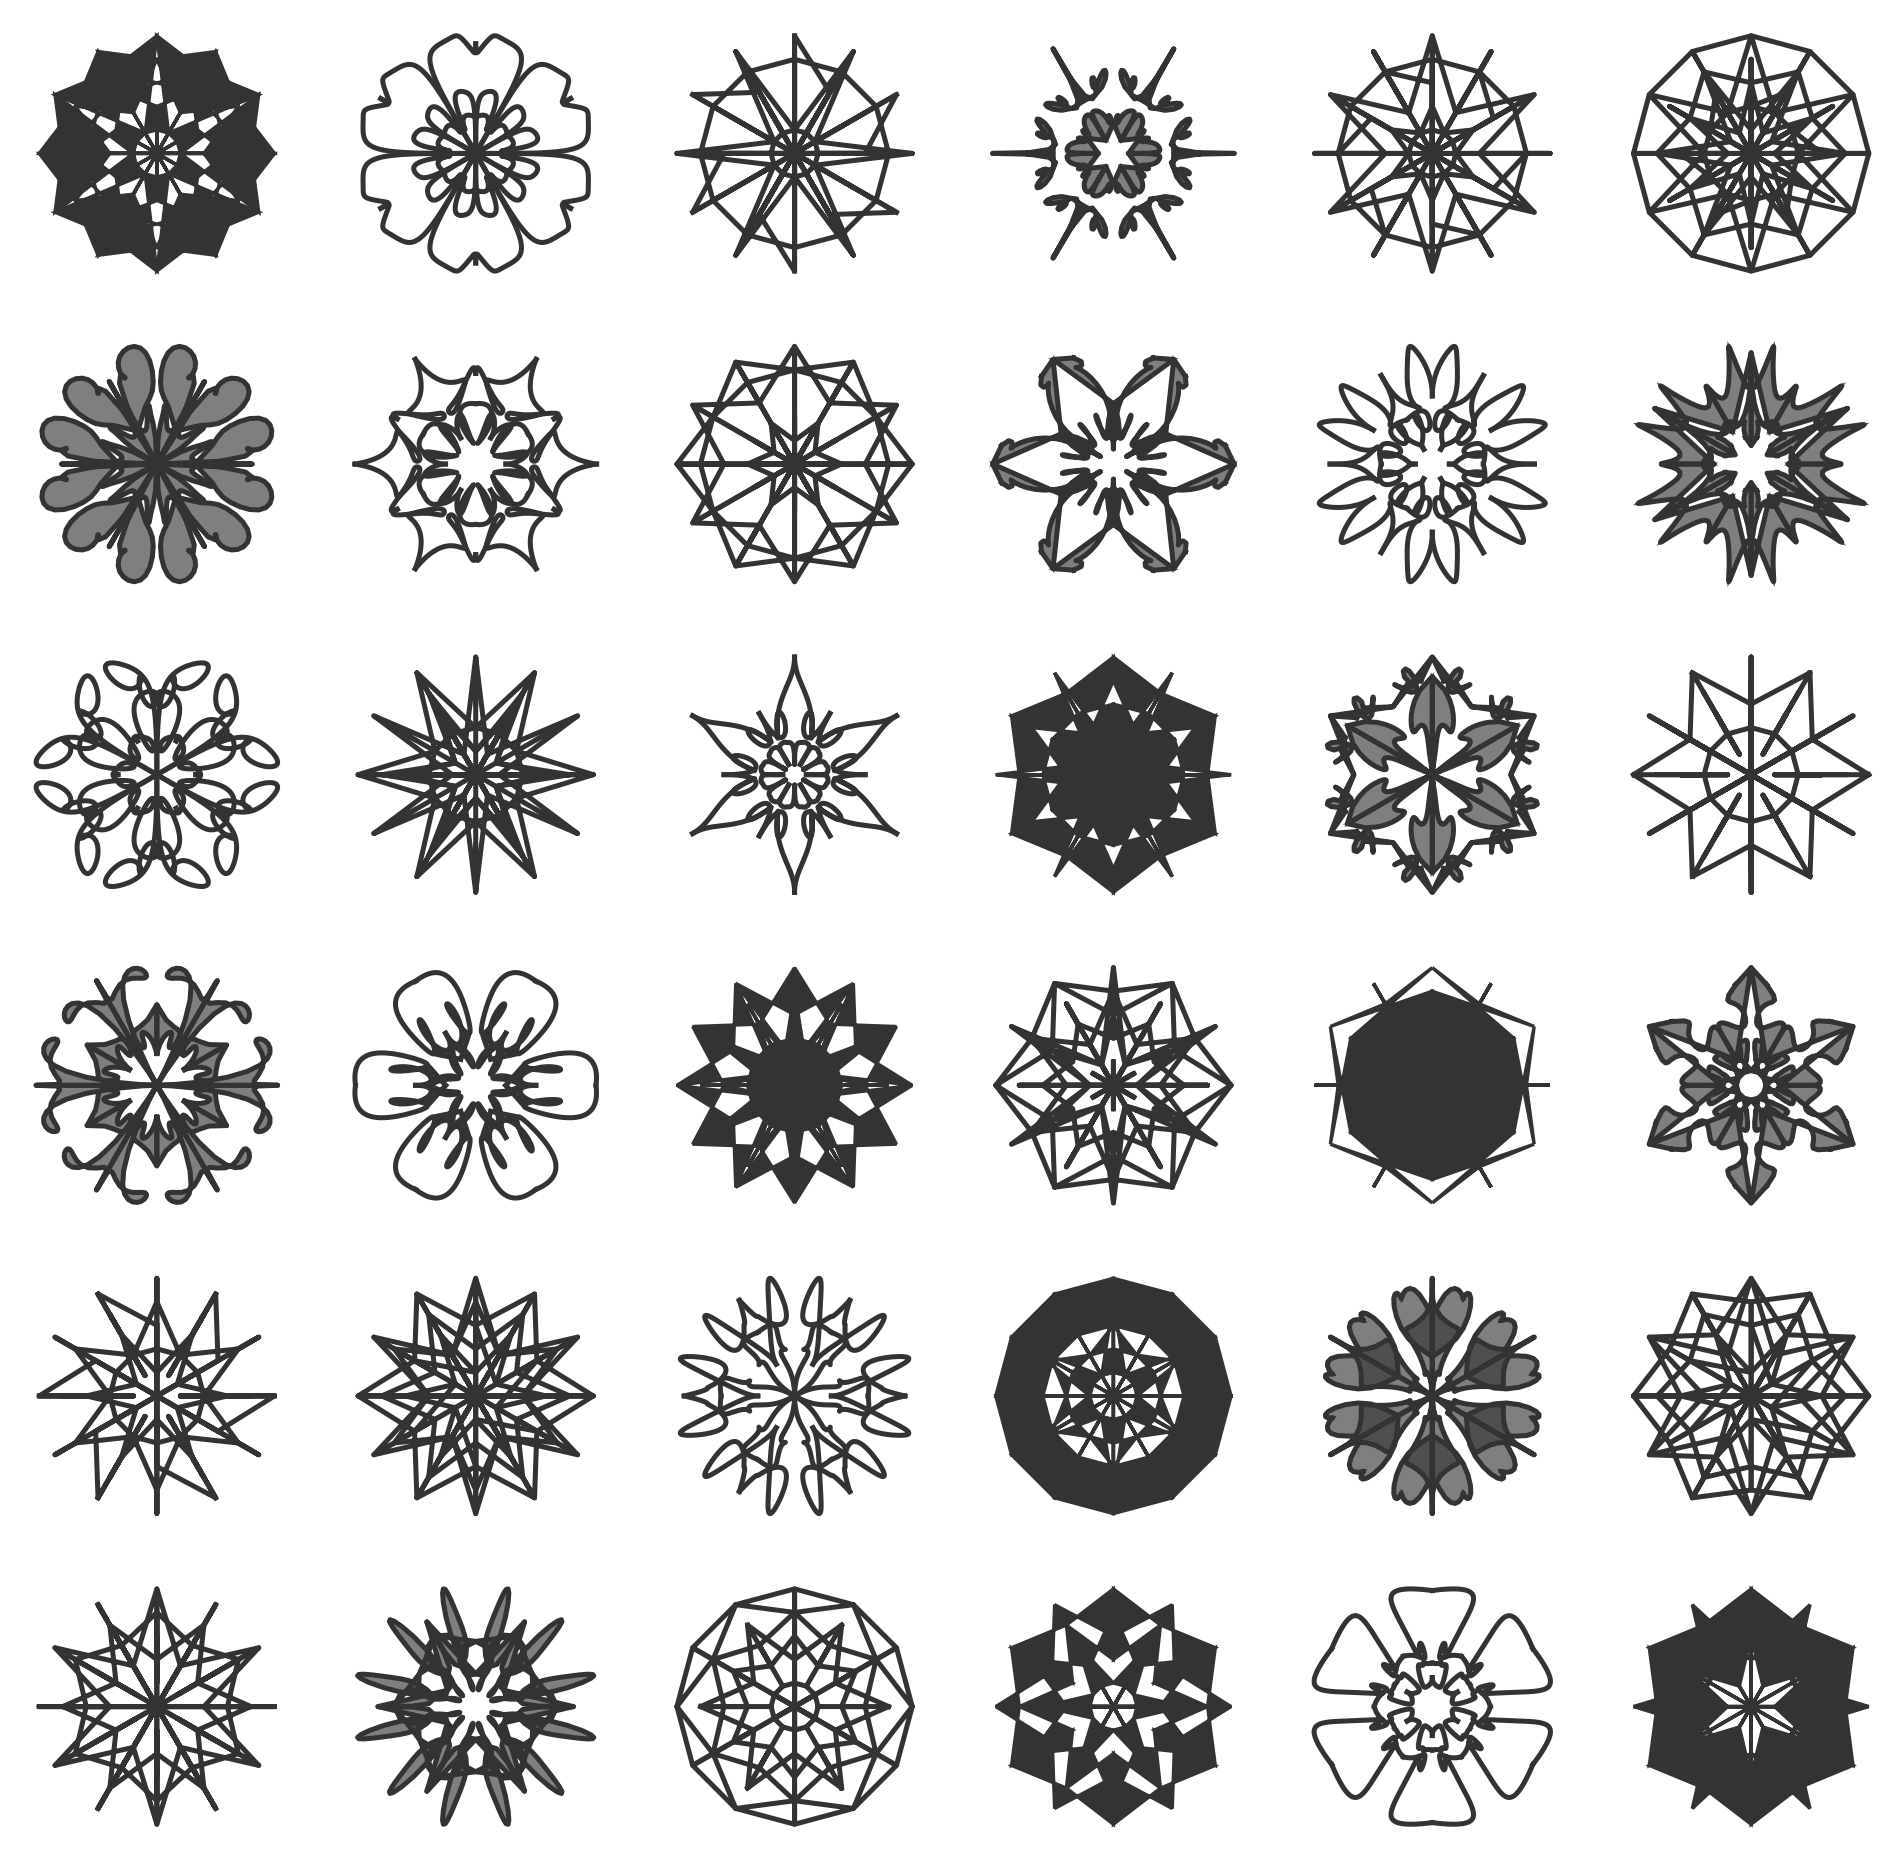
A table of random mandalas
random.seed(124)
fig=random_mandala(n_rows=6, n_columns=6, figsize=(10,10), dpi=240)
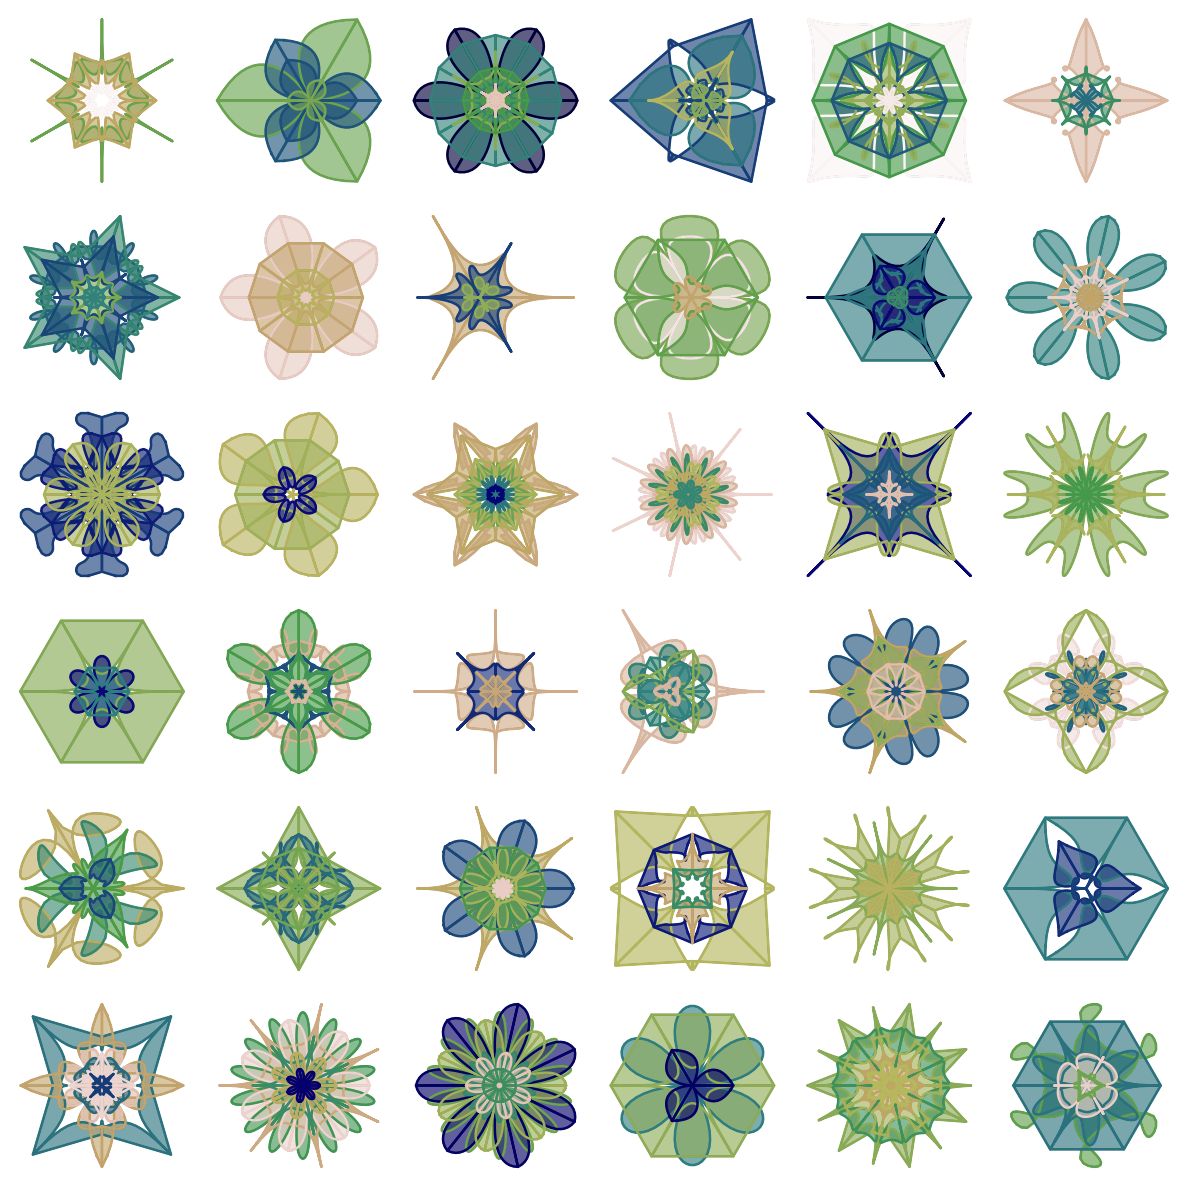
A table of colorized mandalas
fig = matplotlib.pyplot.figure(figsize=(10, 10), dpi=120)
k = 1
random.seed(56)
for i in range(36):
    rs=list(range(1,random.choice([3,4,5,6])+1))
    rs.sort()
    rs.reverse()

    fig = random_mandala(connecting_function="bezier_fill",
                         color_mapper=matplotlib.cm.gist_earth,
   						 symmetric_seed=True,
                         radius=rs,
                         rotational_symmetry_order=random.choice([3,4,5,6,7]),
                         number_of_elements=random.choice([2,3,4]),
                         figure=fig,
                         location=(6, 6, k))
    ax = fig.axes[-1]
    ax.set_axis_off()
    k = k + 1

fig.tight_layout()
plt.show()
plt.close(fig)
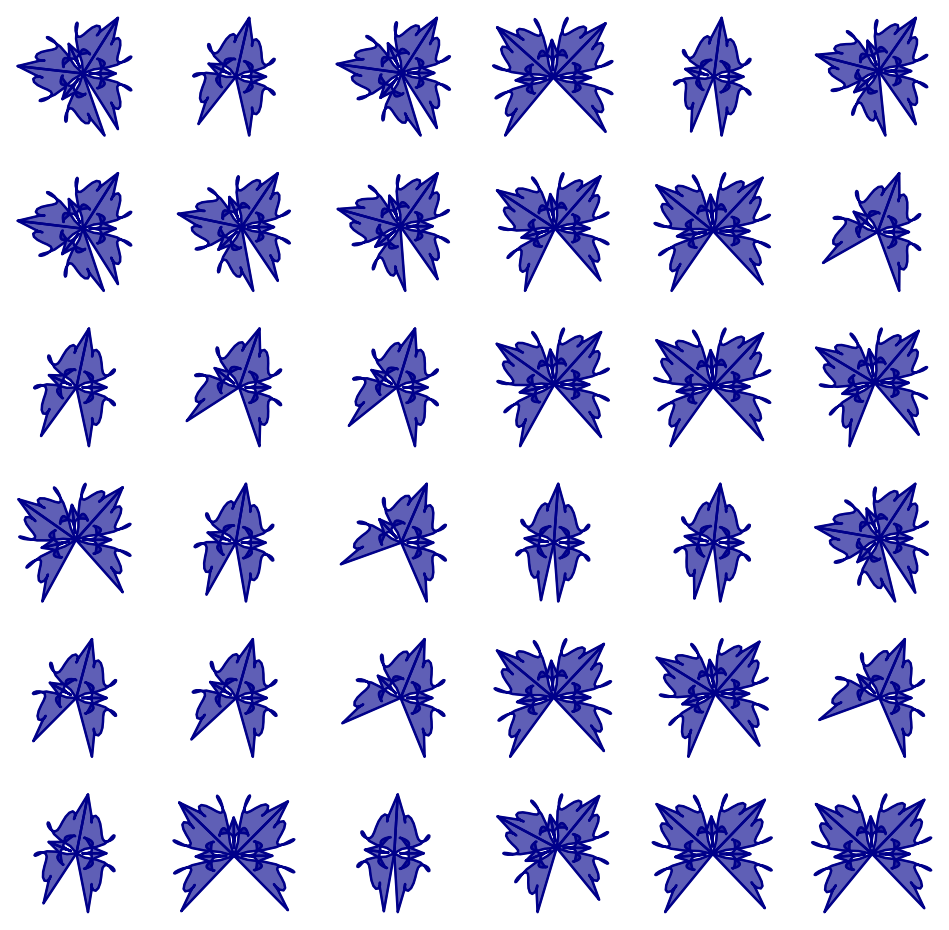
A table of open colorized mandalas
fig = matplotlib.pyplot.figure(figsize=(10, 10), dpi=120)
k = 1
random.seed(883)
for rso in [2 * random.random() + 2 for _ in range(36)]:
    random.seed(33)
    fig = random_mandala(connecting_function="bezier_fill",
                         radius=3,
                         face_color="darkblue",
                         rotational_symmetry_order=rso,
                         number_of_elements=8,
                         figure=fig,
                         location=(6, 6, k))
    ax = fig.axes[-1]
    ax.set_axis_off()
    k = k + 1

plt.show()
plt.close(fig)
Acknowledgements
-
Johannes Huessy for discussing different design elements.
-
Mr.T for figuring out and explaining the opacity argument implementation.
References
Articles
[AA1] Anton Antonov, "Comparison of dimension reduction algorithms over mandala images generation", (2017), [MathematicaForPrediction
Project details
Download files
Download the file for your platform. If you're not sure which to choose, learn more about installing packages.
Source Distribution
Built Distribution
Filter files by name, interpreter, ABI, and platform.
If you're not sure about the file name format, learn more about wheel file names.
Copy a direct link to the current filters
File details
Details for the file RandomMandala-0.6.0.tar.gz.
File metadata
- Download URL: RandomMandala-0.6.0.tar.gz
- Upload date:
- Size: 17.9 kB
- Tags: Source
- Uploaded using Trusted Publishing? No
- Uploaded via: twine/3.8.0 pkginfo/1.8.2 readme-renderer/32.0 requests/2.27.1 requests-toolbelt/0.9.1 urllib3/1.26.8 tqdm/4.62.3 importlib-metadata/4.11.1 keyring/23.5.0 rfc3986/2.0.0 colorama/0.4.4 CPython/3.10.2
File hashes
| Algorithm | Hash digest | |
|---|---|---|
| SHA256 |
824202563c815d45b8d88d5f863c4bbce294a30cac0a15ff60af7873dc99e69f
|
|
| MD5 |
445877bf9f83c05f8df0c22d67661c85
|
|
| BLAKE2b-256 |
b7f25847b4f02af8a5a24324e5cc7f35bd4749d24ff53c7e8099a3fd9bdd3f8d
|
File details
Details for the file RandomMandala-0.6.0-py3-none-any.whl.
File metadata
- Download URL: RandomMandala-0.6.0-py3-none-any.whl
- Upload date:
- Size: 14.9 kB
- Tags: Python 3
- Uploaded using Trusted Publishing? No
- Uploaded via: twine/3.8.0 pkginfo/1.8.2 readme-renderer/32.0 requests/2.27.1 requests-toolbelt/0.9.1 urllib3/1.26.8 tqdm/4.62.3 importlib-metadata/4.11.1 keyring/23.5.0 rfc3986/2.0.0 colorama/0.4.4 CPython/3.10.2
File hashes
| Algorithm | Hash digest | |
|---|---|---|
| SHA256 |
cf7dd13ae40ea76cd813766f63f685d76264ba8024af3cc9c40a342c6418e40c
|
|
| MD5 |
e4373288ce51a646f0e6fa15fd556858
|
|
| BLAKE2b-256 |
b24ea60447ff10f40d0491a61f8cfcc4e8017365af587ed2fc75fee2b61899d3
|


