AIPerf is a package for performance testing of AI models

Project description
AIPerf


Comprehensive Guide |Architecture | Design Proposals | Migrating from Genai-Perf | CLI Options | Metrics Reference
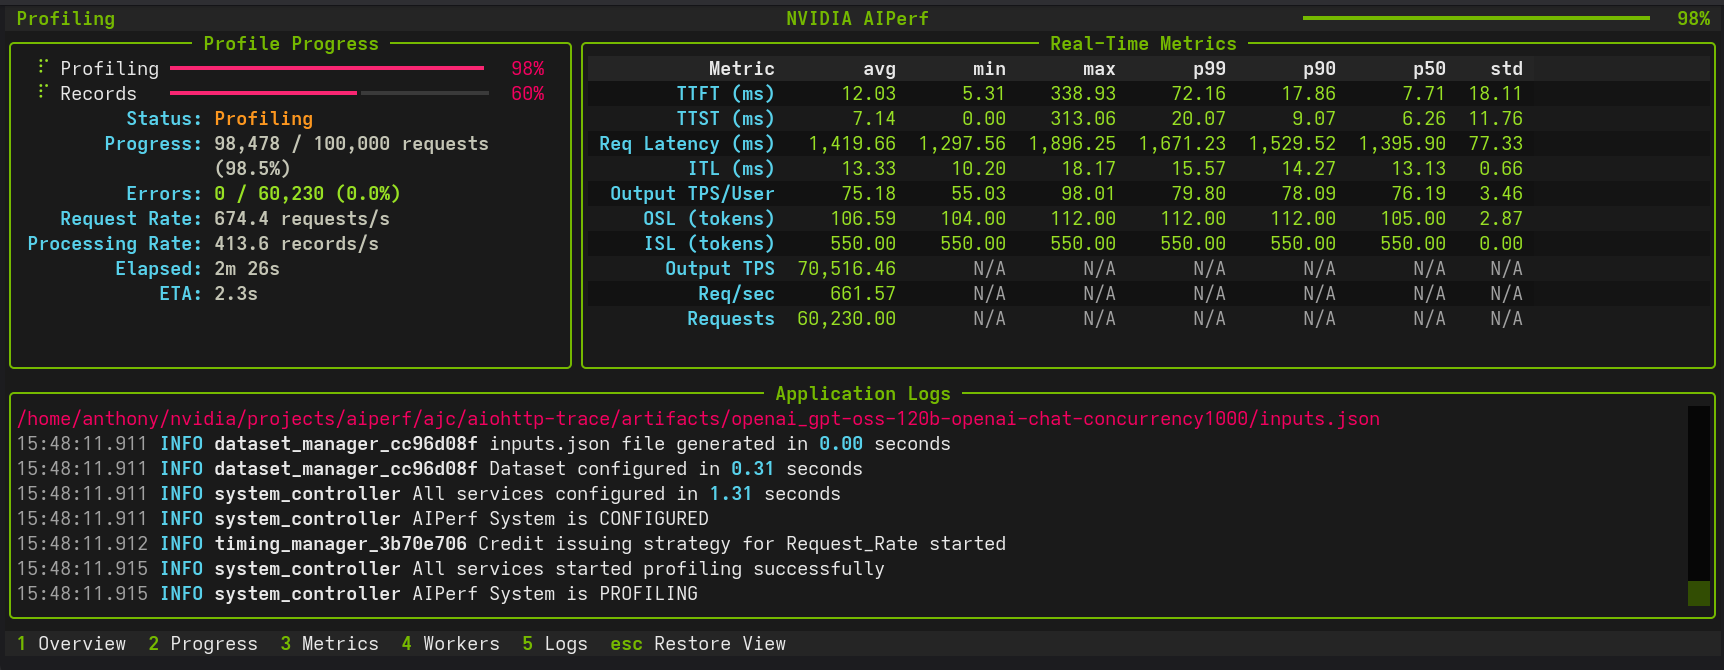
AIPerf is a comprehensive benchmarking tool that measures the performance of generative AI models served by your preferred inference solution. It provides detailed metrics using a command line display as well as extensive benchmark performance reports.
AIPerf provides multiprocess support out of the box for a single scalable solution.
Features
- Scalable via multiprocess support
- Modular design for easy user modification
- 3 UI types:
--ui-type dashboard(default in TTY, real-time TUI),--ui-type simple(progress bars),--ui-type none(default in non-TTY). Automatically detects interactive terminals. See CLI Options or User Interface for details. - Several benchmarking modes:
- concurrency
- request-rate
- request-rate with a maximum concurrency
- trace replay
- Public dataset support
Tutorials & Advanced Features
Getting Started
- Basic Tutorial - Learn the fundamentals with Dynamo and vLLM examples
- Comprehensive Benchmarking Guide - In-depth walkthrough with 5 real-world use cases, Pareto analysis, trace replay, goodput, and time-sliced analysis
- User Interface - Choose between dashboard, simple, or none for displaying progress
Load Control & Timing
| Feature | Description | Use Cases |
|---|---|---|
| Request Rate with Max Concurrency | Dual control of request timing and concurrent connection ceiling (Poisson or constant modes) | Testing API rate/concurrency limits, avoiding thundering herd, realistic client simulation |
| Arrival Patterns | Configure traffic patterns (constant, Poisson, gamma) with tunable burstiness | Realistic traffic simulation, stress testing, vLLM-compatible benchmarks |
| Prefill Concurrency | Limit concurrent prefill operations to prevent memory exhaustion with long-context workloads | Long-context benchmarking, OOM prevention, memory-safe stress testing |
| Gradual Ramping | Smooth ramp-up of concurrency and request rate over time | Capacity discovery, avoiding cold-start spikes, server warm-up |
| Warmup Phase | Configure pre-benchmark warmup to eliminate cold-start effects | Accurate measurements, JIT warm-up, cache priming |
| User-Centric Timing | Per-user rate limiting with precise timing for KV cache benchmarking | KV cache effectiveness, multi-user simulation, cache TTL testing |
| Request Cancellation | Test timeout behavior and service resilience | SLA validation, cancellation modeling |
| Multi-URL Load Balancing | Distribute requests across multiple inference server instances | Multi-GPU scaling, distributed inference, high-throughput benchmarking |
Workloads & Data
| Feature | Description | Use Cases |
|---|---|---|
| Trace Benchmarking | Deterministic workload replay with custom datasets | Regression testing, A/B testing |
| Custom Prompt Benchmarking | Send each prompt from your file exactly as-is, without sampling or generation | Regression testing, A/B testing, debugging specific prompts |
| Fixed Schedule | Precise timestamp-based request execution | Traffic replay, temporal analysis, burst testing |
| Time-based Benchmarking | Duration-based testing with grace period control | Stability testing, sustained performance |
| Sequence Distributions | Mixed ISL/OSL pairings | Benchmarking mixed use cases |
| Random Number Generation & Reproducibility | Deterministic dataset generation with --random-seed |
Debugging, regression testing, controlled experiments |
| Template Endpoint | Benchmark custom APIs with flexible Jinja2 request templates | Custom API formats, rapid prototyping, non-standard endpoints |
| SGLang Image Generation | Benchmark image generation APIs using SGLang with FLUX.1-dev model | Image generation testing, text-to-image benchmarking, extracting generated images |
Analysis & Monitoring
| Feature | Description | Use Cases |
|---|---|---|
| Timeslice Metrics | Split up benchmark into timeslices and calculate metrics for each timeslice | Load pattern impact, detecting warm-up effects, performance degradation analysis |
| Goodput | Throughput of requests meeting user-defined SLOs | SLO validation, capacity planning, runtime/model comparisons |
| HTTP Trace Metrics | Detailed HTTP request lifecycle timing (DNS, TCP/TLS, TTFB) following k6 and HAR conventions | Connection debugging, latency breakdown, transport-layer analysis |
| Profile Exports | Parse and analyze profile_export.jsonl with Pydantic models, custom metrics, and async processing |
Custom analysis, data pipelines, post-processing |
| Visualization & Plotting | Generate PNG visualizations with automatic mode detection (single-run analysis or multi-run comparison) | Parameter sweep analysis, performance debugging, model comparison |
| GPU Telemetry | Real-time GPU metrics collection via DCGM (power, utilization, memory, temperature, etc) | Performance optimization, resource monitoring, multi-node telemetry |
| Server Metrics | Collect Prometheus-compatible server metrics during benchmarking | Performance optimization, resource monitoring, multi-node telemetry |
Quick Navigation
# Basic profiling
aiperf profile --model Qwen/Qwen3-0.6B --url localhost:8000 --endpoint-type chat

# Request timeout testing
aiperf profile --request-timeout-seconds 30.0 [other options...]

# Trace-based benchmarking
aiperf profile --input-file trace.jsonl --custom-dataset-type single_turn [other options...]

# Fixed schedule execution
aiperf profile --input-file schedule.jsonl --fixed-schedule --fixed-schedule-auto-offset [other options...]

# Time-based benchmarking
aiperf profile --benchmark-duration 300.0 --benchmark-grace-period 30.0 [other options...]
Supported APIs
- OpenAI chat completions
- OpenAI completions
- OpenAI embeddings
- OpenAI audio: request throughput and latency
- OpenAI images: request throughput and latency
- NIM embeddings
- NIM rankings
Installation
pip install aiperf
Quick Start
This quick start guide leverages Ollama via Docker Desktop.
Setting up a Local Server
In order to set up an Ollama server, run granite4:350m using the following commands:
docker run -d \
  --name ollama \
  -p 11434:11434 \
  -v ollama-data:/root/.ollama \
  ollama/ollama:latest
docker exec -it ollama ollama pull granite4:350m
Basic Usage
Create a virtual environment and install AIPerf:
python3 -m venv venv
source venv/bin/activate
pip install aiperf
To run a simple benchmark against your Ollama server:
aiperf profile \
  --model "granite4:350m" \
  --streaming \
  --endpoint-type chat \
  --tokenizer ibm-granite/granite-4.0-micro \
  --url http://localhost:11434
Example with Custom Configuration
aiperf profile \
  --model "granite4:350m" \
  --streaming \
  --endpoint-type chat \
  --tokenizer ibm-granite/granite-4.0-micro \
  --url http://localhost:11434
  --concurrency 5 \
  --request-count 10
Example output:
NOTE: The example performance is reflective of a CPU-only run and does not represent an official benchmark.
                                               NVIDIA AIPerf | LLM Metrics
┏━━━━━━━━━━━━━━━━━━━━━━━━━━━━━━━━━━━━━━┳━━━━━━━━━━━┳━━━━━━━━━━┳━━━━━━━━━━━┳━━━━━━━━━━━┳━━━━━━━━━━━┳━━━━━━━━━━━┳━━━━━━━━━━┓
┃                               Metric ┃       avg ┃      min ┃       max ┃       p99 ┃       p90 ┃       p50 ┃      std ┃
┡━━━━━━━━━━━━━━━━━━━━━━━━━━━━━━━━━━━━━━╇━━━━━━━━━━━╇━━━━━━━━━━╇━━━━━━━━━━━╇━━━━━━━━━━━╇━━━━━━━━━━━╇━━━━━━━━━━━╇━━━━━━━━━━┩
│             Time to First Token (ms) │  7,463.28 │ 7,125.81 │  9,484.24 │  9,295.48 │  7,596.62 │  7,240.23 │   677.23 │
│            Time to Second Token (ms) │     68.73 │    32.01 │    102.86 │    102.55 │     99.80 │     67.37 │    24.95 │
│      Time to First Output Token (ms) │  7,463.28 │ 7,125.81 │  9,484.24 │  9,295.48 │  7,596.62 │  7,240.23 │   677.23 │
│                 Request Latency (ms) │ 13,829.40 │ 9,029.36 │ 27,905.46 │ 27,237.77 │ 21,228.48 │ 11,338.31 │ 5,614.32 │
│             Inter Token Latency (ms) │     65.31 │    53.06 │     81.31 │     81.24 │     80.64 │     63.79 │     9.09 │
│     Output Token Throughput Per User │     15.60 │    12.30 │     18.85 │     18.77 │     18.08 │     15.68 │     2.05 │
│                    (tokens/sec/user) │           │          │           │           │           │           │          │
│      Output Sequence Length (tokens) │     95.20 │    29.00 │    295.00 │    283.12 │    176.20 │     63.00 │    77.08 │
│       Input Sequence Length (tokens) │    550.00 │   550.00 │    550.00 │    550.00 │    550.00 │    550.00 │     0.00 │
│ Output Token Throughput (tokens/sec) │      6.85 │      N/A │       N/A │       N/A │       N/A │       N/A │      N/A │
│    Request Throughput (requests/sec) │      0.07 │      N/A │       N/A │       N/A │       N/A │       N/A │      N/A │
│             Request Count (requests) │     10.00 │      N/A │       N/A │       N/A │       N/A │       N/A │      N/A │
└──────────────────────────────────────┴───────────┴──────────┴───────────┴───────────┴───────────┴───────────┴──────────┘

CLI Command: aiperf profile --model 'granite4:350m' --streaming --endpoint-type 'chat' --tokenizer 'ibm-granite/granite-4.0-micro' --url 'http://localhost:11434'
Benchmark Duration: 138.89 sec
CSV Export: /home/user/aiperf/artifacts/granite4:350m-openai-chat-concurrency1/profile_export_aiperf.csv
JSON Export: /home/user/Code/aiperf/artifacts/granite4:350m-openai-chat-concurrency1/profile_export_aiperf.json
Log File: /home/user/Code/aiperf/artifacts/granite4:350m-openai-chat-concurrency1/logs/aiperf.log
Example output:
NVIDIA AIPerf | LLM Metrics
┏━━━━━━━━━━━━━━━━━━━━━━━━━━━━━━━━━━━━━━┳━━━━━━━━━━━┳━━━━━━━━┳━━━━━━━━┳━━━━━━━━┳━━━━━━━━┳━━━━━━━━┳━━━━━━━┓
┃                               Metric ┃       avg ┃    min ┃    max ┃    p99 ┃    p90 ┃    p75 ┃   std ┃
┡━━━━━━━━━━━━━━━━━━━━━━━━━━━━━━━━━━━━━━╇━━━━━━━━━━━╇━━━━━━━━╇━━━━━━━━╇━━━━━━━━╇━━━━━━━━╇━━━━━━━━╇━━━━━━━┩
│             Time to First Token (ms) │     18.26 │  11.22 │ 106.32 │  68.82 │  27.76 │  16.62 │ 12.07 │
│            Time to Second Token (ms) │     11.40 │   0.02 │  85.91 │  34.54 │  12.59 │  11.65 │  7.01 │
│                 Request Latency (ms) │    487.30 │ 267.07 │ 769.57 │ 715.99 │ 580.83 │ 536.17 │ 79.60 │
│             Inter Token Latency (ms) │     11.23 │   8.80 │  13.17 │  12.48 │  11.73 │  11.37 │  0.45 │
│     Output Token Throughput Per User │     89.23 │  75.93 │ 113.60 │ 102.28 │  90.91 │  90.29 │  3.70 │
│                    (tokens/sec/user) │           │        │        │        │        │        │       │
│      Output Sequence Length (tokens) │     42.83 │  24.00 │  65.00 │  64.00 │  52.00 │  47.00 │  7.21 │
│       Input Sequence Length (tokens) │     10.00 │  10.00 │  10.00 │  10.00 │  10.00 │  10.00 │  0.00 │
│ Output Token Throughput (tokens/sec) │ 10,944.03 │    N/A │    N/A │    N/A │    N/A │    N/A │   N/A │
│    Request Throughput (requests/sec) │    255.54 │    N/A │    N/A │    N/A │    N/A │    N/A │   N/A │
│             Request Count (requests) │    711.00 │    N/A │    N/A │    N/A │    N/A │    N/A │   N/A │
└──────────────────────────────────────┴───────────┴────────┴────────┴────────┴────────┴────────┴───────┘
Metrics Reference
AIPerf provides comprehensive metrics organized into multiple functional categories. For detailed descriptions, requirements, and nuances of each metric, see the Complete Metrics Reference.
Streaming Metrics
Metrics specific to streaming requests that measure real-time token generation characteristics. Requires --streaming flag.
| Metric | Tag | Formula | Unit |
|---|---|---|---|
| Time to First Token (TTFT) | time_to_first_token |
content_responses[0].perf_ns - request.start_perf_ns |
ms |
| Time to Second Token (TTST) | time_to_second_token |
content_responses[1].perf_ns - content_responses[0].perf_ns |
ms |
| Inter Token Latency (ITL) | inter_token_latency |
(request_latency - time_to_first_token) / (output_sequence_length - 1) |
ms |
| Inter Chunk Latency (ICL) | inter_chunk_latency |
[content_responses[i].perf_ns - content_responses[i-1].perf_ns for i in range(1, len(content_responses))] |
ms |
| Output Token Throughput Per User | output_token_throughput_per_user |
1.0 / inter_token_latency_seconds |
tokens/sec/user |
| Time to First Output Token (TTFO) | time_to_first_output_token |
first_non_reasoning_token_perf_ns - request.start_perf_ns |
ms |
| Prefill Throughput Per User | prefill_throughput_per_user |
input_sequence_length / time_to_first_token_seconds |
tokens/sec/user |
Token Based Metrics
Metrics for token-producing endpoints that track token counts and throughput. Requires text-generating endpoints (chat, completion, etc.).
| Metric | Tag | Formula | Unit |
|---|---|---|---|
| Output Token Count | output_token_count |
len(tokenizer.encode(content, add_special_tokens=False)) |
tokens |
| Output Sequence Length (OSL) | output_sequence_length |
(output_token_count or 0) + (reasoning_token_count or 0) |
tokens |
| Input Sequence Length (ISL) | input_sequence_length |
len(tokenizer.encode(prompt, add_special_tokens=False)) |
tokens |
| Total Output Tokens | total_output_tokens |
sum(r.output_token_count for r in records if r.valid) |
tokens |
| Total Output Sequence Length | total_osl |
sum(r.output_sequence_length for r in records if r.valid) |
tokens |
| Total Input Sequence Length | total_isl |
sum(r.input_sequence_length for r in records if r.valid) |
tokens |
| Output Token Throughput | output_token_throughput |
total_osl / benchmark_duration_seconds |
tokens/sec |
| Total Token Throughput | total_token_throughput |
(total_isl + total_osl) / benchmark_duration_seconds |
tokens/sec |
Image Metrics
Metrics for image processing endpoints. Requires image-capable endpoints.
| Metric | Tag | Formula | Unit |
|---|---|---|---|
| Image Throughput | image_throughput |
num_images / request_latency_seconds |
images/sec |
| Image Latency | image_latency |
request_latency_ms / num_images |
ms/image |
Reasoning Metrics
Metrics specific to models that support reasoning/thinking tokens. Requires models with separate reasoning_content field.
| Metric | Tag | Formula | Unit |
|---|---|---|---|
| Reasoning Token Count | reasoning_token_count |
len(tokenizer.encode(reasoning_content, add_special_tokens=False)) |
tokens |
| Total Reasoning Tokens | total_reasoning_tokens |
sum(r.reasoning_token_count for r in records if r.valid) |
tokens |
Usage Field Metrics
Metrics tracking API-reported token counts from the usage field in responses. Useful for comparing client-side vs server-side token counts.
| Metric | Tag | Formula | Unit |
|---|---|---|---|
| Usage Prompt Tokens | usage_prompt_tokens |
response.usage.prompt_tokens |
tokens |
| Usage Completion Tokens | usage_completion_tokens |
response.usage.completion_tokens |
tokens |
| Usage Total Tokens | usage_total_tokens |
response.usage.total_tokens |
tokens |
| Usage Reasoning Tokens | usage_reasoning_tokens |
response.usage.completion_tokens_details.reasoning_tokens |
tokens |
| Total Usage Prompt Tokens | total_usage_prompt_tokens |
sum(r.usage_prompt_tokens for r in records if r.valid) |
tokens |
| Total Usage Completion Tokens | total_usage_completion_tokens |
sum(r.usage_completion_tokens for r in records if r.valid) |
tokens |
| Total Usage Total Tokens | total_usage_total_tokens |
sum(r.usage_total_tokens for r in records if r.valid) |
tokens |
Usage Discrepancy Metrics
Metrics measuring differences between API-reported and client-computed token counts.
| Metric | Tag | Formula | Unit |
|---|---|---|---|
| Usage Prompt Tokens Diff % | usage_prompt_tokens_diff_pct |
abs((usage_prompt_tokens - input_sequence_length) / input_sequence_length) * 100 |
% |
| Usage Completion Tokens Diff % | usage_completion_tokens_diff_pct |
abs((usage_completion_tokens - output_sequence_length) / output_sequence_length) * 100 |
% |
| Usage Reasoning Tokens Diff % | usage_reasoning_tokens_diff_pct |
abs((usage_reasoning_tokens - reasoning_token_count) / reasoning_token_count) * 100 |
% |
| Usage Discrepancy Count | usage_discrepancy_count |
sum(1 for r in records if r.any_diff > threshold) |
requests |
OSL Mismatch Metrics
Metrics measuring differences between requested max_tokens and actual output length. Negative diff = stopped early (EOS), positive diff = over-generated.
| Metric | Tag | Formula | Unit |
|---|---|---|---|
| OSL Mismatch Diff % | osl_mismatch_diff_pct |
((actual_osl - requested_osl) / requested_osl) * 100 |
% |
| OSL Mismatch Count | osl_mismatch_count |
sum(1 for r if abs(actual - requested) > min(requested * pct / 100, token_cap)) |
requests |
Goodput Metrics
Metrics measuring throughput of requests meeting user-defined Service Level Objectives (SLOs).
| Metric | Tag | Formula | Unit |
|---|---|---|---|
| Good Request Count | good_request_count |
sum(1 for r in records if r.all_slos_met) |
requests |
| Goodput | goodput |
good_request_count / benchmark_duration_seconds |
requests/sec |
Error Metrics
Metrics computed for failed/error requests.
| Metric | Tag | Formula | Unit |
|---|---|---|---|
| Error Input Sequence Length | error_isl |
input_sequence_length (for error requests) |
tokens |
| Total Error Input Sequence Length | total_error_isl |
sum(r.input_sequence_length for r in records if not r.valid) |
tokens |
| Error Request Count | error_request_count |
sum(1 for r in records if not r.valid) |
requests |
General Metrics
Metrics available for all benchmark runs with no special requirements.
| Metric | Tag | Formula | Unit |
|---|---|---|---|
| Request Latency | request_latency |
content_responses[-1].perf_ns - request.start_perf_ns |
ms |
| Request Throughput | request_throughput |
request_count / benchmark_duration_seconds |
requests/sec |
| Request Count | request_count |
sum(1 for r in records if r.valid) |
requests |
| Minimum Request Timestamp | min_request_timestamp |
min(r.timestamp_ns for r in records) |
datetime |
| Maximum Response Timestamp | max_response_timestamp |
max(r.timestamp_ns + r.request_latency for r in records) |
datetime |
| Benchmark Duration | benchmark_duration |
max_response_timestamp - min_request_timestamp |
sec |
HTTP Trace Metrics
Low-level HTTP timing metrics following k6 and HAR conventions. Requires HTTP trace data collection enabled.
| Metric | Tag | Formula | Unit |
|---|---|---|---|
| HTTP Request Blocked | http_req_blocked |
connection_pool_wait_end_perf_ns - connection_pool_wait_start_perf_ns |
ms |
| HTTP Request DNS Lookup | http_req_dns_lookup |
dns_lookup_end_perf_ns - dns_lookup_start_perf_ns |
ms |
| HTTP Request Connecting | http_req_connecting |
tcp_connect_end_perf_ns - tcp_connect_start_perf_ns |
ms |
| HTTP Request Sending | http_req_sending |
request_send_end_perf_ns - request_send_start_perf_ns |
ms |
| HTTP Request Waiting | http_req_waiting |
response_chunks[0][0] - request_send_end_perf_ns |
ms |
| HTTP Request Receiving | http_req_receiving |
response_chunks[-1][0] - response_chunks[0][0] |
ms |
| HTTP Request Duration | http_req_duration |
response_receive_end_perf_ns - request_send_start_perf_ns |
ms |
| HTTP Request Connection Overhead | http_req_connection_overhead |
http_req_blocked + http_req_dns_lookup + http_req_connecting |
ms |
| HTTP Request Total | http_req_total |
http_req_blocked + http_req_dns_lookup + http_req_connecting + http_req_sending + http_req_waiting + http_req_receiving |
ms |
| HTTP Request Data Sent | http_req_data_sent |
sum(size for _, size in request_chunks) |
bytes |
| HTTP Request Data Received | http_req_data_received |
sum(size for _, size in response_chunks) |
bytes |
| HTTP Request Connection Reused | http_req_connection_reused |
1 if connection_reused_perf_ns is not None else 0 |
boolean |
Known Issues
- Output sequence length constraints (
--output-tokens-mean) cannot be guaranteed unless you passignore_eosand/ormin_tokensvia--extra-inputsto an inference server that supports them. - Very high concurrency settings (typically >15,000 concurrency) may lead to port exhaustion on some systems, causing connection failures during benchmarking. If encountered, consider adjusting system limits or reducing concurrency.
- Startup errors caused by invalid configuration settings can cause AIPerf to hang indefinitely. If AIPerf appears to freeze during initialization, terminate the process and check configuration settings.
Release history Release notifications | RSS feed


Download files
Download the file for your platform. If you're not sure which to choose, learn more about installing packages.
Source Distributions
Built Distribution
Filter files by name, interpreter, ABI, and platform.
If you're not sure about the file name format, learn more about wheel file names.
Copy a direct link to the current filters
File details
Details for the file aiperf-0.6.0-py3-none-any.whl.
File metadata
- Download URL: aiperf-0.6.0-py3-none-any.whl
- Upload date:
- Size: 3.4 MB
- Tags: Python 3
- Uploaded using Trusted Publishing? No
- Uploaded via: twine/6.2.0 CPython/3.14.2
File hashes
| Algorithm | Hash digest | |
|---|---|---|
| SHA256 |
913aff328b2fdcd46266f5883a503af2dc8332fea6a209bb70ccc72a9e79122f
|
|
| MD5 |
ec0324bfa048f224da0ebe0bdeb02eda
|
|
| BLAKE2b-256 |
34945559f998c84942ab17103bd0e673e503ed9f1f176f30875a9e42c8aa7a67
|


