
allen-circuit-dynamics




Latent-variable models of simultaneously recorded neural populations, run on open data from the Allen Institute and its collaborators, with a pipeline that runs end-to-end on synthetic data in under a minute. Independent work; not affiliated with or endorsed by the Allen Institute.
pip install allen-circuit-dynamics
acd demo --out outputs/demo          # both Neuropixels experiments on synthetic data, ~30 s, no downloads
from allen_circuit_dynamics import PopulationDataset, SharedPrivateFA, run_latent_experiment

ds = PopulationDataset.load("my_session.npz")          # x1, x2, behavior, blocks, bin_s
metrics = run_latent_experiment(ds)                    # held-out selection, partition, decoding
model = SharedPrivateFA(d_shared=3, d_private=(2, 2)).fit(ds.x1, ds.x2)
latents = model.transform(ds.x1, ds.x2)                # {"shared": ..., "private1": ..., "private2": ...}
One model sits underneath: a population's activity is a few shared latents, a few private latents, and per-neuron noise, possibly with linear dynamics on the latents. The three experiments score that model on three different output contracts, in the sense of asking what the model is for:
| Contract | Scored by | Data | |
|---|---|---|---|
| Exp 1 | Observations — reconstruct the recorded activity | held-out log-likelihood; shared / private / independent variance partition | Visual Coding Neuropixels, VISrl ↔ VISp |
| Exp 2 | State — predict the next latent state | held-out one-step R², with and without an anatomical prior | Visual Coding Neuropixels, five visual areas + Mouse Connectivity Atlas |
| Exp 3 | Action — predict the animal's output from the latents | held-out R² of lever displacement per subspace, lag profile, pre-registered | Klee et al. 2026 two-photon D1 / D2 striatum (Zenodo) |
A model that scores well on one contract need not score well on another; the point of running all three is to say which one each dataset supports. (The observation / state / action split is the agent–environment loop with the latent as the state; the same three-way reading has been used to sort "world models" by what they emit.)
Status: all three pipelines tested on synthetic data with planted structure;
Experiments 1 and 2 run once on Visual Coding session 715093703 (VISrl, VISp,
VISpm, VISl, VISam; 50 ms bins inside natural_movie_one; 12,009 bins);
Experiment 3 pre-registered in docs/experiment3_preregistration.md before
the run and run on all six mice of the Klee et al. dataset. Every result below
is a first pass on one session per animal, not a study. Provenance: Experiment
1 outputs at commit 896f68c (code unchanged since), Experiment 2 at
dbc8ed8, Experiment 3 at the SHA in outputs/force_klee/*/metrics.json.
Experiment 1 — shared / private factor analysis
Model: factor analysis on the concatenated vector [x1, x2] with a
block-sparse loading matrix, fit by EM with the zero pattern enforced at every
M-step.
x1 = W1 z + V1 u1 + mu1 + e1        z  : shared latents (d_shared)
x2 = W2 z + V2 u2 + mu2 + e2        u1 : private to population 1 (d_private)
                                    u2 : private to population 2 (d_private)
It is the static special case of probabilistic CCA with explicit private subspaces (Bach & Jordan 2005) and of DLAG without time delays (Gokcen et al. 2022). The experiment:
- selects
d_sharedandd_privateby held-out log-likelihood under block-grouped cross-validation (contiguous time stays together), - reports the variance partition (shared / private / noise) per population,
- benchmarks cross-population prediction (E[x2 | x1]) against reduced-rank regression at each rank (Semedo et al. 2019) and CCA,
- decodes the behavior from each subspace (shared, private-1, private-2, raw populations) with ridge regression under grouped CV, against a circular-shift null that preserves the behavior's autocorrelation.
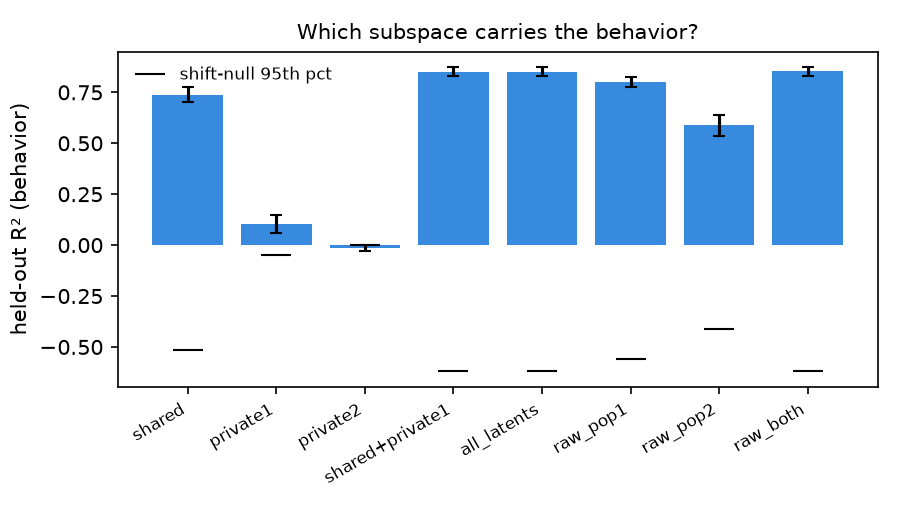
On the synthetic demo (planted: 3 shared, 2 private per population, behavior a readout of the shared factors plus population-1's private factors) the shared subspace carries the behavior (R² ≈ 0.74), population-2's private subspace does not (≈ 0), and the RRR curve flattens by rank 3. At the demo's firing rates the linear-Gaussian model selects more dimensions than were planted (6 shared, 4 private) because Poisson counts put nonlinear structure into extra linear directions; in the lower-gain regime the test suite uses, held-out likelihood selects the planted 3 exactly. See Limits.
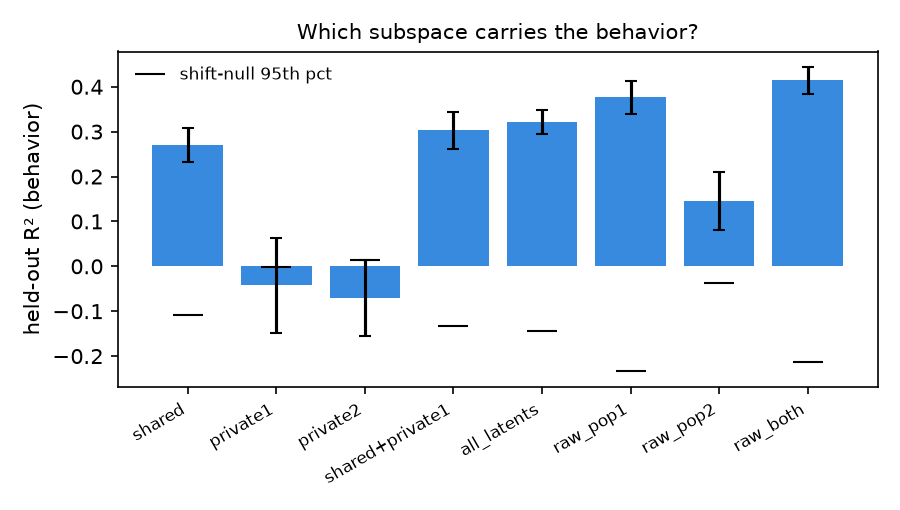
Real session 715093703, VISrl (76 units) ↔ VISp (60 units). Held-out likelihood selects 6 shared and 4 private dimensions. Variance is mostly noise at 50 ms (VISrl: 9% shared / 5% private / 86% noise; VISp: 16 / 10 / 75). The shared subspace decodes running speed (R² 0.27 ± 0.04 across folds; circular-shift null p95 −0.11) and neither private subspace does (−0.04, −0.07). All latents together reach 0.32 and the raw populations 0.41, so the 10-dimensional model keeps most, not all, of the behavior-relevant signal. The raw populations split sharply: VISrl alone decodes running at 0.38, VISp alone at 0.14. Cross-area prediction is near zero: E[VISp | VISrl] has R² −0.05 under the factor model and reduced-rank regression tops out at 0.04 by rank 6. Read together: at this bin size the "shared" factors look like a slow signal common to both areas (locomotion / arousal, strongest in RL), not fast inter-area communication. That is the expected place for a static model to land and the reason DLAG-style delays are the next comparison.
Experiment 2 — connectivity-constrained linear dynamics
Per-area population latents are stacked into S and fit with a one-step
linear model S[t+1] = S[t] A + b. The atlas enters as a penalty on each
area-to-area block of A proportional to how weak that projection is:
penalty(A) = λ · Σ_{a,b} (1 − conn[a,b]) · ‖A_block(a,b)‖²
The test is held-out one-step prediction of the atlas-constrained model vs. an unconstrained ridge model vs. models fit with a shuffled connectivity matrix at the same λ. If the atlas carries information about the dynamics the true-atlas curve should separate from the shuffled curve as λ grows; if it doesn't, that's the finding. On the synthetic demo (six areas, eight latents each, 1 200 bins, a planted sparse projection matrix) the two curves separate at large λ and the fitted block norms correlate with the planted connectivity.
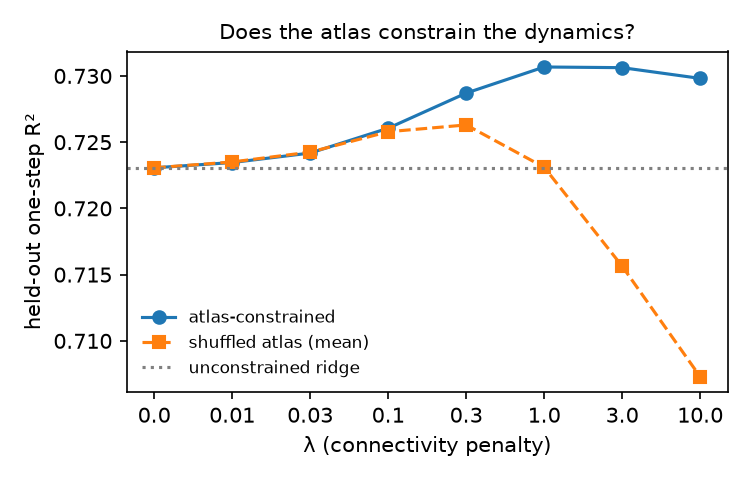
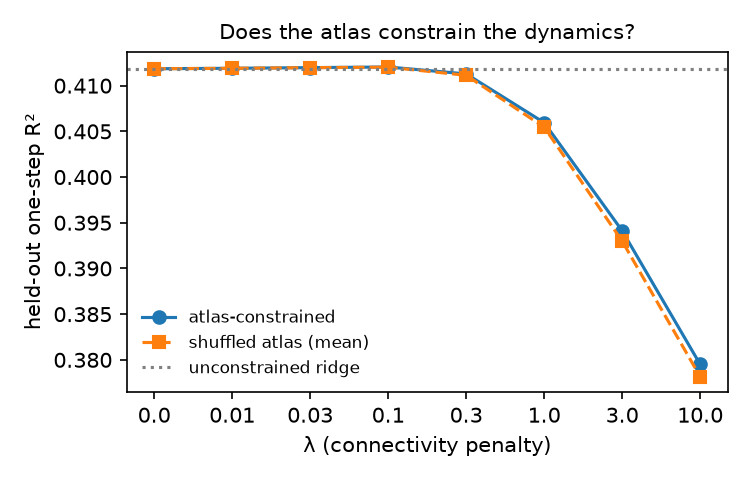
Real session 715093703, five visual areas. The unconstrained one-step model explains R² 0.41 of the next bin's latents. The atlas prior does not help: at every λ from 0.01 to 10 the atlas-constrained and shuffled-atlas models agree to three decimals (Δ ≤ +0.001), and both lose accuracy once λ exceeds about 1 (0.41 → 0.38 at λ = 10). So on this session the projection- density matrix carries no information the one-step predictor can use beyond what any equally sparse prior would. Nor does the unconstrained fit recover the anatomy on its own: its off-diagonal coupling-block norms correlate with projection density at r = 0.38 over 20 blocks, permutation p = 0.075 (null 95th percentile 0.42). 77% of ‖A‖² sits in the within-area blocks. On this session, then, the answer to question 2 is no at 50 ms.
Two things the first real run taught, both now fixed in the code: the penalty
was in absolute units and was swamped by a 10× longer recording, so λ is now
dimensionless (see models/coupling.py; the synthetic curve is unchanged);
and the anatomy correlation was being computed from the atlas-penalised fit,
which inflated it to r = 0.54 (p = 0.016) even at the near-zero selected λ —
it is now computed from the λ = 0 fit.
Experiment 3 — D1 vs D2 striatal neurons, shared / private covariance, and the lever
Pre-registered in docs/experiment3_preregistration.md
(commit b1676da) before any model was fit; the thresholds below are the ones
written there. Data: Klee et al. (2026), six mice, two-photon calcium imaging
of anterior dorsal striatum at 30 fps, every ROI labelled D1-SPN or D2-SPN, a
lever on a rotary encoder (displacement, encoder units), video motion energy,
cued and self-paced blocks. Same model as Experiment 1 with D1 as population 1
and D2 as population 2; 100 ms bins; D1 and D2 count-matched by ten random
subsample draws; everything reported as the mean over draws.
Partition (the observation contract). In every mouse the shared fraction
of variance is nearly the same for D1 and D2 — 0.18 / 0.18, 0.21 / 0.22,
0.25 / 0.25, 0.24 / 0.23, 0.26 / 0.21, 0.21 / 0.16 — and the population-
specific (private) fraction is 1–5%. Almost all the correlated variance in
either population is variance it shares with the other. Cross-prediction by
reduced-rank regression is symmetric (rank 8: D2 from D1 0.08–0.18, D1 from D2
0.10–0.18). Held-out likelihood selected the top of the pre-registered
d_shared grid (8) in four of six mice, so the shared dimensionality is a
floor, not an estimate.
Decoding (the action contract). The pre-registered verdicts, six mice:
| Hypothesis | Verdict | What the numbers say | |
|---|---|---|---|
| H1 | D1 and D2 decode the lever equally | supported, 5 / 6 | Substantive only in JK239 (0.15 vs 0.14); JK238 fails (0.38 vs 0.26); in three mice both are ≈ 0, so equality is trivial |
| H2a | shared subspace beats the shift null | supported, 5 / 6 | Real in JK238 (0.36, null p95 −0.27) and JK239 (0.17, −0.14); marginal in JK244 (0.05); ≈ 0 in the three EY217 mice, where it clears a negative null by 0.01–0.05 |
| H2b | shared beats private-D1 + private-D2 | supported, 4 / 6 | Private subspaces decode nothing anywhere (−0.01 to 0.03) |
| H3 | neural leads the lever by 0.1–0.7 s | not supported, 1 / 6 | The shared lag profile peaks at 0 in five mice; its right tail (neural after lever) decays slower, which is the indicator's own kernel |
| H4a | shared fraction same across contexts | not supported, 3 / 6 | |
| H4b | lead differs across contexts | not supported, 3 / 6 | Context subsets have 4–6 CV blocks, so single-block test folds with their own lever offsets; the context analysis is under-powered as pre-registered |
Motion regression (video motion energy, ±200 ms, inside the training fold) halves JK238's shared R² (0.36 → 0.18) and leaves JK239's (0.17 → 0.24) and the near-zero mice unchanged, so in the one mouse with strong decoding about half of the shared–lever relation is movement of the animal rather than the lever as such.
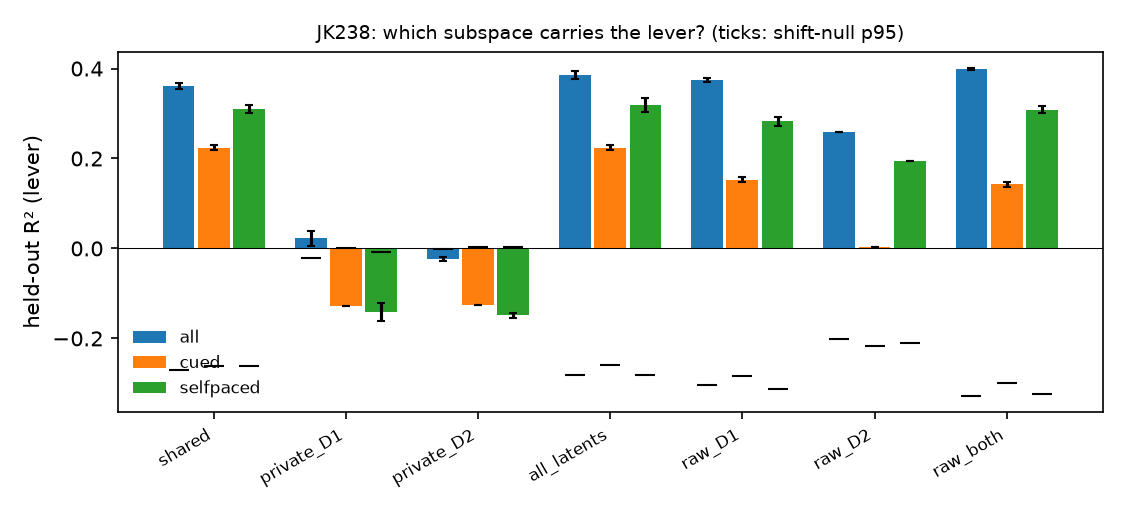
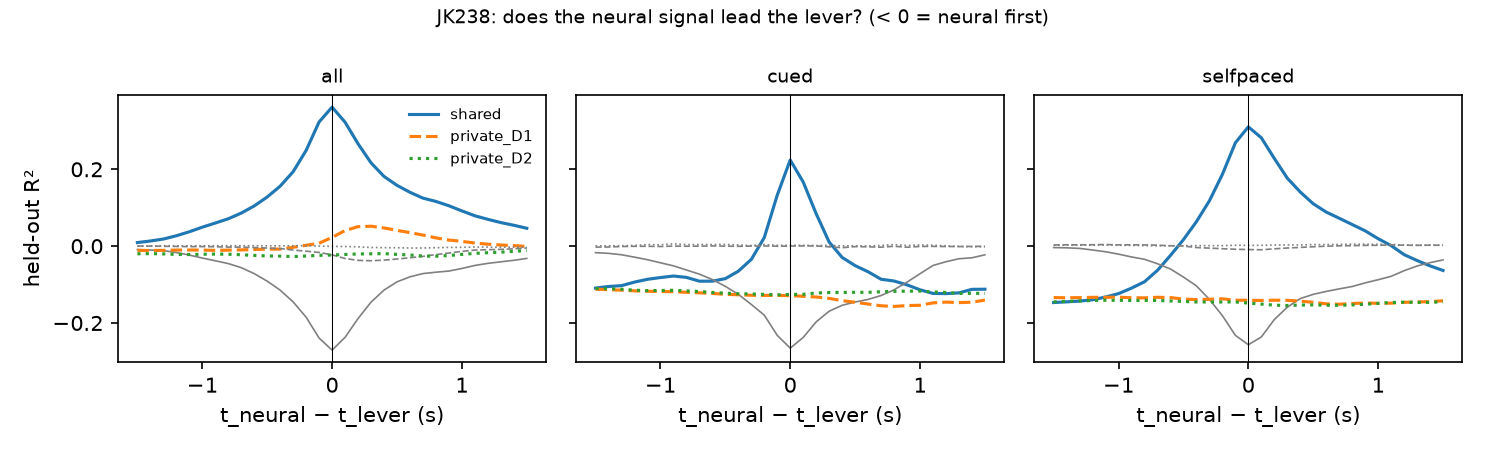
Reading. The covariance structure is the robust finding: D1 and D2 share one common subspace in every animal and keep almost nothing to themselves, which is the population-level version of the paper's "both populations encode the action." Whether that subspace carries the lever varies by animal from 0.36 to nothing, and the three mice with no lever signal are the three D1-Cre (EY217) animals; the neural–video correlation is also a third of the others' there, so it is a property of those recordings (press rates are half the others') rather than of the model. The timing question is not answerable at 30 fps with a slow indicator: a lead shorter than the GCaMP decay is folded into lag 0.
Per-mouse metrics.json and figures are under outputs/force_klee/;
scripts/evaluate_prereg.py reproduces the table from them. JK326's metrics
record 5c913f0, a commit that changed only the summary and plotting code
after the analysis code at 6cfff70.
Run it
uv venv && source .venv/bin/activate
uv pip install -e ".[dev]"
acd demo --out outputs/demo_local  # both experiments, synthetic, ~30 s (outputs/demo/ is the committed run)
pytest
Real data (Visual Coding Neuropixels, public S3 bucket, no credentials):
uv venv --python 3.10 .venv-allen && uv pip install --python .venv-allen/bin/python -e ".[allen]"   # allensdk pins old scipy/pandas
.venv-allen/bin/acd fetch --session 715093703 --out data/ecephys    # areas chosen from the session (top VIS* by QC-passing units)
SESSION=715093703 bash scripts/run_experiments.sh                    # connectivity matrix + both experiments
scripts/bootstrap_linux.sh --fetch does all of the above on a fresh Linux or WSL box,
including a parallel ranged download of the 2.7 GB NWB from Allen's public S3
bucket (scripts/pdl.sh; allensdk's own download times out on slow links).
Experiment 3 (Klee et al. 2026, 246 MB, CPU only, ~45 min per mouse):
# Data Structures/Switching_2p_Struc_Main.mat from https://zenodo.org/records/16333867
acd force --mat Switching_2p_Struc_Main.mat --mouse all --out outputs/force_klee
What the loader does to the data
- Unit QC:
isi_violations < 0.5,amplitude_cutoff < 0.1,presence_ratio > 0.9. - Bins spikes at 50 ms inside the chosen stimulus epoch only (default
natural_movie_one); a bin never straddles two presentation windows. - Behavior = mean running speed per bin; bins with no speed samples are dropped and counted in the metadata.
- Units under 0.5 Hz are dropped and counted. Counts are square-root transformed, then z-scored with training-fold statistics inside every cross-validation loop.
- Twelve contiguous blocks define the CV groups.
Every metrics.json carries a provenance block: package version, git SHA,
library versions, config hash, and the dataset's own metadata.
Layout
src/allen_circuit_dynamics/
  dataset.py          PopulationDataset — the one container every stage uses
  synth.py            planted-structure generators (both experiments)
  preprocess.py       unit filter, sqrt, fold-safe scaling
  models/shared_private.py   block-sparse FA by EM
  models/baselines.py        RRR, CCA, per-population FA
  models/coupling.py         connectivity-penalised linear dynamics + shuffle control
  decode.py           grouped-CV ridge decoding with a circular-shift null
  experiments.py      the two experiments as pure functions → metrics dict
  report.py           one figure per question
  allen_data.py       AllenSDK loader (lazy import) + atlas projection matrix
  klee_data.py        Klee et al. 2026 two-photon loader (h5py; dF/F per the paper)
  lagged.py           lag pairing that never crosses CV blocks; within-block shift null
  experiments_force.py  Experiment 3 (count-matched draws, contexts, lag profile)
  cli.py              acd demo | fetch | latent | coupling | force
docs/experiment3_preregistration.md   hypotheses, grid, controls, decision rules — committed before the run
tests/                19 tests, ~2 min, synthetic only
scripts/bootstrap_linux.sh
Limits, stated up front
- The shared/private model is linear-Gaussian and static. On Poisson-like counts it needs more dimensions than the generative truth to absorb the nonlinearity; held-out likelihood, not the planted number, is the criterion.
- Experiment 2's "areas" are PCA latents, not cell types, and the atlas prior is projection density, which says nothing about sign or cell-type specificity. The experiment can only say whether that coarse structure predicts coupling — not why.
- Running speed is a behavioral proxy available in the open dataset; it is not a measured motor output. The code accepts any continuous signal on the same bins.
- One session, one bin size, one stimulus epoch. Nothing above should be generalised until it holds across sessions and at 10–25 ms bins.
- The decoded behavior is running speed; a slow common signal that tracks it will show up as "shared" under a static model whether or not the areas communicate. Time-delayed shared latents (DLAG) are the test that separates the two.
- Experiment 3: one session per mouse (no learning across days), no EMG, lever displacement rather than force, calcium at 30 fps (no timing claim finer than the indicator), and three of six mice with little lever signal in the neural data at all. The context split is under-powered by block count.
- The
d_sharedgrid ceiling (8) was hit in four mice; the shared dimensionality reported there is a lower bound.
References
- Bach & Jordan (2005). A probabilistic interpretation of canonical correlation analysis.
- Semedo, Zandvakili, Machens, Yu & Kohn (2019). Cortical areas interact through a communication subspace. Neuron.
- Gokcen, Jasper, Semedo, Zandvakili, Kohn, Machens & Yu (2022). Disentangling the flow of signals between populations of neurons. Nature Computational Science.
- Siegle et al. (2021). Survey of spiking in the mouse visual system reveals functional hierarchy. Nature. (Visual Coding Neuropixels dataset)
- Oh et al. (2014). A mesoscale connectome of the mouse brain. Nature. (Mouse Connectivity Atlas)
- Klee, Fernando-Peiris, Athalye, Costa, Peterka & Sippy (2026). Shared striatal neurons exhibit context-specific dynamics for internally and externally driven actions. Science Advances. Data: Zenodo 10.5281/zenodo.16333867, CC BY 4.0. (Experiment 3 dataset)
- Athalye, Ganguly, Costa & Carmena (2017). Emergence of coordinated neural dynamics underlies neuroprosthetic learning and skillful control. Neuron. (shared vs. private variance vocabulary)
1 maintainer

Metadata
1 maintainer
Release files for allen-circuit-dynamics 0.2.0
For a detailed explanation of source distributions (sdists) and built distributions (wheels), please see the package formats documentation.
Source distribution (sdist)
| File | Size | Uploaded | Provenance | Actions |
|---|---|---|---|---|
| allen_circuit_dynamics-0.2.0.tar.gz | 45.3 kB | With provenance | Details for allen_circuit_dynamics-0.2.0.tar.gz |
Built distribution (wheel)
| File | Interpreter | ABI | Platform | Actions Reset |
|---|---|---|---|---|
| allen_circuit_dynamics-0.2.0-py3-none-any.whl | Python 3 | none | any | Details for allen_circuit_dynamics-0.2.0-py3-none-any.whl |
Total release size: 95.1 kB
Release files / allen_circuit_dynamics-0.2.0.tar.gz
| Download URL | allen_circuit_dynamics-0.2.0.tar.gz |
|---|---|
| Size | 45.3 kB |
| Tags | Source |
|
SHA-256 checksum How to use checksums |
b881ee6017e8298a5c1d8c42efe179539b0486dcdd443bf54f801986759e7a37
|
|
BLAKE2b-256 checksum How to use checksums |
a1114b3d70e342dd2782ded3f9f175ce6f7a971cb075497f6beeb4b93d86f4cf
|
| Upload date | |
|
Uploaded using Trusted Publishing? What is trusted publishing? |
Yes |
| Uploaded via |
twine/7.0.0 CPython/3.13.16
|
Provenance
Provenance describes where a file came from. On PyPI, provenance is shared via attestations, which provide a verifiable record of the build or publishing details. View details, limitations and caveats.


PyPI Publish Attestation
PyPI verified that this artifact, at this checksum, originated from the publisher listed below.
Signed by GitHub Actions, verified by PyPI on Oct 31, 2026.
Transparency logRelease files / allen_circuit_dynamics-0.2.0-py3-none-any.whl
| Download URL | allen_circuit_dynamics-0.2.0-py3-none-any.whl |
|---|---|
| Size | 49.8 kB |
| Tags | Python 3 |
|
SHA-256 checksum How to use checksums |
4436a2fba70aba96ed8ad6782193a07b56b6fb5965e2742e1191fa9aebe3b149
|
|
BLAKE2b-256 checksum How to use checksums |
970f859e9540ec019b94bc1732a90a35a2133b4c382d85fb1de1cff4b9e7f968
|
| Upload date | |
|
Uploaded using Trusted Publishing? What is trusted publishing? |
Yes |
| Uploaded via |
twine/7.0.0 CPython/3.13.16
|
Provenance
Provenance describes where a file came from. On PyPI, provenance is shared via attestations, which provide a verifiable record of the build or publishing details. View details, limitations and caveats.
PyPI Publish Attestation
PyPI verified that this artifact, at this checksum, originated from the publisher listed below.
Signed by GitHub Actions, verified by PyPI on Oct 31, 2026.
Transparency logSecurity for allen-circuit-dynamics 0.2.0
Provenance
Provenance describes where a file came from. On PyPI, provenance is shared via attestations, which provide a verifiable record of the build or publishing details. View details, limitations and caveats.
Full provenance
All 2 files in this release have been uploaded with provenance metadata.
Attestation for allen_circuit_dynamics-0.2.0.tar.gz
PyPI Publish Attestation
PyPI verified that this artifact, at this checksum, originated from the publisher listed below.
Signed by GitHub Actions, verified by PyPI on Oct 31, 2026.
Transparency logA note on package security
PyPI is a repository for distributing packages, not a service for auditing them. While third-party security researchers and our staff do their best to detect and remove malicious packages, PyPI cannot guarantee the quality, security or suitability of any given package.
To learn more about protecting yourself from malicious actors, visit our package security documentation.














