
Altair 







Altair is a declarative statistical visualization library for Python. With Altair, you can spend more time understanding your data and its meaning. Altair's API is simple, friendly and consistent and built on top of the powerful Vega-Lite JSON specification. This elegant simplicity produces beautiful and effective visualizations with a minimal amount of code. Altair is developed by Jake Vanderplas and Brian Granger in close collaboration with the UW Interactive Data Lab.
Altair Documentation
See Altair's Documentation Site, as well as Altair's Tutorial Notebooks.
Example
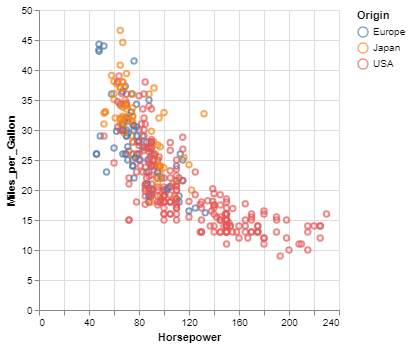
Here is an example using Altair to quickly visualize and display a dataset with the native Vega-Lite renderer in the JupyterLab:
import altair as alt

# load a simple dataset as a pandas DataFrame
from vega_datasets import data
cars = data.cars()

alt.Chart(cars).mark_point().encode(
    x='Horsepower',
    y='Miles_per_Gallon',
    color='Origin',
)
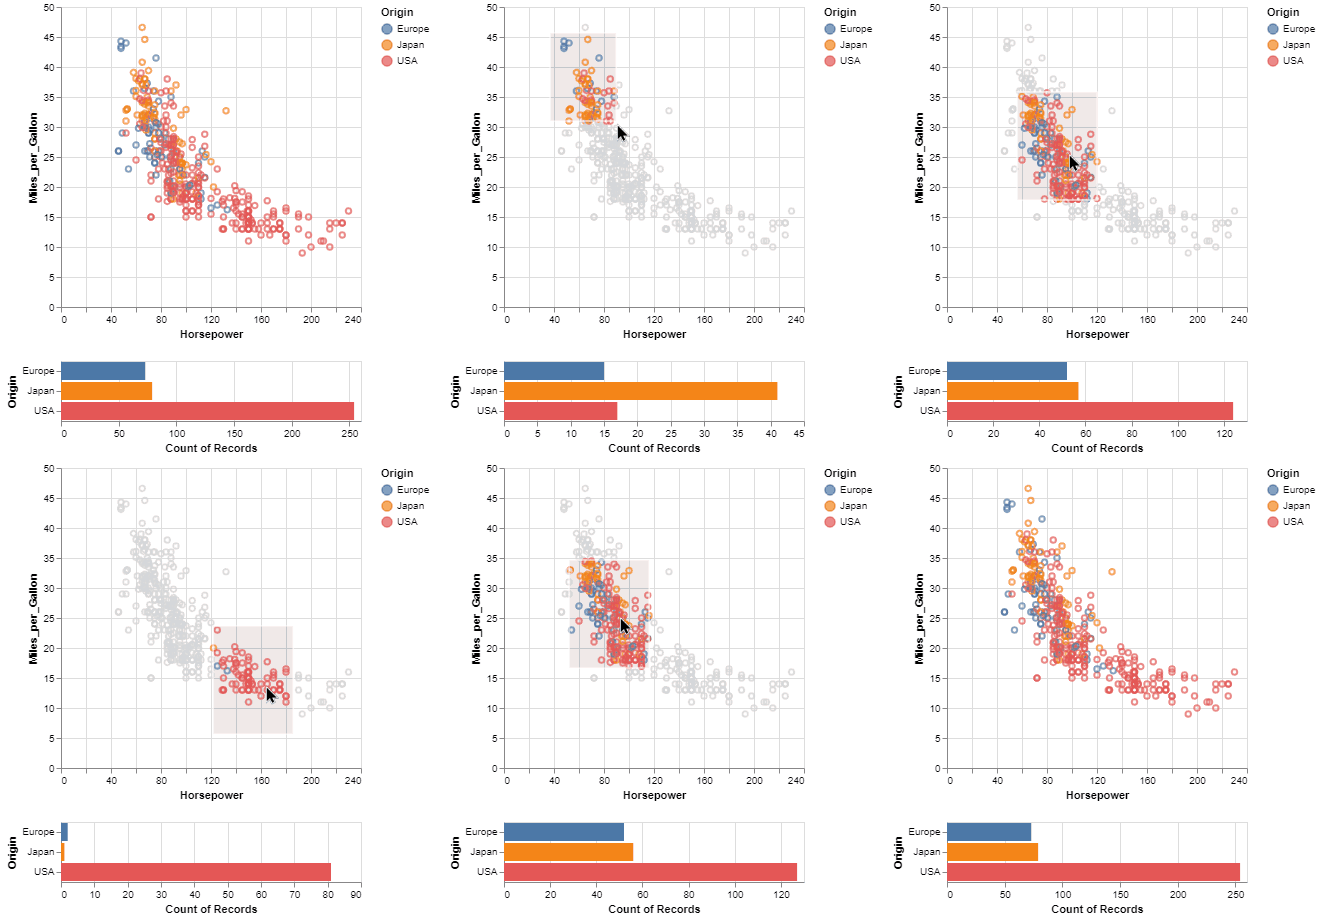
One of the unique features of Altair, inherited from Vega-Lite, is a declarative grammar of not just visualization, but interaction. With a few modifications to the example above we can create a linked histogram that is filtered based on a selection of the scatter plot.
import altair as alt
from vega_datasets import data

source = data.cars()

brush = alt.selection(type='interval')

points = alt.Chart(source).mark_point().encode(
    x='Horsepower',
    y='Miles_per_Gallon',
    color=alt.condition(brush, 'Origin', alt.value('lightgray'))
).add_selection(
    brush
)

bars = alt.Chart(source).mark_bar().encode(
    y='Origin',
    color='Origin',
    x='count(Origin)'
).transform_filter(
    brush
)

points & bars
Getting your Questions Answered
If you have a question that is not addressed in the documentation, there are several ways to ask:
- open a Github Issue
- post a StackOverflow Question (be sure to use the
altairtag) - ask on the Altair Google Group
We'll do our best to get your question answered
A Python API for statistical visualizations
Altair provides a Python API for building statistical visualizations in a declarative manner. By statistical visualization we mean:
- The data source is a
DataFramethat consists of columns of different data types (quantitative, ordinal, nominal and date/time). - The
DataFrameis in a tidy format where the rows correspond to samples and the columns correspond to the observed variables. - The data is mapped to the visual properties (position, color, size, shape, faceting, etc.) using the group-by data transformation.
The Altair API contains no actual visualization rendering code but instead emits JSON data structures following the Vega-Lite specification. The resulting Vega-Lite JSON data can be rendered in the following user-interfaces:
- Jupyter Notebook (by installing ipyvega).
- JupyterLab (no additional dependencies needed).
- nteract (no additional dependencies needed).
Features
- Carefully-designed, declarative Python API based on traitlets.
- Auto-generated internal Python API that guarantees visualizations are type-checked and in full conformance with the Vega-Lite specification.
- Auto-generate Altair Python code from a Vega-Lite JSON spec.
- Display visualizations in the live Jupyter Notebook, JupyterLab, nteract, on GitHub and nbviewer.
- Export visualizations to PNG/SVG images, stand-alone HTML pages and the Online Vega-Lite Editor.
- Serialize visualizations as JSON files.
- Explore Altair with dozens of examples in the Example Gallery
Installation
To use Altair for visualization, you need to install two sets of tools
-
The core Altair Package and its dependencies
-
The renderer for the frontend you wish to use (i.e.
Jupyter Notebook,JupyterLab, ornteract)
Altair can be installed with either pip or with conda.
For full installation instructions, please see
https://altair-viz.github.io/getting_started/installation.html
Example and tutorial notebooks
We maintain a separate Github repository of Jupyter Notebooks that contain an interactive tutorial and examples:
https://github.com/altair-viz/altair_notebooks
To launch a live notebook server with those notebook using binder or Colab, click on one of the following badges:

Project philosophy
Many excellent plotting libraries exist in Python, including the main ones:
Each library does a particular set of things well.
User challenges
However, such a proliferation of options creates great difficulty for users as they have to wade through all of these APIs to find which of them is the best for the task at hand. None of these libraries are optimized for high-level statistical visualization, so users have to assemble their own using a mishmash of APIs. For individuals just learning data science, this forces them to focus on learning APIs rather than exploring their data.
Another challenge is current plotting APIs require the user to write code, even for incidental details of a visualization. This results in an unfortunate and unnecessary cognitive burden as the visualization type (histogram, scatterplot, etc.) can often be inferred using basic information such as the columns of interest and the data types of those columns.
For example, if you are interested in the visualization of two numerical columns, a scatterplot is almost certainly a good starting point. If you add a categorical column to that, you probably want to encode that column using colors or facets. If inferring the visualization proves difficult at times, a simple user interface can construct a visualization without any coding. Tableau and the Interactive Data Lab's Polestar and Voyager are excellent examples of such UIs.
Design approach and solution
We believe that these challenges can be addressed without the creation of yet another visualization library that has a programmatic API and built-in rendering. Altair's approach to building visualizations uses a layered design that leverages the full capabilities of existing visualization libraries:
- Create a constrained, simple Python API (Altair) that is purely declarative
- Use the API (Altair) to emit JSON output that follows the Vega-Lite spec
- Render that spec using existing visualization libraries
This approach enables users to perform exploratory visualizations with a much simpler API initially, pick an appropriate renderer for their usage case, and then leverage the full capabilities of that renderer for more advanced plot customization.
We realize that a declarative API will necessarily be limited compared to the full programmatic APIs of Matplotlib, Bokeh, etc. That is a deliberate design choice we feel is needed to simplify the user experience of exploratory visualization.
Development install
Altair requires the following dependencies:
If you have cloned the repository, run the following command from the root of the repository:
pip install -e .[dev]
If you do not wish to clone the repository, you can install using:
pip install git+https://github.com/altair-viz/altair
Testing
To run the test suite you must have py.test installed. To run the tests, use
py.test --pyargs altair
(you can omit the --pyargs flag if you are running the tests from a source checkout).
Feedback and Contribution
See CONTRIBUTING.md
Citing Altair
If you use Altair in academic work, please consider citing http://joss.theoj.org/papers/10.21105/joss.01057 as
@article{2018-altair,
  doi = {10.21105/joss.01057},
  url = {https://doi.org/10.21105/joss.01057},
  year  = {2018},
  month = {dec},
  publisher = {The Open Journal},
  author = {Jacob VanderPlas and Brian Granger and Jeffrey Heer and Dominik Moritz and Kanit Wongsuphasawat and Arvind Satyanarayan and Eitan Lees and Ilia Timofeev and Ben Welsh and Scott Sievert},
  title = {Altair: Interactive Statistical Visualizations for Python},
  journal = {Journal of Open Source Software}
}
Please additionally consider citing the vega-lite project, which Altair is based on: https://dl.acm.org/doi/10.1109/TVCG.2016.2599030
@article{2017-vega-lite,
 title = {Vega-Lite: A Grammar of Interactive Graphics},
 author = {Arvind Satyanarayan AND Dominik Moritz AND Kanit Wongsuphasawat AND Jeffrey Heer},
 journal = {IEEE Trans. Visualization \& Comp. Graphics (Proc. InfoVis)},
 year = {2017},
 url = {http://idl.cs.washington.edu/papers/vega-lite},
}
Whence Altair?
Altair is the brightest star in the constellation Aquila, and along with Deneb and Vega forms the northern-hemisphere asterism known as the Summer Triangle.
6 maintainers


Metadata
6 maintainers
Release files for altair 4.1.0
For a detailed explanation of source distributions (sdists) and built distributions (wheels), please see the package formats documentation.
Source distribution (sdist)
| File | Size | Uploaded | |
|---|---|---|---|
| altair-4.1.0.tar.gz | 655.8 kB | Details |
Built distribution (wheel)
| File | Interpreter | ABI | Platform | Reset |
|---|---|---|---|---|
| altair-4.1.0-py3-none-any.whl | Python 3 | none | any | Details |
Total release size: 1.4 MB
Release files / altair-4.1.0.tar.gz
| Download URL | altair-4.1.0.tar.gz |
|---|---|
| Size | 655.8 kB |
| Tags | Source |
|
SHA-256 checksum How to use checksums |
3edd30d4f4bb0a37278b72578e7e60bc72045a8e6704179e2f4738e35bc12931
|
|
BLAKE2b-256 checksum How to use checksums |
ab21b2e7de05af65d89c5bf8f716fe2949e4f99a7809530ecb8f8e22a2e1c778
|
| Upload date | |
|
Uploaded using Trusted Publishing? What is trusted publishing? |
No |
| Uploaded via |
twine/1.13.0 pkginfo/1.5.0.1 requests/2.22.0 setuptools/42.0.2.post20191203 requests-toolbelt/0.9.1 tqdm/4.31.1 CPython/3.6.7
|
Release files / altair-4.1.0-py3-none-any.whl
| Download URL | altair-4.1.0-py3-none-any.whl |
|---|---|
| Size | 727.8 kB |
| Tags | Python 3 |
|
SHA-256 checksum How to use checksums |
7748841a1bea8354173d1140bef6d3b58bea21d201f562528e9599ea384feb7f
|
|
BLAKE2b-256 checksum How to use checksums |
01550bb2226e34f21fa549c3f4557b4f154a5632f61132a969da17c95ca8eab9
|
| Upload date | |
|
Uploaded using Trusted Publishing? What is trusted publishing? |
No |
| Uploaded via |
twine/1.13.0 pkginfo/1.5.0.1 requests/2.22.0 setuptools/42.0.2.post20191203 requests-toolbelt/0.9.1 tqdm/4.31.1 CPython/3.6.7
|














