
Tools for processing audio signals

Project description
Audio Toolset


A Python library for processing audio signals.
audio_toolset provides an intuitive and flexible way to process audio files in Python. Each Channel object handles a single mono audio file, allowing you to apply filters, EQ, dynamics processing, gain adjustments, noise reduction, and more.
Stereo files can be handled by first splitting them into mono channels using split_to_mono and then recombining them with join_to_stereo.
Features
- High level
Channelobject for simple user interface - Load audio from a file or
AudioData - Gain processing
gain,normalize,fade
- Filters
lowpass,highpass,eq_bandnoise_reduction(spectral gating)
- Dynamics
compressor,limiter,soft_clipping
- Plotting tools (see examples)
plot_signal- generate signal time and frequency plot- Dynamic plots -
compressor,limitercan generate attenuation plots - Bode plots -
lowpass,highpass,eq_bandcan generate filter bode plots
Installation
pip install git+https://github.com/maxoshe/audio-toolset.git
Examples
Process with a channel strip
from audio_toolset.channel import Channel

guitar = Channel("guitar.wav")
guitar.highpass(cutoff_frequency=100, db_per_octave=6)
guitar.eq_band(center_frequency=2000, gain_db=3, q_factor=1)
guitar.lowpass(cutoff_frequency=10000, db_per_octave=12)
guitar.normalize(target_db=-1)
guitar.compressor(threshold_db=-20, compression_ratio=4, attack_ms=50, release_ms=100)
guitar.write("guitar_processed.wav")
Process with a chained channel strip
speech = Channel("speech.wav").highpass(cutoff_frequency=100).lowpass(cutoff_frequency=300)
Plotting
audio_toolset provides multiple plotting tools to visualize signals, filters, and dynamics. All plots are generated interactively using Plotly and can be saved as images from the interactive viewer.
Signal Plots
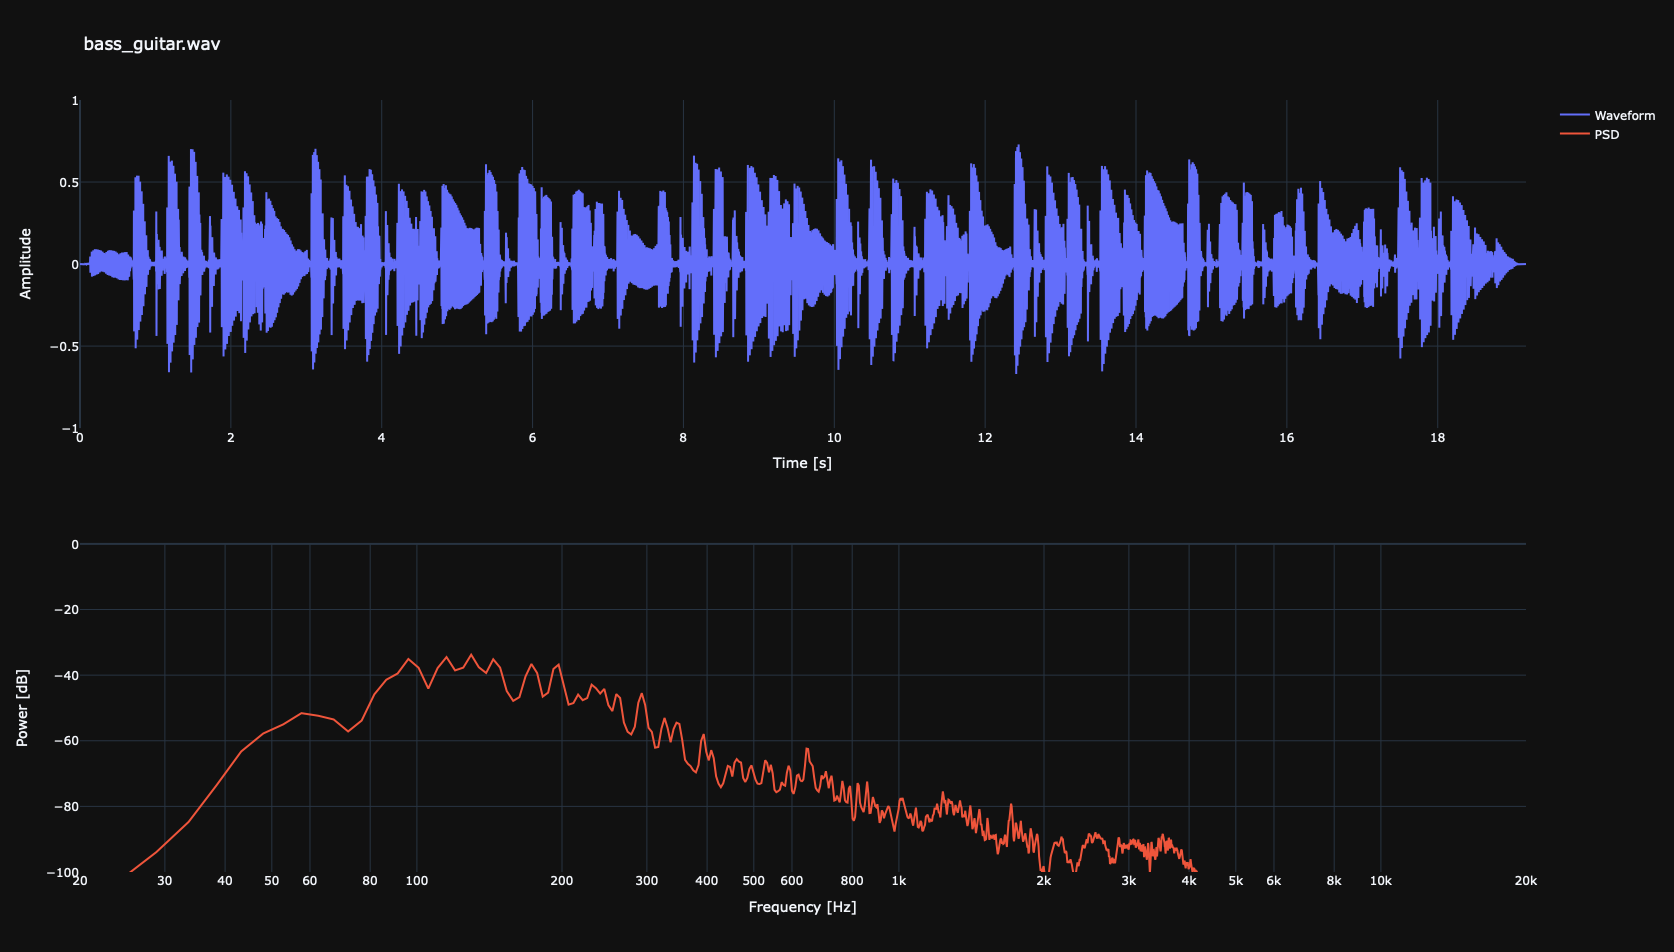
Use plot_signal() to visualize the time-domain and frequency-domain representation of an audio channel.
2. Filter (Bode) Plots
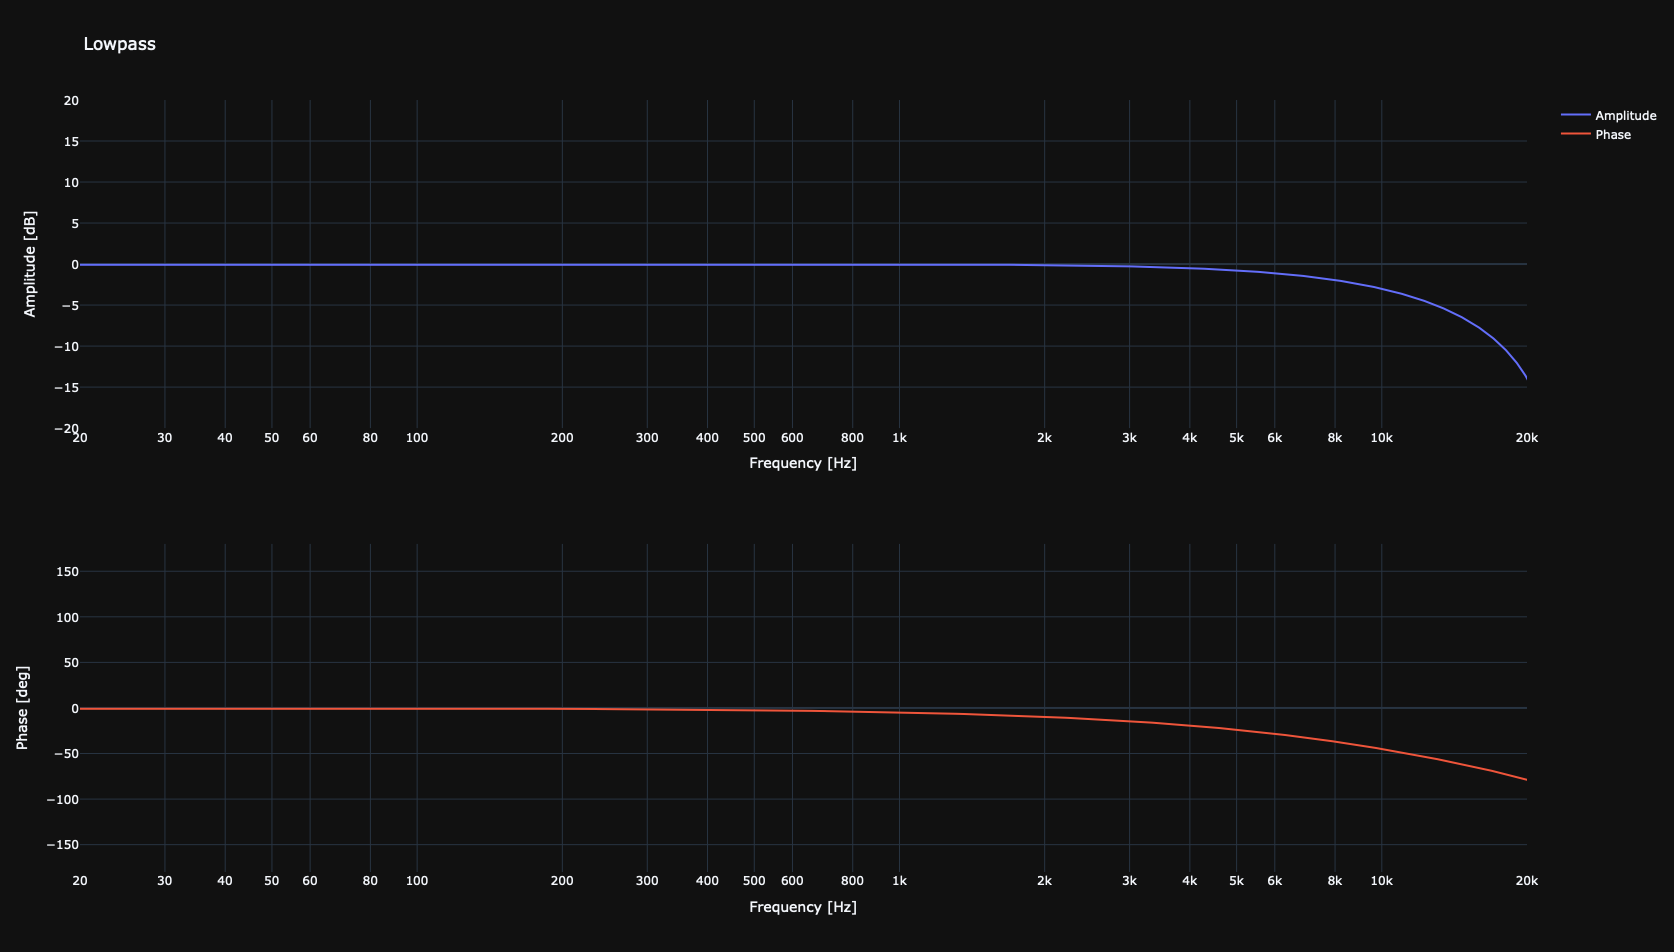
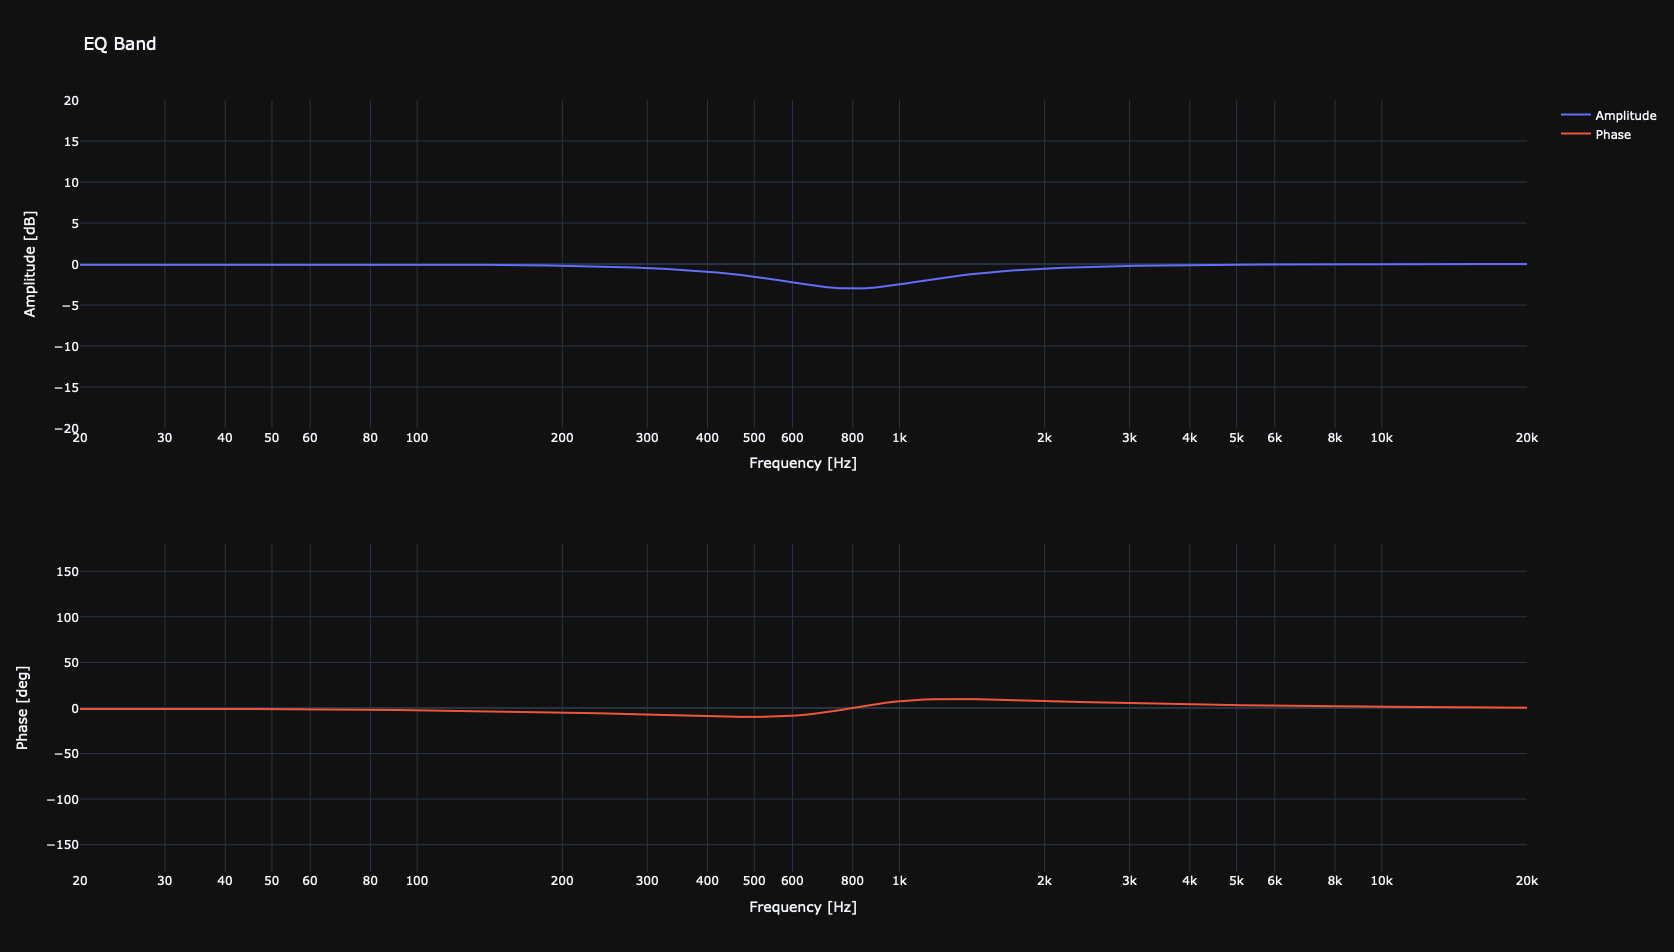
Filter plots show the frequency response (Bode plot) of filters applied using eq_band(plot_filter_bode=True), highpass(plot_filter_bode=True), or lowpass(plot_filter_bode=True).
3. Dynamics Plots
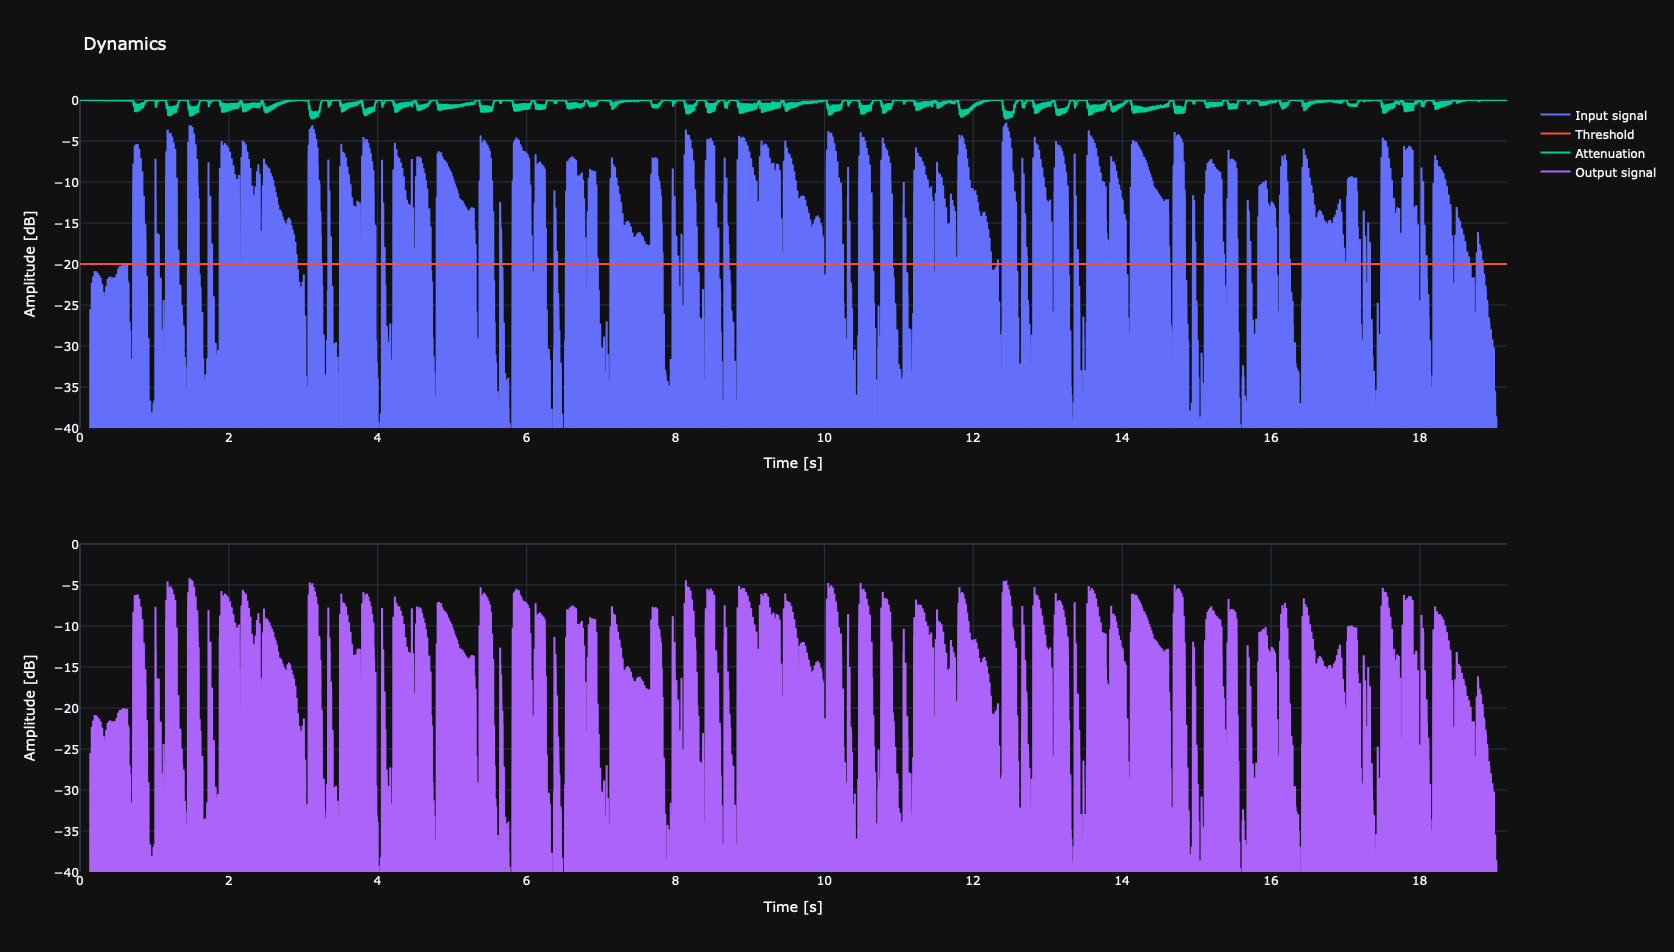
Dynamics plots visualize the response of compressors and limiters applied to a channel. Generated by compressor(plot_compressor_response=True) or limiter(plot_limiter_response=True)


Download files
Download the file for your platform. If you're not sure which to choose, learn more about installing packages.
Source Distribution
Built Distribution
Filter files by name, interpreter, ABI, and platform.
If you're not sure about the file name format, learn more about wheel file names.
Copy a direct link to the current filters
File details
Details for the file audio_toolset-0.1.0.tar.gz.
File metadata
- Download URL: audio_toolset-0.1.0.tar.gz
- Upload date:
- Size: 39.9 kB
- Tags: Source
- Uploaded using Trusted Publishing? Yes
- Uploaded via: uv/0.8.14
File hashes
| Algorithm | Hash digest | |
|---|---|---|
| SHA256 |
cdd4aa2e4f3d80cc362d297b14af923b9c9ed7198c73b8a9868dca5c4218108e
|
|
| MD5 |
74a4e6348639ba90556f87faec7a2c5f
|
|
| BLAKE2b-256 |
fe9161a8c05c6474286dc374f4c2f9a52b2ad41432c1924f9af49da4224c76e0
|
File details
Details for the file audio_toolset-0.1.0-py3-none-any.whl.
File metadata
- Download URL: audio_toolset-0.1.0-py3-none-any.whl
- Upload date:
- Size: 15.4 kB
- Tags: Python 3
- Uploaded using Trusted Publishing? Yes
- Uploaded via: uv/0.8.14
File hashes
| Algorithm | Hash digest | |
|---|---|---|
| SHA256 |
344f1ab55ba3cb4b18206bf05e18f091dbee0d1d1c831c8475c0c3ea42d81e44
|
|
| MD5 |
801b6848b32f45aabcb2f3949f7466bb
|
|
| BLAKE2b-256 |
dbb9df8e8bbc035ebf594f235ab185f4695a4cf6828be20c2066f27fed2409a4
|






