
Bar Chart Race


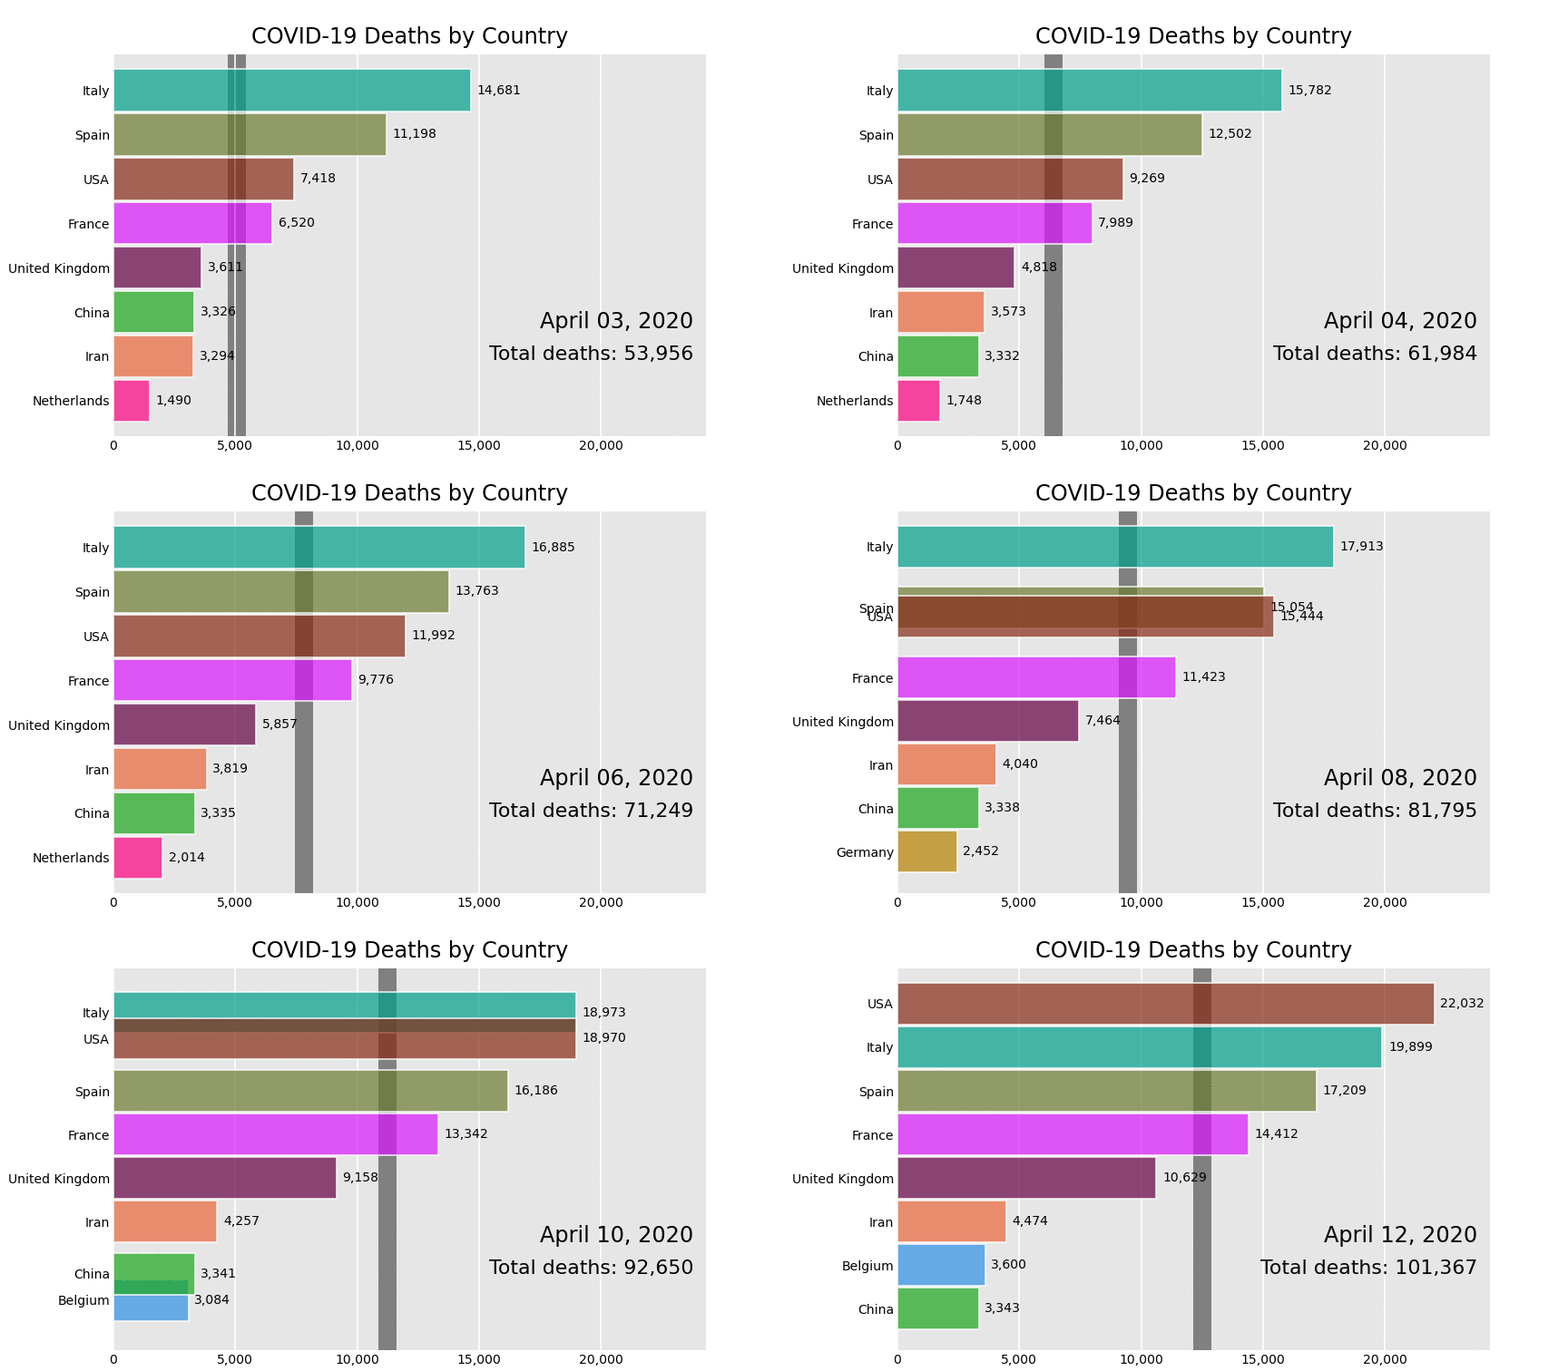
Make animated bar chart races in Python with matplotlib.
Official Documentation
Visit the bar_chart_race official documentation for detailed usage instructions.
Installation
Install with either:
pip install bar_chart_raceconda install -c conda-forge bar_chart_race
Quickstart
Must begin with a pandas DataFrame containing 'wide' data where:
- Every row represents a single period of time
- Each column holds the value for a particular category
- The index contains the time component (optional)
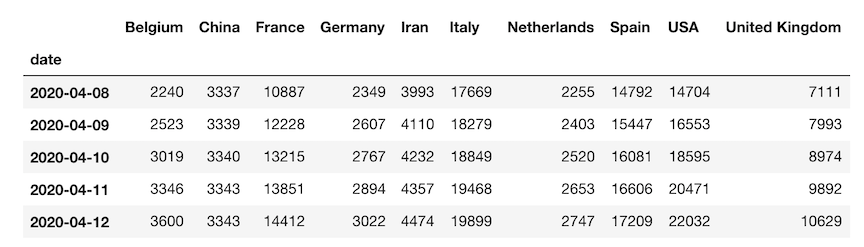
The data below is an example of properly formatted data. It shows total deaths from COVID-19 for several countries by date.
Main function - bar_chart_race
There is one main function, bar_chart_race, which we use to recreate the above video. All parameters are shown with their default value except for filename and title.
import bar_chart_race as bcr
df = bcr.load_dataset('covid19_tutorial')
bcr.bar_chart_race(
    df=df,
    filename='covid19_horiz.mp4',
    orientation='h',
    sort='desc',
    n_bars=6,
    fixed_order=False,
    fixed_max=True,
    steps_per_period=10,
    interpolate_period=False,
    label_bars=True,
    bar_size=.95,
    period_label={'x': .99, 'y': .25, 'ha': 'right', 'va': 'center'},
    period_fmt='%B %d, %Y',
    period_summary_func=lambda v, r: {'x': .99, 'y': .18,
                                      's': f'Total deaths: {v.nlargest(6).sum():,.0f}',
                                      'ha': 'right', 'size': 8, 'family': 'Courier New'},
    perpendicular_bar_func='median',
    period_length=500,
    figsize=(5, 3),
    dpi=144,
    cmap='dark12',
    title='COVID-19 Deaths by Country',
    title_size='',
    bar_label_size=7,
    tick_label_size=7,
    shared_fontdict={'family' : 'Helvetica', 'color' : '.1'},
    scale='linear',
    writer=None,
    fig=None,
    bar_kwargs={'alpha': .7},
    filter_column_colors=False)
Save animation to disk or return HTML
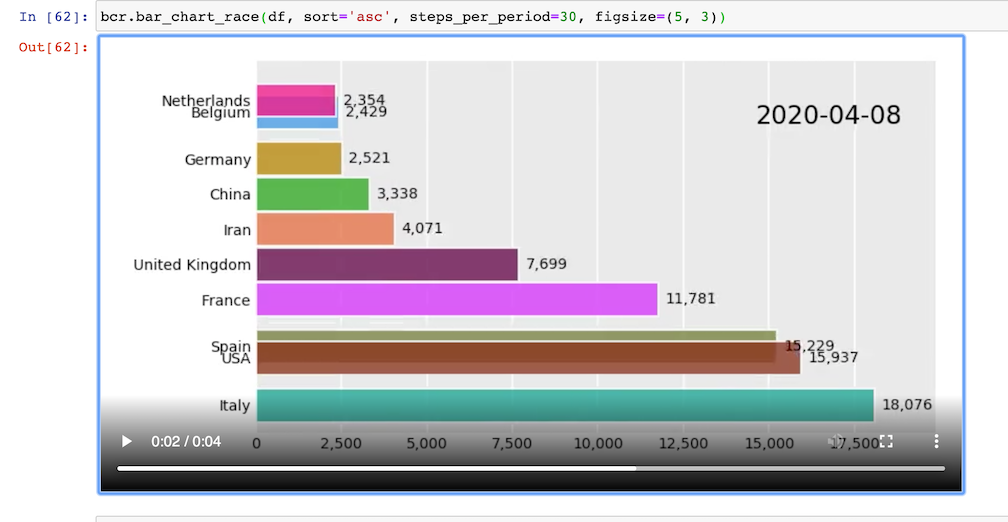
Leave the filename parameter as None to return the animation as HTML. If you are running a Jupyter Notebook, it will automatically be embedded into it.
bcr.bar_chart_race(df=df, filename=None)
Customization
There are many options to customize the bar chart race to get the animation you desire. Below, we have an animation where the maximum x-value and order of the bars are set for the entire duration. A custom summary label and perpendicular bar of median is also added.
def period_summary(values, ranks):
    top2 = values.nlargest(2)
    leader = top2.index[0]
    lead = top2.iloc[0] - top2.iloc[1]
    s = f'{leader} by {lead:.0f}'
    return {'s': s, 'x': .95, 'y': .07, 'ha': 'right', 'size': 8}

bcr.bar_chart_race(df_baseball, period_length=1000,
                   fixed_max=True, fixed_order=True, n_bars=10,
                   figsize=(5, 3), period_fmt='Season {x:,.0f}',
                   title='Top 10 Home Run Hitters by Season Played')

1 maintainer

Metadata
1 maintainer
Release files for bar-chart-race 0.1.0
For a detailed explanation of source distributions (sdists) and built distributions (wheels), please see the package formats documentation.
Source distribution (sdist)
| File | Size | Uploaded | Provenance | Actions |
|---|---|---|---|---|
| bar_chart_race-0.1.0.tar.gz | 155.0 kB | Without provenance | Details for bar_chart_race-0.1.0.tar.gz |
Built distribution (wheel)
| File | Interpreter | ABI | Platform | Actions Reset |
|---|---|---|---|---|
| bar_chart_race-0.1.0-py3-none-any.whl | Python 3 | none | any | Details for bar_chart_race-0.1.0-py3-none-any.whl |
Total release size: 311.8 kB
Release files / bar_chart_race-0.1.0.tar.gz
| Download URL | bar_chart_race-0.1.0.tar.gz |
|---|---|
| Size | 155.0 kB |
| Tags | Source |
|
SHA-256 checksum How to use checksums |
4c5554d0991548e43ce9226a28b8dae5a7f7a9955f5523ba36364d61d4701b1b
|
|
BLAKE2b-256 checksum How to use checksums |
95dea7143a557e82e28310f4ca6eb7d42f6bfd76dcf7bb731ae58a41afb8b330
|
| Upload date | |
|
Uploaded using Trusted Publishing? What is trusted publishing? |
No |
| Uploaded via |
twine/3.1.1 pkginfo/1.5.0.1 requests/2.23.0 setuptools/46.4.0.post20200518 requests-toolbelt/0.9.1 tqdm/4.46.0 CPython/3.8.3
|
Release files / bar_chart_race-0.1.0-py3-none-any.whl
| Download URL | bar_chart_race-0.1.0-py3-none-any.whl |
|---|---|
| Size | 156.8 kB |
| Tags | Python 3 |
|
SHA-256 checksum How to use checksums |
e5233f3e4e92029e02d2c0ef8de89c16eed384ab07f9a7413041b5d2122477df
|
|
BLAKE2b-256 checksum How to use checksums |
0901f6d1a1a0978b39560843c54be7349804d7d2faef0a869acd7c8a6fc920b0
|
| Upload date | |
|
Uploaded using Trusted Publishing? What is trusted publishing? |
No |
| Uploaded via |
twine/3.1.1 pkginfo/1.5.0.1 requests/2.23.0 setuptools/46.4.0.post20200518 requests-toolbelt/0.9.1 tqdm/4.46.0 CPython/3.8.3
|
Security for bar-chart-race 0.1.0
Provenance
Provenance describes where a file came from. On PyPI, provenance is shared via attestations, which provide a verifiable record of the build or publishing details. View details, limitations and caveats.
No provenance found
None of the files in this release were uploaded with provenance metadata.
A note on package security
PyPI is a repository for distributing packages, not a service for auditing them. While third-party security researchers and our staff do their best to detect and remove malicious packages, PyPI cannot guarantee the quality, security or suitability of any given package.
To learn more about protecting yourself from malicious actors, visit our package security documentation.














