Generate a cool bar in bar chart

Project description
barinbar


A Python package for creating bar-in-bar charts and treemap bar charts using Matplotlib.
Inspiration
This package was created in response to discussions and implementations of bar-in-bar charts across different platforms:
- Original LinkedIn Post by Colin Tomb: Link
- Tableau Implementation (Kevin Flerlage, Sebastine Amede, Darragh Murray, Brittany Rosenau): Blog Post
- R Implementation (Brian Julius): Post
- Deneb Implementation (Daniel Marsh-Patrick): Blog Post
This package aims to provide straightforward Python (Matplotlib) alternatives.
Installation
pip install barinbar
(Note: This assumes the package is published on PyPI.)
Development Setup (using Poetry)
If you want to contribute or run the code locally:
- Install Poetry: Follow the instructions on the official Poetry website.
- Clone the repository:
git clone <your-repo-url>
cd barinbar
- Install dependencies: This command creates a virtual environment and installs all dependencies (including development tools).
poetry install --with dev # Use --with dev instead of --all-extras for newer Poetry
- Activate the virtual environment:
poetry shell - Now you can run scripts or linters, e.g.,
python barinbar/plot.py.
Requirements
- Python >= 3.10
matplotlibpandasnumpysquarify
Usage
Bar-in-Bar Chart
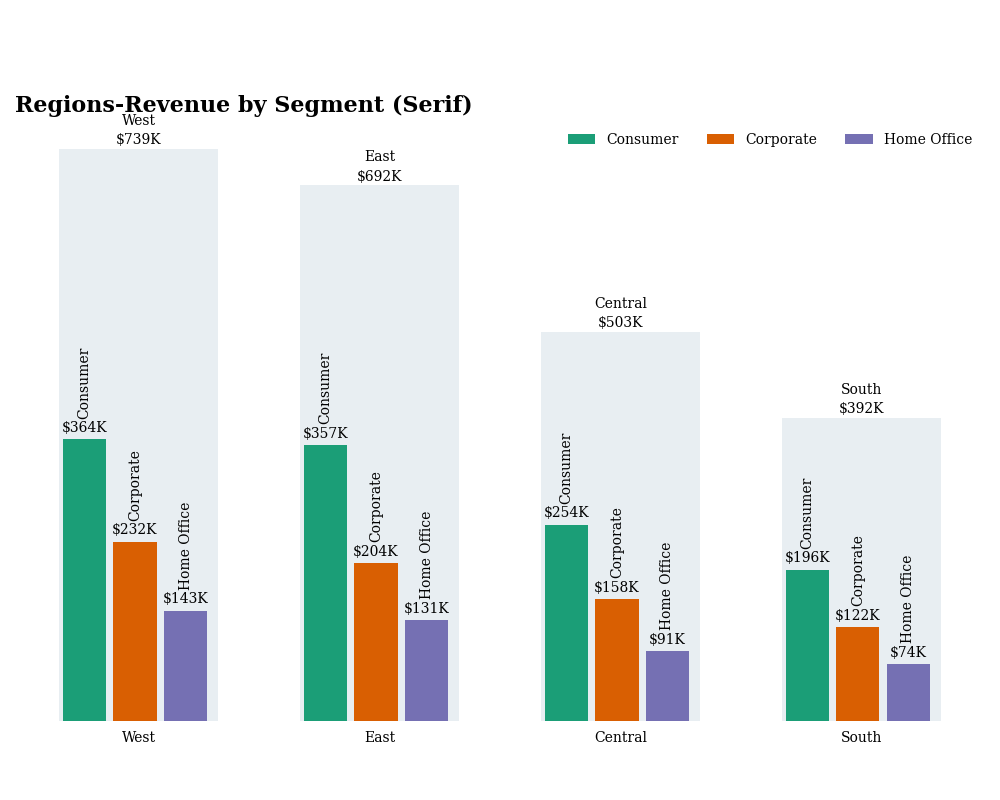
The main function is plot_bar_in_bar. It requires a pandas DataFrame structured with columns for the main category, sub-category, segment value, and total category value.
import pandas as pd
from barinbar import plot_bar_in_bar, BarinbarStyle, plot_treemap_bars # Import from package root
from matplotlib.cm import get_cmap
import numpy as np # Import numpy

# 1. Prepare your data
data = {
    "Region": ["West"]*3 + ["East"]*3 + ["Central"]*3 + ["South"]*3,
    "Segment": ["Consumer", "Corporate", "Home Office"] * 4,
    "Revenue": [364, 232, 143, 357, 204, 131, 254, 158, 91, 196, 122, 74],
}
revenues = pd.DataFrame(data)

# Calculate totals per main category
region_totals = revenues.groupby("Region")["Revenue"].sum().reset_index()
region_totals = region_totals.rename(columns={"Revenue": "TotalRevenue"})

# Merge totals back into the main DataFrame
revenues = pd.merge(revenues, region_totals, on="Region")

# Sorting is now handled internally by _prepare_data

# 2. Define Styling (Optional)
default_color_palette = get_cmap("Dark2")
custom_colors = {
    "Consumer": default_color_palette(0),
    "Corporate": default_color_palette(1),
    "Home Office": default_color_palette(2),
}
my_style = BarinbarStyle(
    fontname='serif',
    colors=custom_colors,
    figsize=(12, 7)
)

# 3. Plot the chart
# Example with total background width
print("Plotting Bar-in-Bar (Total Background)...")
plot_bar_in_bar(
    df=revenues.copy(),
    category_col="Region",
    subcategory_col="Segment",
    value_col="Revenue",
    total_col="TotalRevenue",
    title="Revenue by Region and Segment (Background=Total Width)",
    style=my_style,
    back_ground_width="total" # Specify background width option
)

# Example with single background width
print("Plotting Bar-in-Bar (Single Background)...")
plot_bar_in_bar(
    df=revenues.copy(),
    category_col="Region",
    subcategory_col="Segment",
    value_col="Revenue",
    total_col="TotalRevenue",
    title="Revenue by Region and Segment (Background=Single Width)",
    style=my_style,
    back_ground_width="single" # Specify background width option
)
Treemap Bars Chart
The plot_treemap_bars function generates horizontally arranged treemaps, where each treemap represents a group, and the rectangles within represent categories. The width of each treemap is consistent, while its height is proportional to the total value of the group. Groups are sorted left-to-right from highest total value to lowest.
# (Assuming 'revenues' DataFrame and 'my_style' from previous example)

print("Plotting Treemap Bars...")
plot_treemap_bars(
    df=revenues.copy(),
    category_col="Segment",  # Categories within each treemap box
    group_col="Region",      # How data is grouped into separate treemaps
    value_col="Revenue",     # Determines size and height scaling
    title="Regional Revenue Distribution by Segment (Treemap)",
    figsize=(14, 7),         # Adjust figsize as needed
    value_format_str="${value}K",
    fontname=my_style.fontname, # Reuse font from style
    base_palette="tab10",     # Choose a suitable palette
)
This will generate and display the respective charts.
Customization
You can customize the appearance of the bar-in-bar chart by creating an instance of the BarinbarStyle dataclass and modifying its attributes (e.g., figsize, colors, fontname, fontsize, background_color). Pass this style object to the plot_bar_in_bar function.
For plot_treemap_bars, customization is done via function arguments like figsize, value_format_str, fontname, and base_palette.
from barinbar import BarinbarStyle # Import from package root

custom_style = BarinbarStyle(
    background_color="#F0F0F0",
    figsize=(10, 6),
    fontsize=18,
    small_fontsize=11,
    fontname="Arial",
    colors={"Consumer": "blue", "Corporate": "green", "Home Office": "red"}
)

# ... then pass `style=custom_style` to the plot_bar_in_bar function
License
This project is licensed under the MIT License - see the LICENSE file for details.
Author
- Daniel Vecera - daniel.vecera@outlook.com
Release history Release notifications | RSS feed


Download files
Download the file for your platform. If you're not sure which to choose, learn more about installing packages.
Source Distribution
Built Distribution
Filter files by name, interpreter, ABI, and platform.
If you're not sure about the file name format, learn more about wheel file names.
Copy a direct link to the current filters
File details
Details for the file barinbar-0.2.0.tar.gz.
File metadata
- Download URL: barinbar-0.2.0.tar.gz
- Upload date:
- Size: 13.5 kB
- Tags: Source
- Uploaded using Trusted Publishing? No
- Uploaded via: poetry/2.0.0 CPython/3.13.1 Windows/11
File hashes
| Algorithm | Hash digest | |
|---|---|---|
| SHA256 |
404bdd51290dbe94b60366d6d8cc7aec8c75b44d81fc5b10105bcde1f76d0788
|
|
| MD5 |
e712b66fea654953770fb832c1174722
|
|
| BLAKE2b-256 |
a92e64c7b7415cafaaddbad81a837e9a7e0904753b3428b57b38466164ea25e4
|
File details
Details for the file barinbar-0.2.0-py3-none-any.whl.
File metadata
- Download URL: barinbar-0.2.0-py3-none-any.whl
- Upload date:
- Size: 14.1 kB
- Tags: Python 3
- Uploaded using Trusted Publishing? No
- Uploaded via: poetry/2.0.0 CPython/3.13.1 Windows/11
File hashes
| Algorithm | Hash digest | |
|---|---|---|
| SHA256 |
9d639d450982808bca2fd220d0303e7c48a3f0a661981a1d1e62a5ec12da922d
|
|
| MD5 |
d3fbdaede116c4b9ff2ba2510a7e92c7
|
|
| BLAKE2b-256 |
cb60817730be674e15400df0d6c3827669123aa79c816a1cec9094b712f9956b
|


