Python package for interactive visualization of imaging-based spatial transcriptomics (KoLab-MERFISH edition).

Project description
BellaVista
BellaVista is a visualization tool utilizing the napari viewer for interactive exploration of imaging-based spatial transcriptomic data. This BellaVista release is designed for data already processed through the KoLab-MERFISH pipeline. BellaVista can be used to visualize the 4 key dataset components of each KoLab-MERFISH dataset: (1) Cell boundary & nuclear images (WGA & DAPI), (2) Cell segmentation boundaries, (3) Transcript locations, (4) Cell network connectivity graphs. Note: BellaVista is purely a visualization tool - it does not perform data processing or analysis :)
Quick Start (with sample data)
This short demo will load a sample FOV from the TAC mouse heart. BellaVista is installed and run via the command line. Run the steps below in the Terminal (macOS/Linux) or PowerShell (Windows) application.
Note: BellaVista requires a monitor display to render images in the napari viewer.
1. Install uv
# macOS/Linux
curl -LsSf https://astral.sh/uv/install.sh | sh

# Windows
powershell -ExecutionPolicy ByPass -c "irm https://astral.sh/uv/install.ps1 | iex"
Important: Restart the shell (close and reopen the terminal) to complete the installation.
2. Launch BellaVista
uvx -p 3.12 bellavista
Linux note: If you see the error:
Could not load the Qt platform plugin "xcb" in "" even though it was found.Install the required system libraries:sudo apt install libxcb-cursor0 libxkbcommon-x11-0 libxcb-xinerama0. Then re-run step 2!
NOTE: It will take a few minutes to download and create the required data files. The terminal will print updates & display progress bars for time consuming steps. The sample data is a single FOV from the TAC mouse heart and is ~17MB.
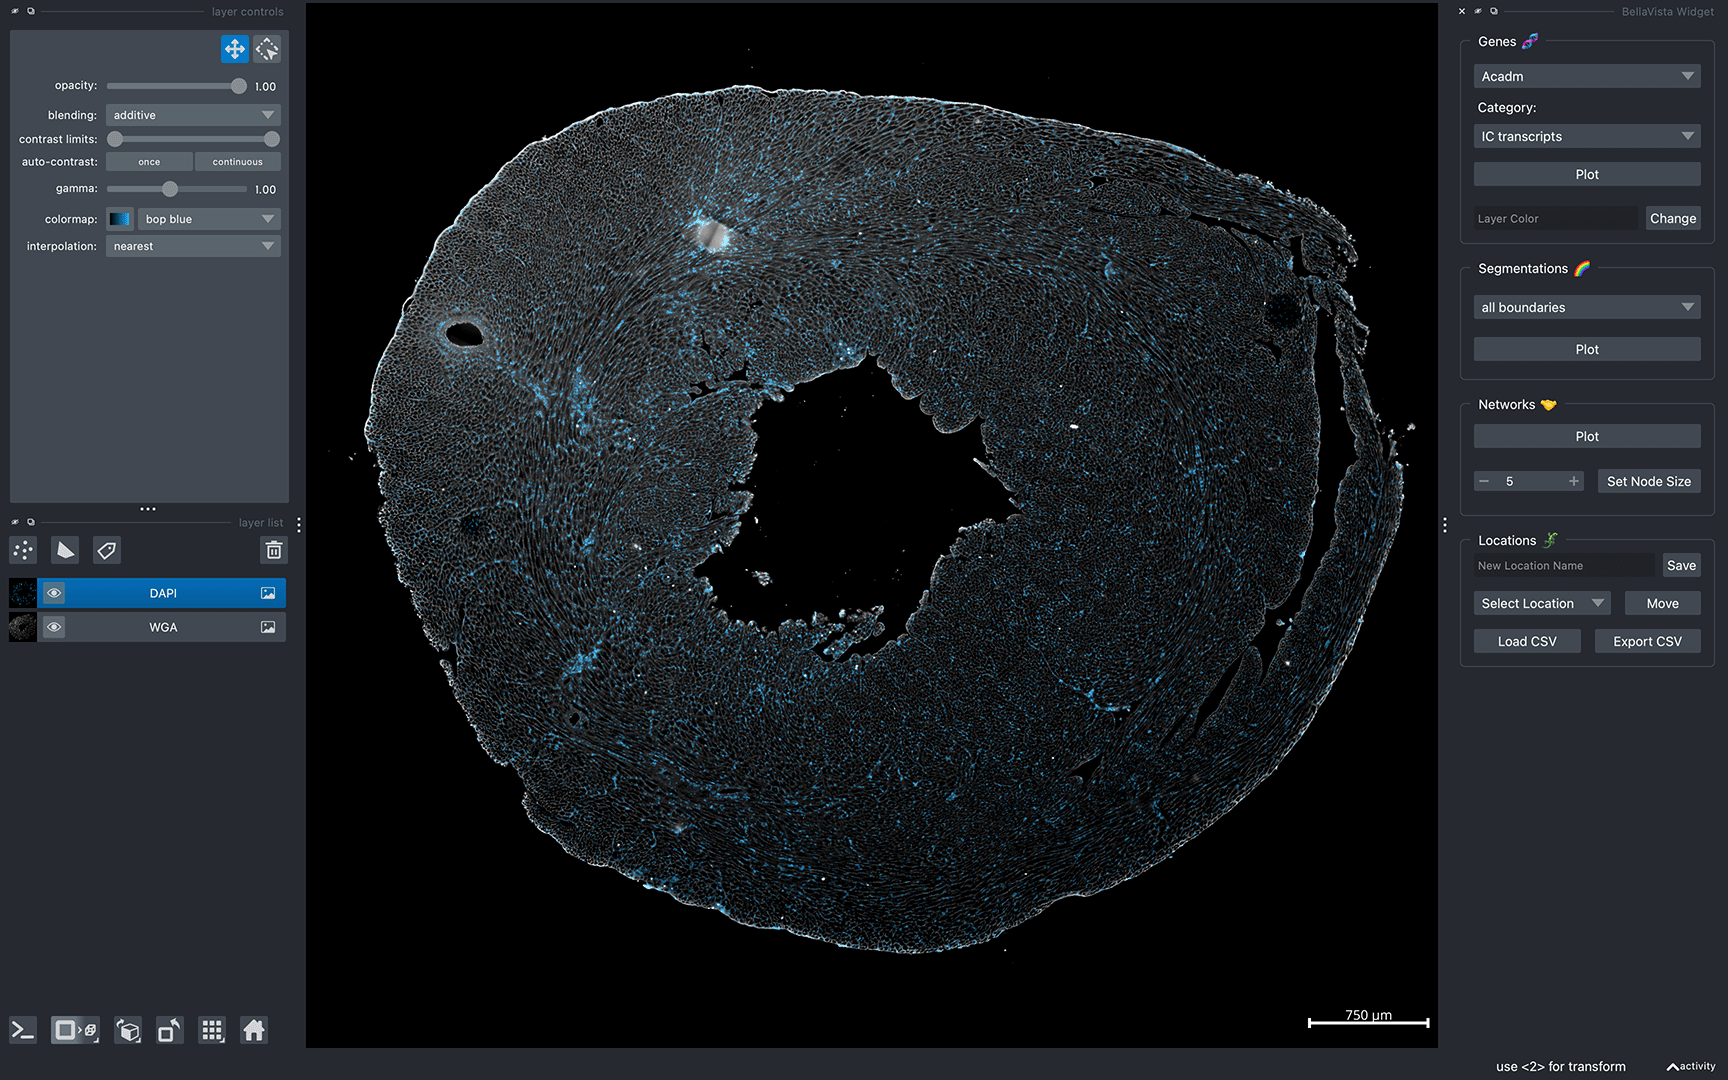
After successfully loading BellaVista, you should see the message Data Loaded! in the terminal. A napari window should appear displaying the sample data similar to the image below:
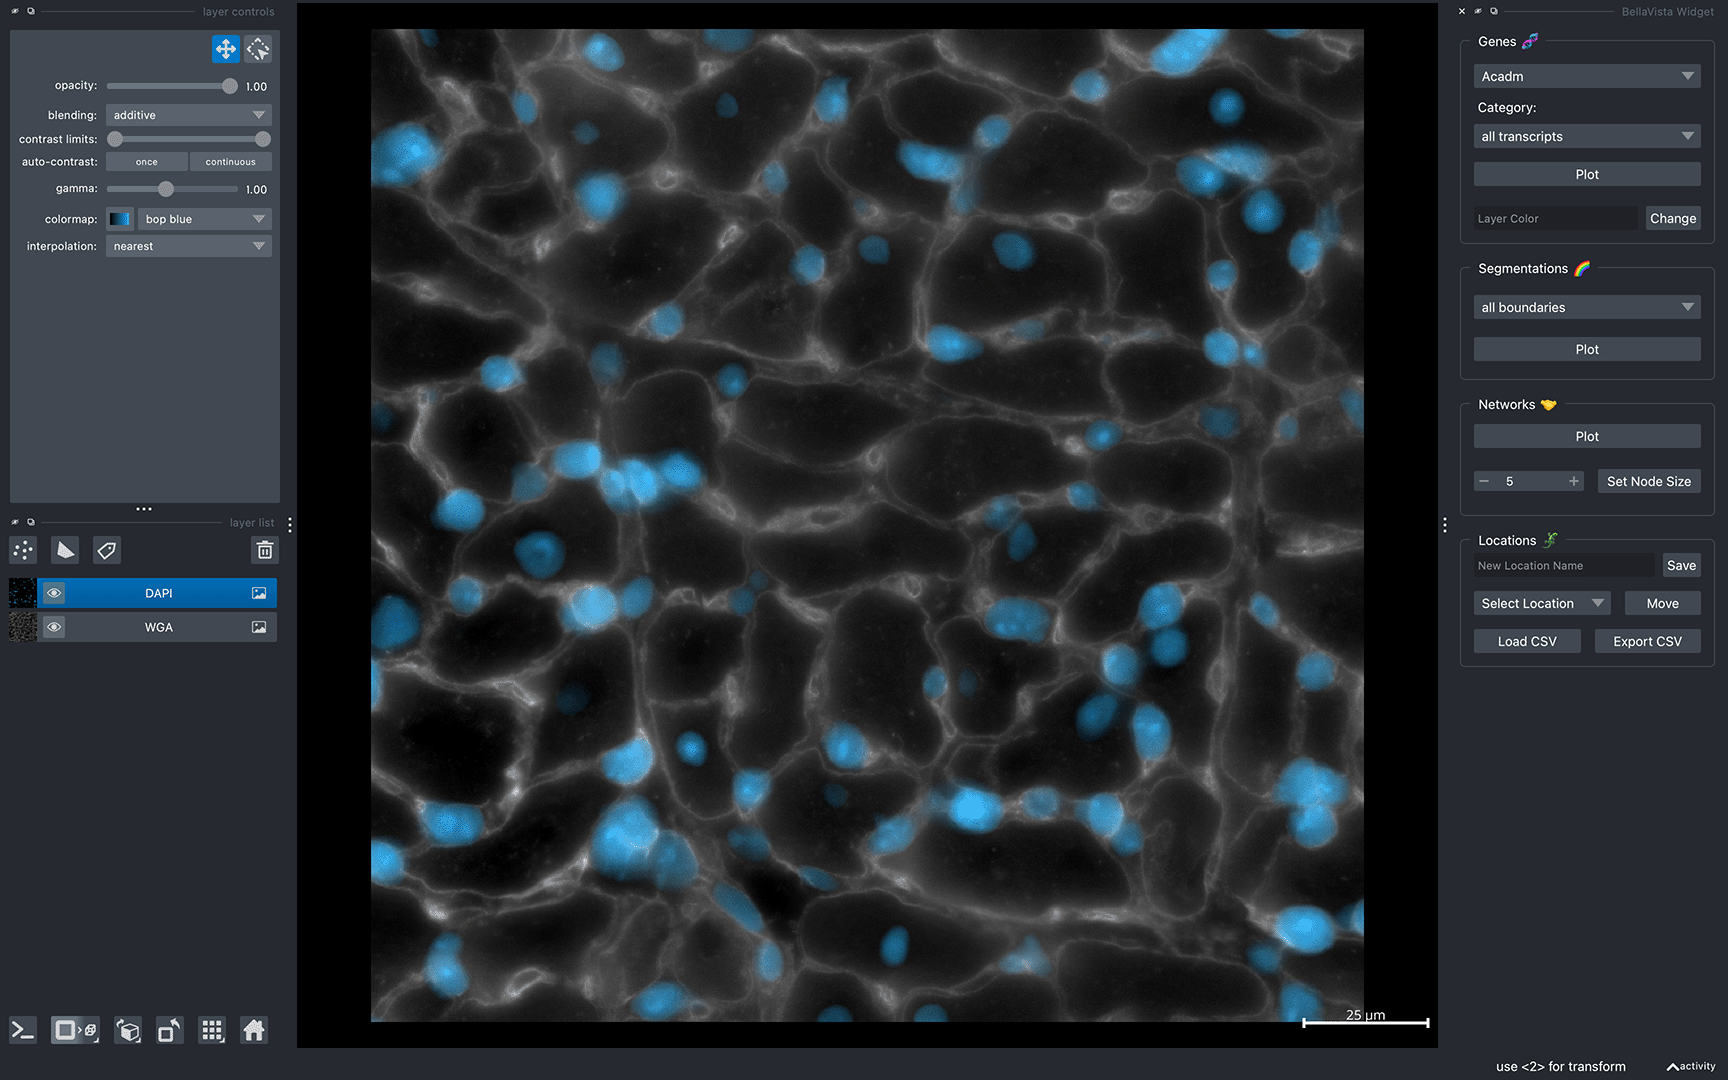
Now, you can interactively move around the napari canvas to explore the data. Try zooming in & out, plotting cell-type-specific transcripts, cell boundaries, and cell networks!
BellaVista Widget Menu
BellaVista uses the napari interface and features a widget located on the right side of the napari window to plot each dataset feature. The widget has four components:
Gene Widget
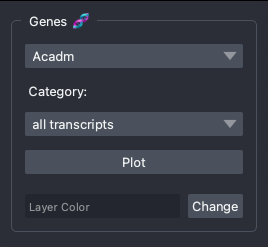
The gene widget features a dropdown menu with the genes in the gene panel, and a dropdown menu to select cell-type-specific transcripts.
- "all transcripts" = all transcript molecules (un-partitioned) -- this includes all transcripts, both transcripts assigned to cells and unassigned transcripts
- "CM transcripts" = cardiomyocyte transcripts
- "EC transcripts" = endothelial cell transcripts
- "IC transcripts" = immune cell transcripts
- "FB transcripts" = fibroblast transcripts
- "CM 1-2-3 transcripts" = cardiomyocyte transcripts from CM1, CM2 & CM3 subclusters (spatially-scrubbed)
To plot the transcripts from a gene, select the gene from the dropdown gene list, select your cell-type of interest, then press Plot! Each individual transcript molecule will be plotted as a single point. The layer color is random, and can be changed using the "Layer Color" text input & button. The input color value can be provided as a hexcode value e.g. #FF00FF or by name e.g. Magenta.
Segmentation Widget
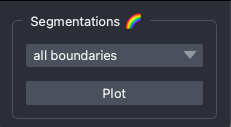
The segmentation widget features a dropdown menu with cell-type-specific cell segmentation boundaries.
- "all boundaries" = all segmentation mask boundaries
- "CM boundaries" = cardiomyocyte boundaries
- "EC boundaries" = endothelial cell boundaries
- "IC boundaries" = immune cell boundaries
- "FB boundaries" = fibroblast boundaries
- "CM 1-2-3 boundaries" = cardiomyocyte boundaries from CM1, CM2 & CM3 subclusters (spatially-scrubbed)
The boundaries for each cell type will be colored as follows: CM: pink, EC: green, IC: blue, FB: yellow. To change the color of the cell boundaries, use the "colormap" option on the layer control menu. For the best visualization, you should select a colormap starting with "single-hue"!
Network Widget
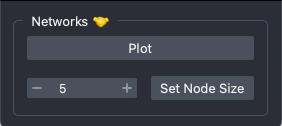
The network widget can be used to plot the cell connectivity networks. The centroid of each cell is plotted as a node (napari point layer), and is colored by its corresponding cell type: CM: pink, EC: green, IC: blue, FB: yellow. Cardiomyocyte->cell-type-specific edges are plotted, and are colored by the cell-type identity of the corresponding cardiomyocyte's neighbor. Note: this network is cardiomyocyte centric, meaning if two cells are connected, but neither is a cardiomyocyte, then the connection will not be shown.
Location Widget
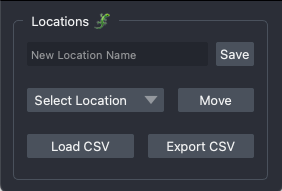
The location widget can be used to save and move to marked camera coordinates. Additionally, the "Load CSV" & "Export CSV" buttons can be used to export your saved locations or load previously saved locations from a previous session.
NOTE: If the input files for a feature was not provided or an error occurred during data processing, the corresponding widget may not be available. A detailed log file
error_log.logcan be found in theBellaVista_outputssubfolder inside the data folder.
That's it for the quick start!
Visualizing full MERFISH datasets
We will share the commands to visualize the Sham and TAC datasets from the mouse heart, including the private url-links. To visualize a dataset hosted on the web, use the following single-line command:
uvx -p 3.12 bellavista --dataset-url "url-link-to-dataset"
NOTE: We recommend having at least 16GB of RAM and 10GB of disk space available to download and visualize the full Sham and TAC datasets. The files will be downloaded and extracted in the folder you're currently in (working directory of your terminal).
Each dataset contains WGA & DAPI images, tens-of-thousands of cells, and hundreds-of-millions of transcripts. For visualization, these data will be converted to visualization files that will also require approximately the same amount of space as the raw datasets. So please keep this in mind when downloading the data!
It will take a few minutes to download and create the required data files. The terminal will print updates & display progress bars for time consuming steps.
Example terminal outputs
Creating BellaVista input files for KoLab-MERFISH:
Processing WGA image... WGA OME-Zarr image saved successfully!
Processing DAPI image... DAPI OME-Zarr image saved successfully!
Processing Transcripts/all_transcripts.csv.gz: 100%|██████████████| 140/140
Processing Transcripts/CM_1-2-3_transcripts.csv.gz: 100%|█████████| 140/140
Processing Transcripts/CM_transcripts.csv.gz: 100%|███████████████| 140/140
Processing Transcripts/EC_transcripts.csv.gz: 100%|███████████████| 140/140
Processing Transcripts/FB_transcripts.csv.gz: 100%|███████████████| 140/140
Processing Transcripts/IC_transcripts.csv.gz: 100%|███████████████| 140/140
Processing CellBoundaries/all_boundaries.csv.gz: 100%|█████████████| 84335/84335
Processing CellBoundaries/CM_1-2-3_boundaries.csv.gz: 100%|████████| 33512/33512
Processing CellBoundaries/CM_boundaries.csv.gz: 100%|██████████████| 42333/42333
Processing CellBoundaries/EC_boundaries.csv.gz: 100%|██████████████| 22540/22540
Processing CellBoundaries/FB_boundaries.csv.gz: 100%|██████████████| 13052/13052
Processing CellBoundaries/IC_boundaries.csv.gz: 100%|██████████████| 6410/6410
Processing cell network graph nodes: 100%|█████████████████████████| 76984/76984
Processing CM network graph edges: 100%|███████████████████████████| 39532/39532
Processing EC network graph edges: 100%|███████████████████████████| 45939/45939
Processing IC network graph edges: 100%|███████████████████████████| 11888/11888
Processing FB network graph edges: 100%|███████████████████████████| 21467/21467
BellaVista input files created!

Data Loaded!
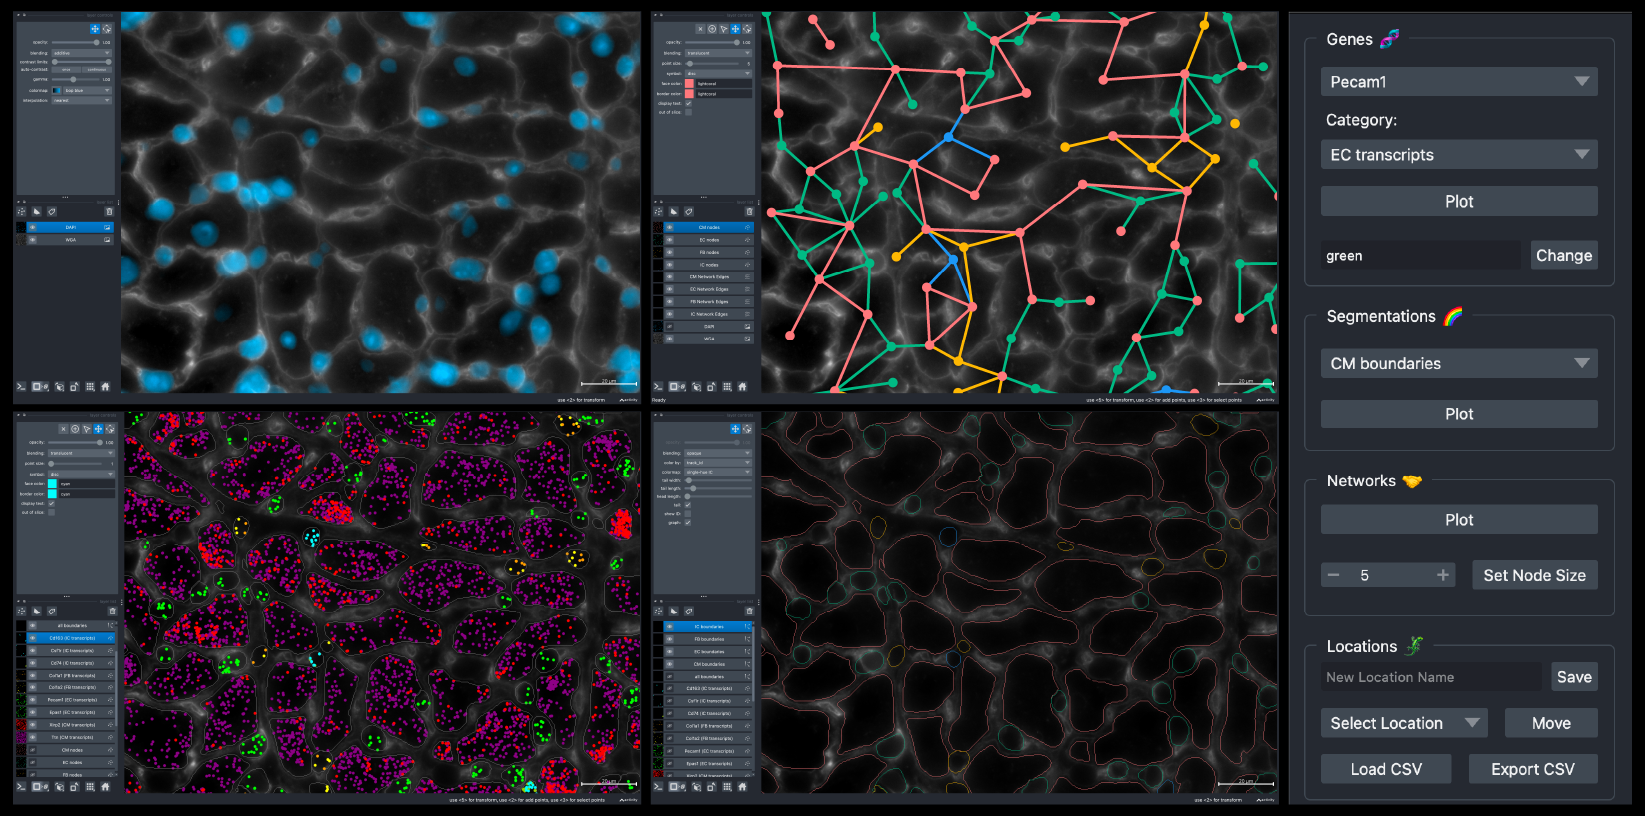
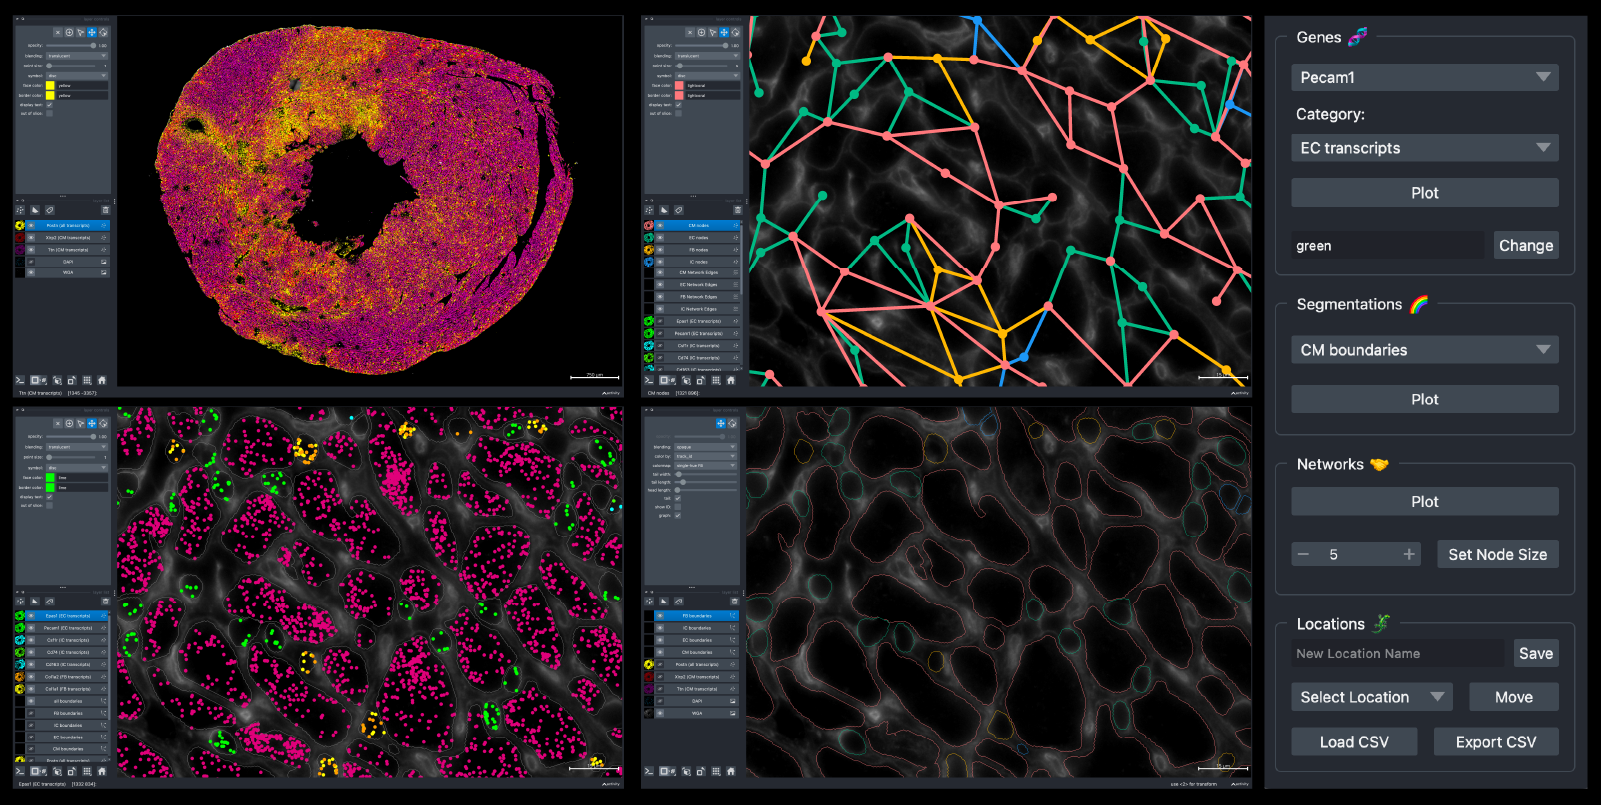
After successfully launching BellaVista, you should see the message Data Loaded! in the terminal. A napari window should appear displaying the data similar to the image below (TAC dataset shown here):
Now, you can interactively move around the napari canvas to explore the data. Try zooming in & out, plotting cell-type-specific transcripts, cell boundaries, and cell networks!
That's it for the example Sham and TAC datasets!
Release history Release notifications | RSS feed


Download files
Download the file for your platform. If you're not sure which to choose, learn more about installing packages.
Source Distribution
Built Distribution
Filter files by name, interpreter, ABI, and platform.
If you're not sure about the file name format, learn more about wheel file names.
Copy a direct link to the current filters
File details
Details for the file bellavista-0.1.0.tar.gz.
File metadata
- Download URL: bellavista-0.1.0.tar.gz
- Upload date:
- Size: 3.4 MB
- Tags: Source
- Uploaded using Trusted Publishing? No
- Uploaded via: twine/6.2.0 CPython/3.10.9
File hashes
| Algorithm | Hash digest | |
|---|---|---|
| SHA256 |
d4edb66acbdc3c471167f3a98d0c0ec333101a6c117437336335973dacc4cb7a
|
|
| MD5 |
2ee40ad261b317e62d3fc13fb90bf5b4
|
|
| BLAKE2b-256 |
cdcaadf90aeaf89b2b65fc494098fed4fad014c85b167d673d7c4bf0ff5aed04
|
File details
Details for the file bellavista-0.1.0-py3-none-any.whl.
File metadata
- Download URL: bellavista-0.1.0-py3-none-any.whl
- Upload date:
- Size: 21.1 kB
- Tags: Python 3
- Uploaded using Trusted Publishing? No
- Uploaded via: twine/6.2.0 CPython/3.10.9
File hashes
| Algorithm | Hash digest | |
|---|---|---|
| SHA256 |
9bded61457d5d3d5186dc2e4247437f63c5ba2fef72d9f775ddabe8b700dc8ec
|
|
| MD5 |
d29d81b98513840dc3bbe81d26b37757
|
|
| BLAKE2b-256 |
fe865e96da27dc0474b2fb37bcf00f7f04229abf73d1648c6dbd781f8be730de
|


