Business day axis scale for matplotlib


Project description


busdayaxis
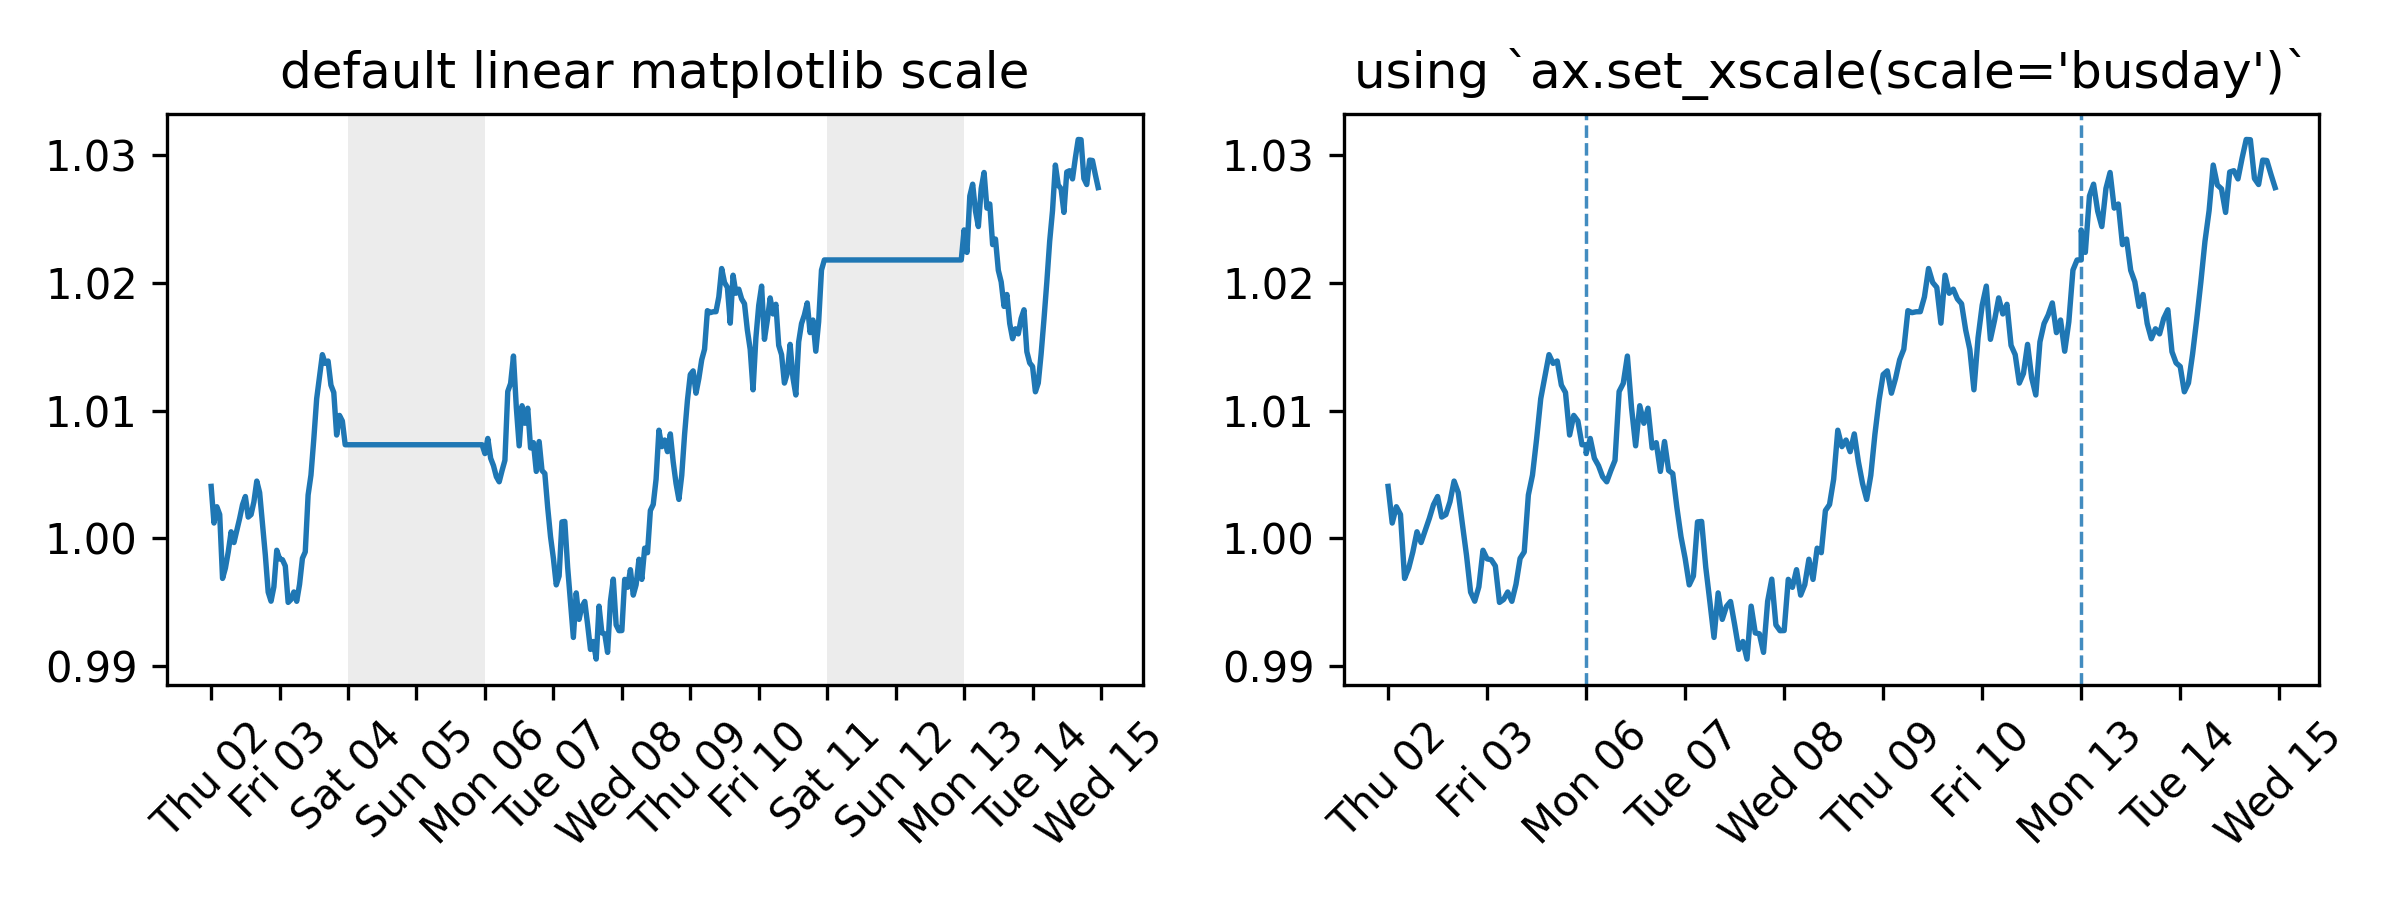
A Matplotlib scale that compresses non-business days and off-hours. Every visible unit on the axis corresponds to active time — no gaps for weekends, holidays, or overnight periods. No data preprocessing needed.
Full documentation at saemeon.github.io/busdayaxis
Installation
pip install busdayaxis
Quick Start
import matplotlib.pyplot as plt
import pandas as pd
import busdayaxis

busdayaxis.register_scale()  # register once at the start of your script

dates = pd.date_range("2026-01-01", periods=10, freq="B")
values = range(len(dates))

fig, ax = plt.subplots()
ax.plot(dates, values)
ax.set_xscale("busday", bushours=(9, 17))  # compress weekends (Mon–Fri default) and off-hours (business hours: 09:00–17:00)
plt.show()
Why
Time series that only evolve on business days — prices, signals, operational metrics — look distorted on a standard calendar axis. Weekends and holidays introduce flat gaps that compress active periods and visually skew slopes. busdayaxis removes these gaps entirely.
What it provides
-
Compress weekends, holidays, and overnight gaps by adding an
axis scalewith a single call:ax.set_xscale("busday", weekmask=..., holidays=..., busdaycal=..., bushours=...)
-
weekmask,holidays,busdaycal: standardnumpy.is_busdayparameters to configure which days are considered business days -
bushours: define uniform or weekday-specific business hours -
Implemented as a proper
matplotlib.scale— autoscaling, shared axes, and all standard artists work without any changes to your plotting code
-
-
Business-day-aware
DateLocatorwrappers for all standardmatplotlib.dateslocators — automatically filter out ticks on off-days and off-hours -
BusdayLocatorbase class to wrap any custom or third-party date locator with the same business-day filtering logic -
MidBusdayLocatorto place a tick at the midpoint of each business session, useful for centering day labels
Under the Hood
-
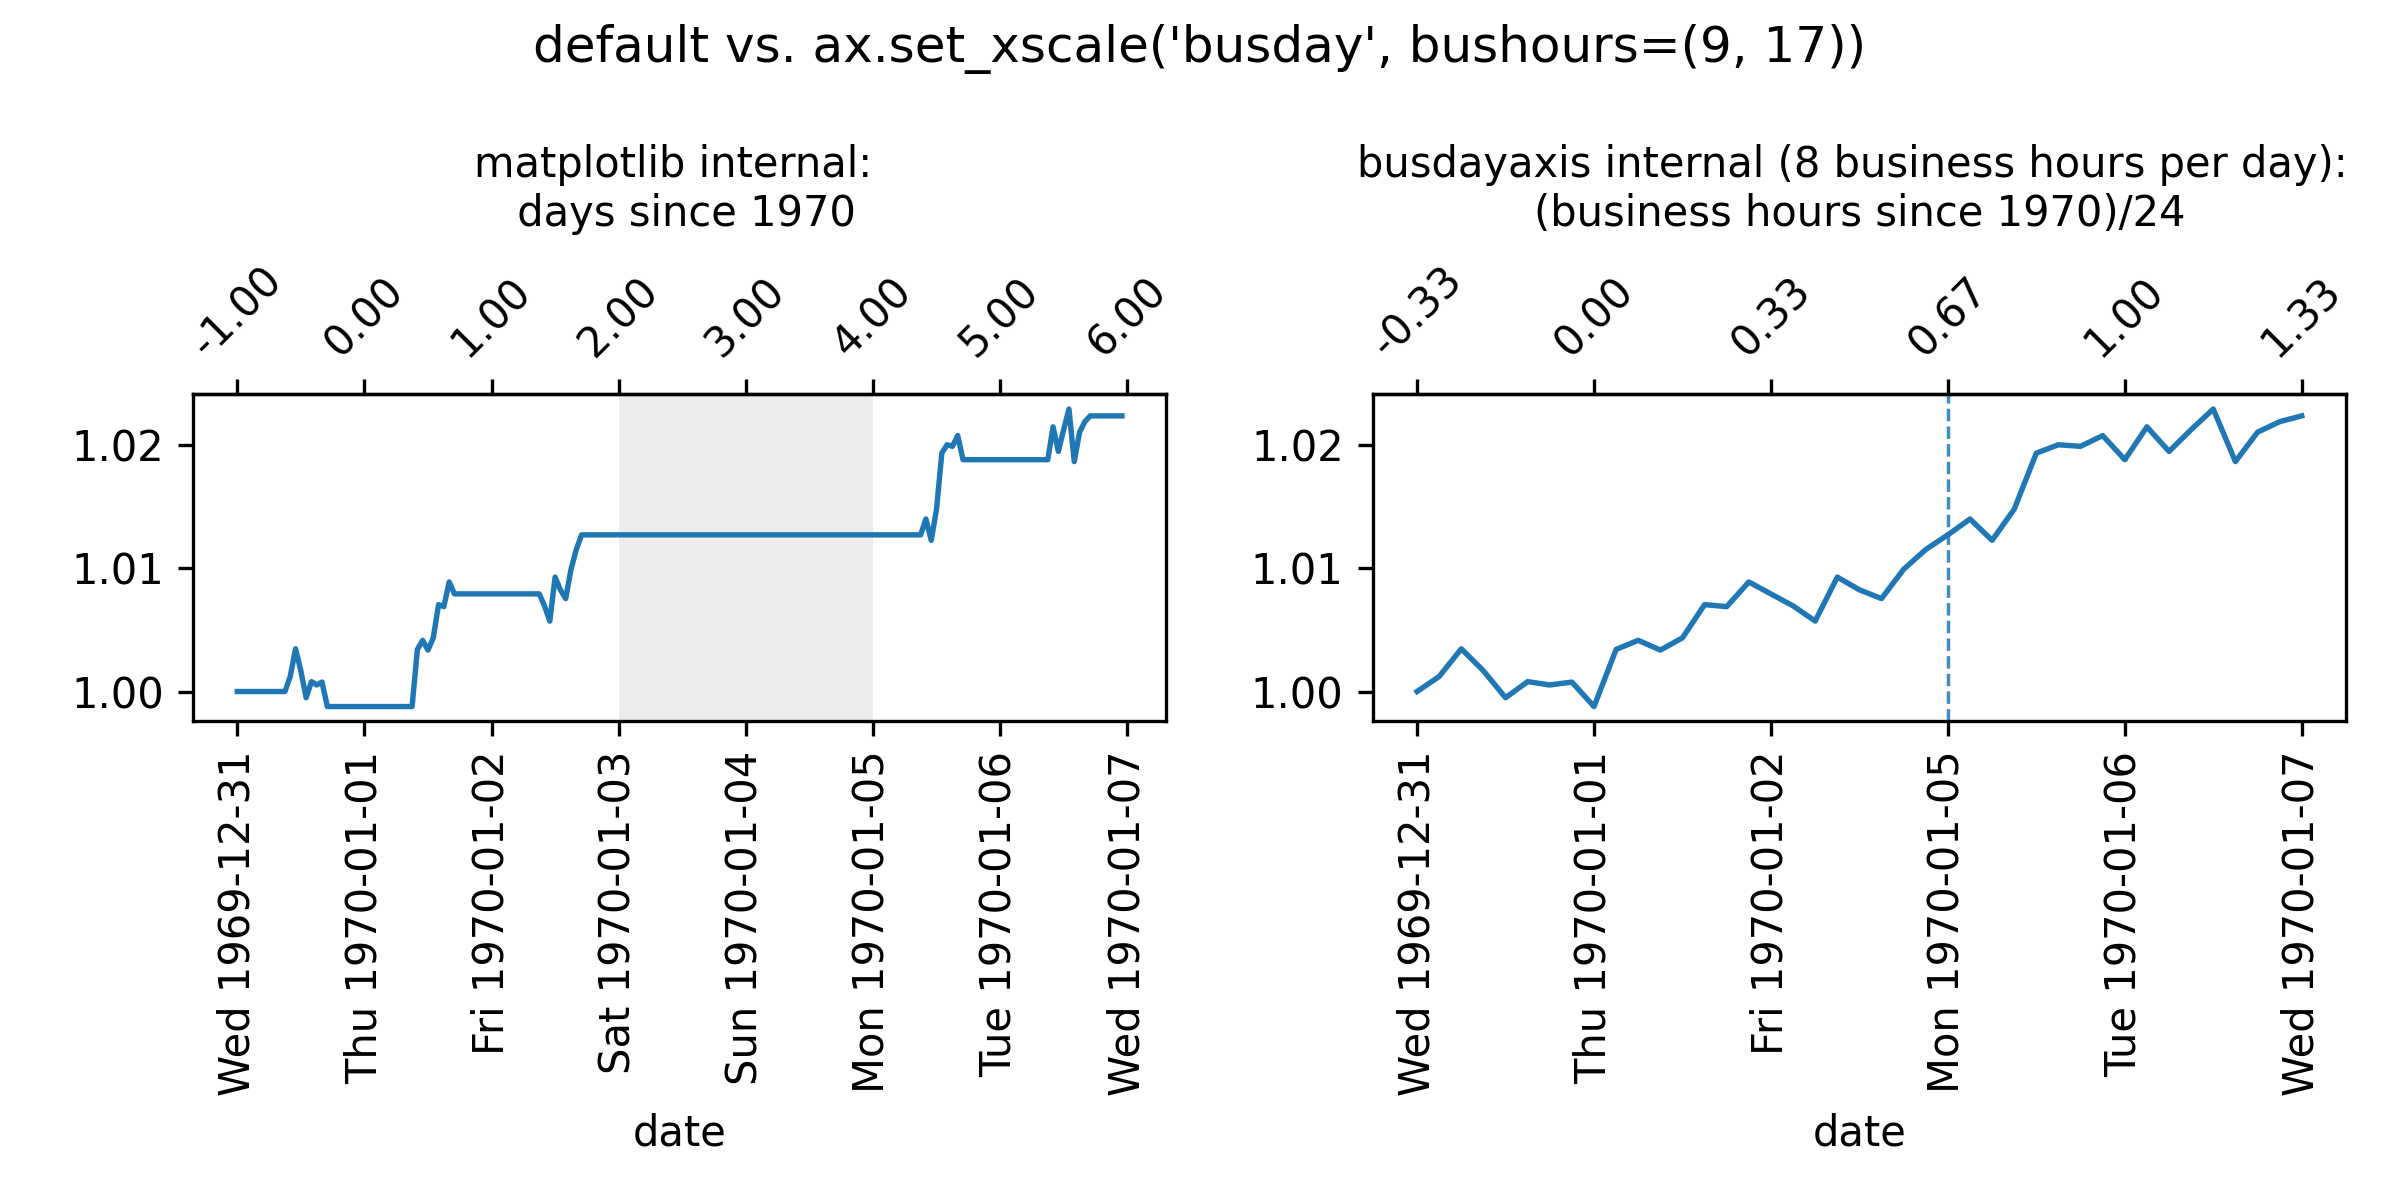
matplotlibinternally handles dates as floating-point numbers representing days since 1970-01-01, or stated alternatively, as$$\text{ matplotlib-representation}=\frac{\text{hours\ since\ 1970-01-01}}{24\ \text{hours}}$$
-
busdayaxistransforms these coordinates to floating-point numbers representing$$\text{busdayaxis-representation} = \frac{\text{business-hours since 1970-01-01}}{24 \text{ hours}}$$
This conversion implies that datetime values that fall on non-business days or outside of business hours will be mapped to the same coordinate as the nearest preceding business hour. For example, if business hours are defined as 9:00 to 17:00, then "1970-01-05 08:00" (Mon 08:00) is mapped to the same coordinate as "1970-01-05 09:00" (Mon 09:00), because the earlier timestamp lies outside the defined business hours.
Example: "1970-01-05 10:00" (Mon 10:00)
-
Matplotlib representation (all hours counted):
Thu 1970-01-01 24h (00:00 - 24:00) + Fri 1970-01-02 24h (00:00 - 24:00) + Sat 1970-01-03 24h (00:00 - 24:00) + Sun 1970-01-04 24h (00:00 - 24:00) + Mon 1970-01-05 10h (00:00 - 10:00) --------------------------------------- = 106h (Total hours since epoch) / 24h --------------------------------------- = 4.41666... (matplotlib coordinate) -
Busdayaxis representation:
- We assume here that business hours are from 9:00 to 17:00. This can be configured by setting
ax.set_xscale("busday", bushours=(9, 17)).
To get the floating-point representation of "1970-01-05 10:00" (Mon 10:00), we count the business hours that have elapsed since 1970-01-01 00:00:
Thu 1970-01-01 8h (9:00 - 17:00) + Fri 1970-01-02 8h (9:00 - 17:00) + Sat 1970-01-03 0h + Sun 1970-01-04 0h + Mon 1970-01-05 1h (09:00 - 10:00) --------------------------------------- = 17h (business hours since epoch) / 24h --------------------------------------- = 0.708333... (busdayaxis coordinate) - We assume here that business hours are from 9:00 to 17:00. This can be configured by setting
License
BSD 3-Clause


Download files
Download the file for your platform. If you're not sure which to choose, learn more about installing packages.
Source Distribution
Built Distribution
Filter files by name, interpreter, ABI, and platform.
If you're not sure about the file name format, learn more about wheel file names.
Copy a direct link to the current filters
File details
Details for the file busdayaxis-0.1.3.tar.gz.
File metadata
- Download URL: busdayaxis-0.1.3.tar.gz
- Upload date:
- Size: 552.1 kB
- Tags: Source
- Uploaded using Trusted Publishing? No
- Uploaded via: twine/6.1.0 CPython/3.13.7
File hashes
| Algorithm | Hash digest | |
|---|---|---|
| SHA256 |
072515ce30c23003af1fce9eb6595f1e5df3d6cb6c24dd3fa085fda80c7873b9
|
|
| MD5 |
c277bf979e93313dd65396f9cde2e055
|
|
| BLAKE2b-256 |
081585383df1370004a8dbcb988dcd7c7d29a5a8e56526c344d134ad2a67133a
|
File details
Details for the file busdayaxis-0.1.3-py3-none-any.whl.
File metadata
- Download URL: busdayaxis-0.1.3-py3-none-any.whl
- Upload date:
- Size: 15.0 kB
- Tags: Python 3
- Uploaded using Trusted Publishing? No
- Uploaded via: twine/6.1.0 CPython/3.13.7
File hashes
| Algorithm | Hash digest | |
|---|---|---|
| SHA256 |
68d65d72e0e88171b5c6dffe06e8216cad8456aaa4a68c3c1d62813fef98da2b
|
|
| MD5 |
96dc5cfc3c75a20472347decf8a762a8
|
|
| BLAKE2b-256 |
06856628e16deb7c5765c49663304d5a941bd01a7dbdc434530370a0ac183b3e
|


