CanvasXpress for Python

Project description
CanvasXpress Python Library

About CanvasXpress for Python
CanvasXpress was developed as the core visualization component for bioinformatics and systems biology analysis at Bristol-Myers Squibb. It supports a large number of visualizations to display scientific and non-scientific data. CanvasXpress also includes a simple and unobtrusive user interface to explore complex data sets, a sophisticated and unique mechanism to keep track of all user customization for Reproducible Research purposes, as well as an 'out of the box' broadcasting capability to synchronize selected data points across all CanvasXpress plots in a page. Data can be easily sorted, grouped, transposed, transformed or clustered dynamically. The fully customizable mouse events as well as the zooming, panning and drag-and-drop capabilities are features that make this library unique in its class.
CanvasXpress can be now be used within Python for native integration into IPython and Web environments, such as:
Complete examples using the CanvasXpress library including the mouse events, zooming, and broadcasting capabilities are included in this package. This CanvasXpress Python package was created by Dr. Todd C. Brett, with support from Aggregate Genius Inc., in cooperation with the CanvasXpress team.
The maintainer of the Python edition of this package is Dr. Todd C. Brett.
Project Status
| Topic | Status |
|---|---|
| Version and Platform |    |
| Popularity |  |
| Status |      |
Notes
- This project uses older versions of
mkdocandpydoc-markdowndue to a conflict between these packages. Once the conflict is resolved they will be upgraded to current release editions. This only affects doc builds.
Recent Enhancements
2021 June 30: Example code generation utility
CanvasXpress for Python now includes generator.py, which includes
functions for creating example Python code to define and display charts.
generate_canvasxpress_code_from_json will accept a reproducible research
JSON str and generate the corresponding Python code, and
generate_canvasxpress_code_from_json_file will accept a file path reference
to a reproducible JSON to achieve the same thing. Find the functions at
canvasxoress.util.example.generator.py.
2021 June 30: Support for raw text data
CanvasXPress for Javascript can accept text data. CXTextData has been added
as a means by which a str value can be directly provided to the CanvasXpress
for Javascript constructor, and along with that value all assumptions about
transformation or error handling.
2021 June 21: Support for reproducable research JSON
CanvasXpress for Javascript can save JSON representations of a rendered chart.
CanvasXpress now offers from_reproducible_json, which accepts such a JSON
and creates a new CanvasXpress object with all properties updated with the
relevant portions of the JSON.
2021 June 21: CanvasXPress repr now available for example code
The CanvasXpress __repr__ method now produces example Python code for
all properties of the object. The Python built-ineval method can read
the provided string to reconstruct the CanvasXpress object when the proper
imports for the CanvasXpress packages/modules are included in the file.
2021 June 16: CXNoteBook accepts file paths for output
The CXNoteBook class now accepts a file path at which output rendered in
Jupyter will also be captured for viewing in later sessions. Until now a
temporary file had be used, which remains the default behaviour.
2021 June 16: CXConfigs now accepts lists of values
The CXConfigs class can now be initialized using lists of CXConfig objects
or their list/tuple equivalents (e.g., ["label", "value"]). The add
method supports the same formats. Similarly, wherever the CanvasXpress class
accepts a CXConfigs object during initialization or assigment a list of
CXConfig or equivalent objects can be provided. This is in additon to the
already supported dict collections of CXConfig value equivalents.
2021 June 16: direct DataFrame support for CanvasXpress.data
The CanvasXpress class already supported None, CXData, and dict data
assignments. Now raw DataFrame is supported on initialization or use of
the data property.
2021 June 16: pop-up browser support
One or more charts can now be displayed in a new Web page using the default browser for the host system, assuming it is graphical (e.g., MacOS X or Windows). The A Quick Script/Console Example below illustrates the use.
2021 May, June Prior Release Summary
- All JSON data formats now generally supported:
- URL:
- Data path with standard URI formatting (e.g., http, sftp, etc.)
- Standard:
- Matrix and key-pair data
x,y, andzattributes- Missing attributes calculated for easier data integration
- Venn:
- Matrix and key-pair data
vennandlegendattributes- Missing attributes calculated for easier data integration
- Network
- key-pair data
nodeattributes and generaldict/liststructure
- Genome
- key-pair data
tracksandtypeattributes and generaldict/liststructure
- RAW / Passthrough
- Matrix and key-pair
- Beyond conversion of data to JSON, effective pass-through of data
- URL:
- Python
dictdata direct reference inCanvasXpress.dataparameter with auto-coonversion toCXDictData. - Introduction of
CXDataProfileand profiled formatting of incomplete data pergraphTypeconfiguration. - Minor bug fixes and expansion of automated tests.
- Jupyter
CXNoteBookcan now render multiple charts in the same group so as to support broadcasting. CanvasXpressnow supports theafter_renderproperty and initialization value to enable theafterRenderattribute of CanvasXpress for Javascript objects (includes DOE dashboard support).
Roadmap
This package is actively maintained and developed. Our focus for 2021 is:
Immediate Focus
- Detailed documentation and working examples of all Python functionality
General Focus
- Embedded CanvasXpress for JS libraries (etc.) for offline work
- Integraton with dashboard frameworks for easier applet creation
- Continued alignment with the CanvasXpress Javascript library
- Continued stability and security, if/as needed
Getting Started
Documentation
The documentation site contains complete examples and API documentation. There is also a wealth of additional information, including full Javascript API documentation, at https://www.canvasxpress.org.
A Quick Script/Console Example
Charts can be defined in scripts or a console session and then displayed using the default browser, assuming that a graphical browser with Javascript support is available on the host system.
from canvasxpress.canvas import CanvasXpress
from canvasxpress.config.collection import CXConfigs
from canvasxpress.config.type import CXGraphType, CXGraphTypeOptions
from canvasxpress.data.keypair import CXDictData
from canvasxpress.render.popup import CXBrowserPopup

if __name__ == "__main__":
    # Define a CX bar chart with some basic data
    chart: CanvasXpress = CanvasXpress(
        render_to="example_chart",
        data=CXDictData(
            {
                "y": {
                    "vars": ["Gene1"],
                    "smps": ["Smp1", "Smp2", "Smp3"],
                    "data": [[10, 35, 88]]
                }
            }
        ),
        config=CXConfigs(
            CXGraphType(CXGraphTypeOptions.Bar)
        )
    )

    # Display the chart in its own Web page
    browser = CXBrowserPopup(chart)
    browser.render()
Upon running the example the following chart will be displayed on systems such as MacOS X, Windows, and Linux with graphical systems:
A Quick Flask Example
Flask is a popular lean Web development framework for Python based applications. Flask applications can serve Web pages, RESTful APIs, and similar backend service concepts. This example shows how to create a basic Flask application that provides a basic Web page with a CanvasXpress chart composed using Python in the backend.
The concepts in this example equally apply to other frameworks that can serve Web pages, such as Django and Tornado.
Create a Basic Flask App
A basic Flask app provides a means by which:
- A local development server can be started
- A function can respond to a URL
First install Flask and CanvasXpress for Python:
pip install -U Flask canvasxpress
Then create a demo file, such as app.py, and insert:
# save this as app.py
from flask import Flask

app = Flask(__name__)

@app.route('/')
def canvasxpress_example():
    return "Hello!"
On the command line, execute:
flask run
And output similar to the following will be provided:
Running on http://127.0.0.1:5000/ (Press CTRL+C to quit)
Browsing to http://127.0.0.1:5000/ will result in a page with the text
Hello!.
Add a Chart
CanvasXpress for Python can be used to define a chart with various attributes and then generate the necessary HTML and Javascript for proper display in the browser.
Add a templates directory to the same location as the app.py file, and
inside add a file called canvasxpress_example.html. Inside the file add:
<html>
    <head>
        <meta charset="UTF-8">
        <title>Flask CanvasXpress Example</title>

        <!-- 2. Include the CanvasXpress library -->
        <link
                href='https://www.canvasxpress.org/dist/canvasXpress.css'
                rel='stylesheet'
                type='text/css'
        />
        <script
                src='https://www.canvasxpress.org/dist/canvasXpress.min.js'
                type='text/javascript'>
        </script>

        <!-- 3. Include script to initialize object -->
        <script type="text/javascript">
            onReady(function () {
                {{canvas_source|safe}}
            })
        </script>

    </head>
    <body>

        <!-- 1. DOM element where the visualization will be displayed -->
        {{canvas_element|safe}}

    </body>
</html>
The HTML file, which uses Jinja syntax achieves three things:
- Provides a location for a
<div>element that marks where the chart will be placed. - References the CanvasXpress CSS and JS files needed to illustrate and operate the charts.
- Provides a location for the Javascript that will replace the chart
<div>with a working element on page load.
Going back to our Flask app, we can add a basic chart definition with some data to our example function:
from flask import Flask, render_template

from canvasxpress.canvas import CanvasXpress
from canvasxpress.config.collection import CXConfigs
from canvasxpress.config.type import CXGraphType, CXGraphTypeOptions
from canvasxpress.data.keypair import CXDictData

app = Flask(__name__)

@app.route('/')
def canvasxpress_example():
    # Define a CX bar chart with some basic data
    chart: CanvasXpress = CanvasXpress(
        render_to="example_chart",
        data=CXDictData(
            {
                "y": {
                    "vars": ["Gene1"],
                    "smps": ["Smp1", "Smp2", "Smp3"],
                    "data": [[10, 35, 88]]
                }
            }
        ),
        config=CXConfigs(
            CXGraphType(CXGraphTypeOptions.Bar)
        )
    )

    # Get the HTML parts for use in our Web page:
    html_parts: dict = chart.render_to_html_parts()

    # Return a Web page based on canvasxpress_example.html and our HTML parts
    return render_template(
        "canvasxpress_example.html",
        canvas_element=html_parts["cx_canvas"],
        canvas_source=html_parts["cx_js"]
    )
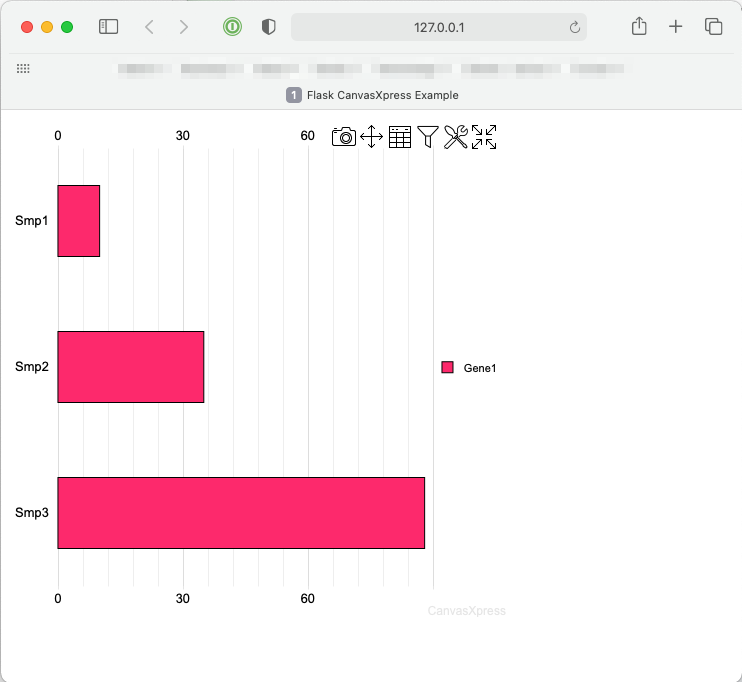
Rerun the flask app on the command line and browse to the indicated IP and URL. A page similar to the following will be displayed:
Congratulations! You have created your first Python-driven CanvasXpress app!
Release history Release notifications | RSS feed


Download files
Download the file for your platform. If you're not sure which to choose, learn more about installing packages.
Source Distribution
File details
Details for the file canvasxpress-2021.6.30.190440.tar.gz.
File metadata
- Download URL: canvasxpress-2021.6.30.190440.tar.gz
- Upload date:
- Size: 46.9 kB
- Tags: Source
- Uploaded using Trusted Publishing? No
- Uploaded via: twine/3.4.1 importlib_metadata/4.6.0 pkginfo/1.7.0 requests/2.25.1 requests-toolbelt/0.9.1 tqdm/4.61.1 CPython/3.9.6
File hashes
| Algorithm | Hash digest | |
|---|---|---|
| SHA256 |
56f0d65bc0f30a8cefed30ebc92c7d85358b80941424f4fe208c34f24ebd4ac6
|
|
| MD5 |
4ae019c776dcbc3728ccd4b1d6c0685a
|
|
| BLAKE2b-256 |
fddd432a246b345870eb1bb45ef8ac11a052c47b5f7cadec98056a82f90564d7
|


