
Interactive single-cell and spatial omics visualization library

Project description
Cellestial







The Grammar of Graphics for single-cell omics.
Cellestial is an interactive and a highly customizable Single-Cell & Spatial omics data visualization library. Built on top Lets-Plot, it offers a ggplot-like layered and modular approach offering high customizability and publication-ready figures.
Cellestial is highly integrated with scverse's AnnData with room for integration with any upcoming single-cell omics data type in the Python single-cell omics ecosystem.
Cellestial leverages the performance of Polars ensuring speed and scalability.
Installation
pip install cellestial
uv add cellestial
poetry add cellestial
Quickstart
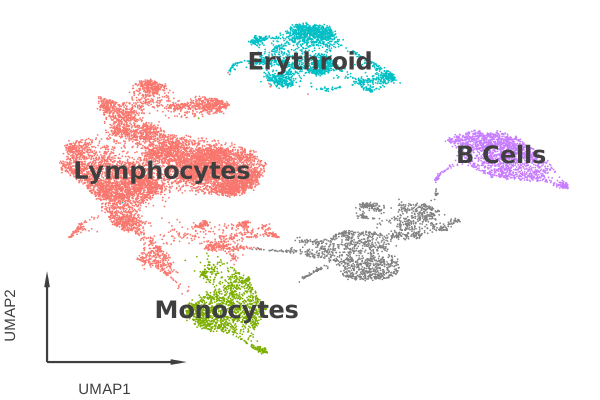
Cellestial accepts a standard AnnData directly. The same function plots a categorical column or a gene, and everything composes through + like ggplot.
from lets_plot import *
import cellestial as cl

data = cl.datasets.pbmc3k(cache_directory="data")

cl.umap(
    data,
    key="cell_type_lvl1",
    axis_type="arrow",
    legend_ondata=True,
) + scale_color_hue()
Examples
Spatial omics
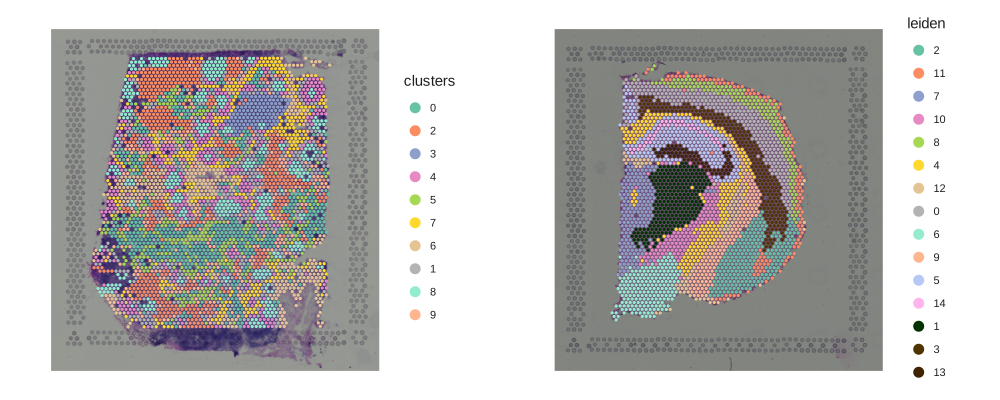
Overlay categorical labels or gene expression on tissue coordinates.
Show code
import squidpy as sq

lymph_node = cl.datasets.human_lymph_node(cache_directory="data")
hne = sq.datasets.visium_hne_adata()

gggrid(
    [
        cl.spatial(lymph_node, key="clusters"),
        cl.spatial(hne, key="leiden"),
    ],
    ncol=2,
) + ggsize(1000, 400)
Dimensionality reduction with layers
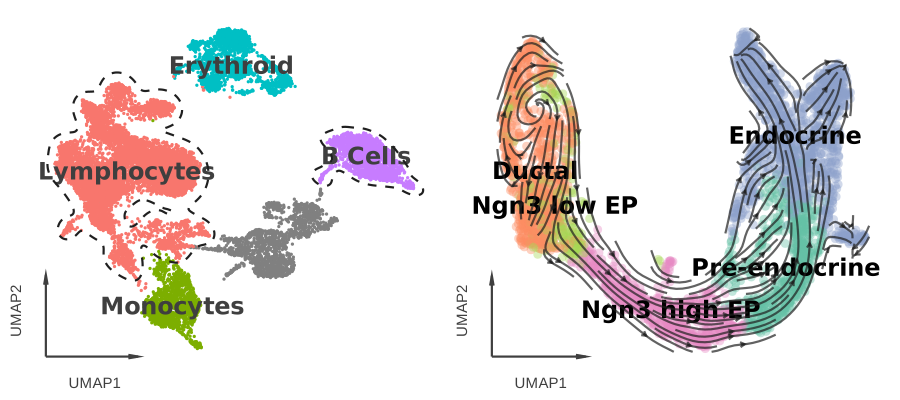
Cellestial ships single-cell-specific layers (cluster_outlines, stream, arrow_axis, ondata_legend) that compose with + like any geom.
Show code
velocity_data = cl.datasets.pancreas(cache_directory="data")

outlined = cl.umap(
    data,
    key="cell_type_lvl1",
    axis_type="arrow",
    size=1.5,
    legend_ondata=True,
) + scale_color_hue() + cl.cluster_outlines(groups=["Lymphocytes", "B Cells"])

streamed = cl.umap(
    velocity_data,
    key="clusters_coarse",
    axis_type="arrow",
    size=4,
    alpha=0.4,
    legend_ondata=True,
    ondata_color="black",
) + cl.stream()

gggrid([outlined, streamed])
Marker genes
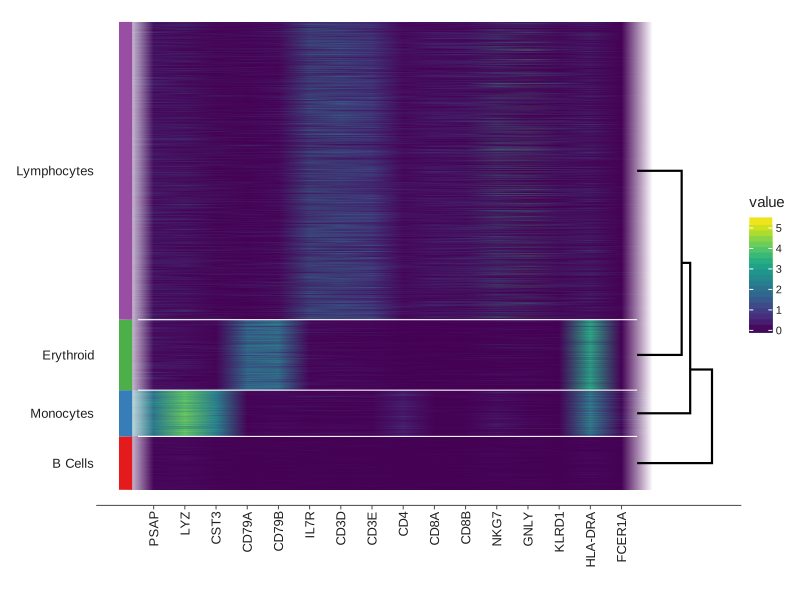
Heatmaps, dotplots, matrixplots and stacked violins share the same call shape and ship with built-in dendrograms and group bars.
Show code
markers = [
    "PSAP", "LYZ", "CST3",          # Monocytes
    "CD79A", "CD79B",                # B cells
    "IL7R", "CD3D", "CD3E", "CD4",   # T cells (CD4+)
    "CD8A", "CD8B",                  # T cells (CD8+)
    "NKG7", "GNLY", "KLRD1",         # NK cells
    "HLA-DRA", "FCER1A",             # Dendritic cells
]

cl.heatmap(
    data,
    group_by="cell_type_lvl1",
    keys=markers,
    geom="raster",
    group_lines_size=0.5,
    group_lines_color="white",
    group_bars=True,
    group_bars_labels=True,
    dendrogram=True,
    dendrogram_size=1,
) + scale_fill_viridis()
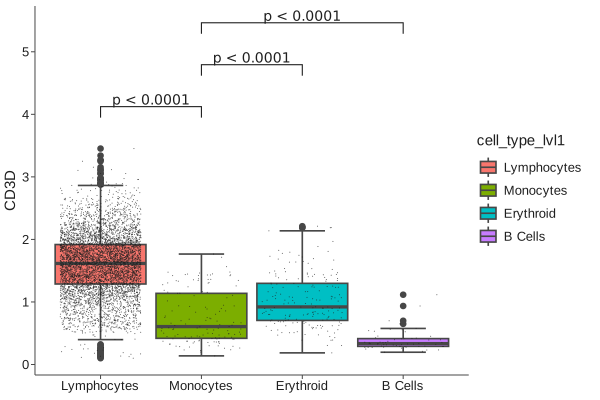
Statistical comparisons
cl.bracket runs pairwise tests on a cl.boxplot or cl.violin and draws annotated significance brackets.
Show code
cl.boxplot(
    data,
    key="CD3D",
    fill="cell_type_lvl1",
    threshold=0.1,
) + scale_fill_hue() + cl.bracket(
    y_padding=0.2,
    label="pvalue",
    prefix="p",
    prefix_style="<",
    comparisons=[
        ("Lymphocytes", "Monocytes"),
        ("Monocytes", "Erythroid"),
        ("Monocytes", "B Cells"),
    ],
)
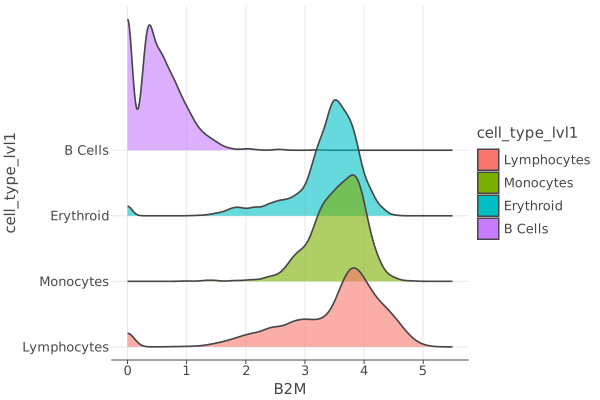
Ridge plots
Quick exploratory views of expression distributions across groups.
Show code
cl.ridge(
    data,
    key="B2M",
    alpha=0.6,
    group_by="cell_type_lvl1",
) + scale_fill_hue()
Migrating from Scanpy
Cellestial mirrors most of scanpy.pl with a few naming shifts:
color=becomeskey=.- Multi-panel calls use a plural function (
cl.umaps,cl.violins, ...). groupbybecomesgroup_by,var_namesbecomeskeys.- Saving is a separate
cl.save(plot, "umap.png")call.
See the migration guide for a side-by-side mapping.
Documentation
- Quickstart — guided tour of the API.
- Features — tooltips, layers, grids, colors, faceting.
- API reference — every function.
- Migrating from Scanpy.
License
Apache 2.0. See LICENSE.
Release history Release notifications | RSS feed


Download files
Download the file for your platform. If you're not sure which to choose, learn more about installing packages.
Source Distribution
Built Distribution
Filter files by name, interpreter, ABI, and platform.
If you're not sure about the file name format, learn more about wheel file names.
Copy a direct link to the current filters
File details
Details for the file cellestial-0.52.0.tar.gz.
File metadata
- Download URL: cellestial-0.52.0.tar.gz
- Upload date:
- Size: 103.2 kB
- Tags: Source
- Uploaded using Trusted Publishing? No
- Uploaded via: poetry/2.3.2 CPython/3.14.5 Darwin/25.5.0
File hashes
| Algorithm | Hash digest | |
|---|---|---|
| SHA256 |
3c485823b162839530bef067bd5042337ee95b1107dfa2410051b3387add141a
|
|
| MD5 |
719fccfae2cbc12760dae2adf2ab9925
|
|
| BLAKE2b-256 |
71e3e0dcccce05520e3873457a26ee7bfda30ad13b4255389283fb2c26826a1f
|
File details
Details for the file cellestial-0.52.0-py3-none-any.whl.
File metadata
- Download URL: cellestial-0.52.0-py3-none-any.whl
- Upload date:
- Size: 150.7 kB
- Tags: Python 3
- Uploaded using Trusted Publishing? No
- Uploaded via: poetry/2.3.2 CPython/3.14.5 Darwin/25.5.0
File hashes
| Algorithm | Hash digest | |
|---|---|---|
| SHA256 |
4280bfbdd62a5e866a73ea3dad5be52b5f27478771c71ce1188d02a827d3cfec
|
|
| MD5 |
bd5e9407c0d61f2de985a581e6f6d69a
|
|
| BLAKE2b-256 |
033fb0e6141363709ce27edb4a9c368cb961b78b3e52c1db0320b9459a64bdb6
|






