
Cellfinder-visualize User Guide
About
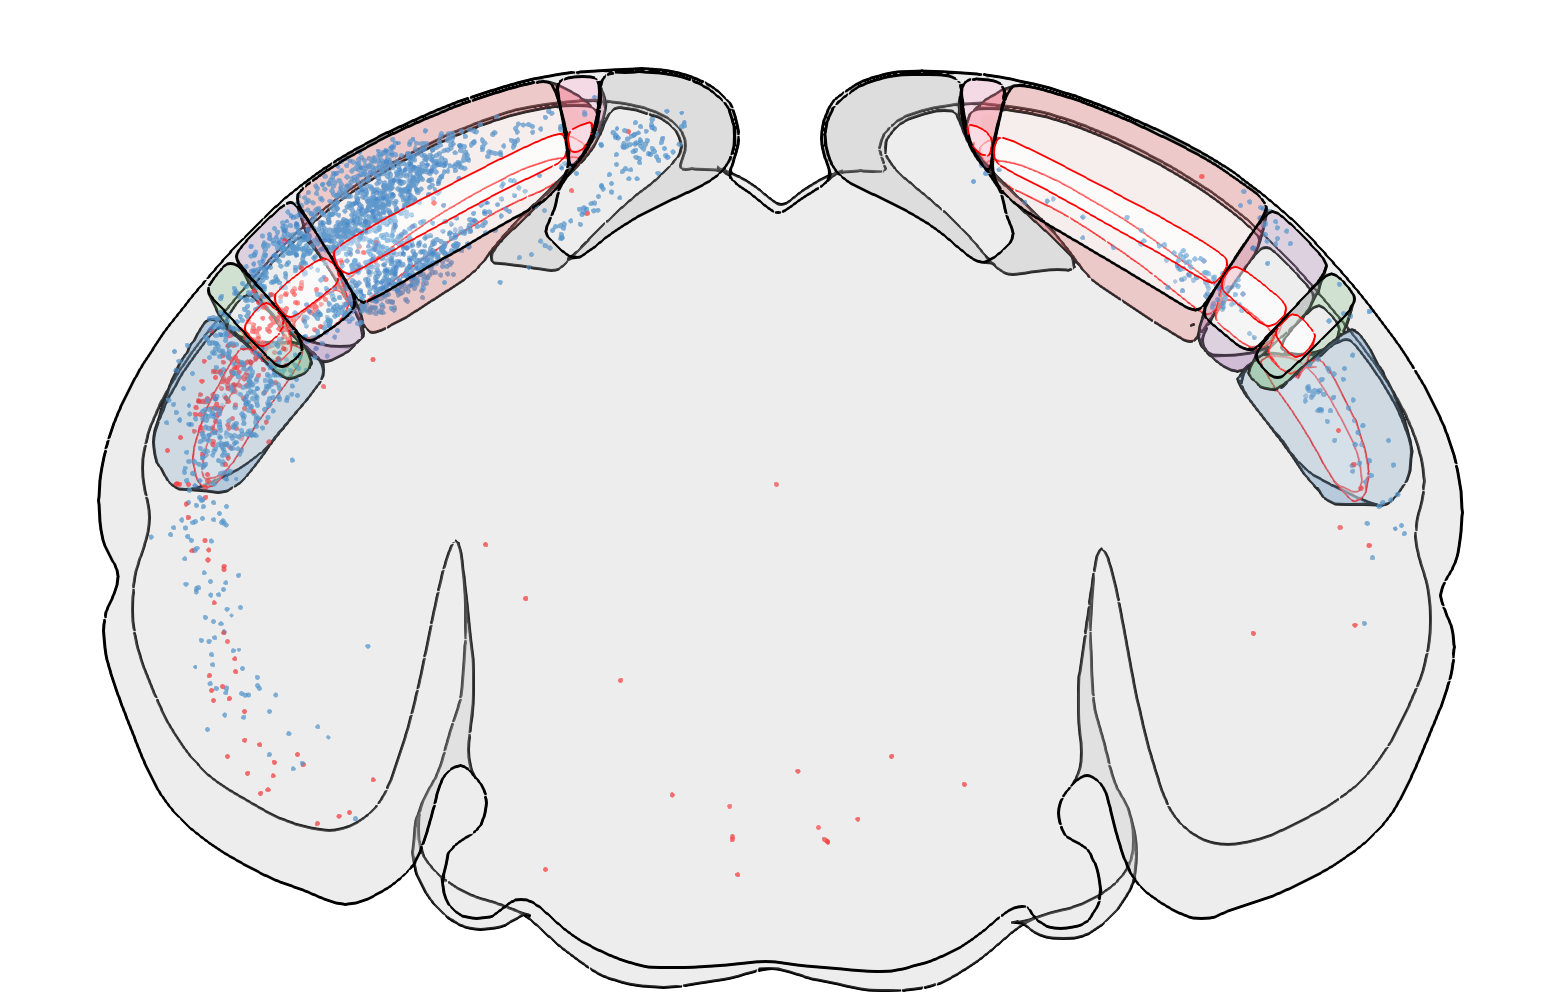
cellfinder-visualize is a tool for post-cellfinder data visualisation and analysis.
The core aims are to provide:
- Publication quality visualisations of cellfinder experiments for multiple samples
- Standardised publication quality plots of cell counts for different region sets
- Easy toggling of regions of interest
- Matching visualisations to quantifications
- Lateralised views
- Slice views
- Statistical analysis (in progress)
cellfinder-visualize is a tool developed by Stephen Lenzi in the Margrie Lab, generously supported by the Sainsbury Wellcome Centre.

Installation
conda create -n cellfinder-visualize python=3.10
conda activate cellfinder-visualize
pip install cellfinder-visualize
Usage
Simply run from the commandline as follows
conda activate cellfinder-visualize
cellfinder_visualize
This will open a GUI for selecting parameters
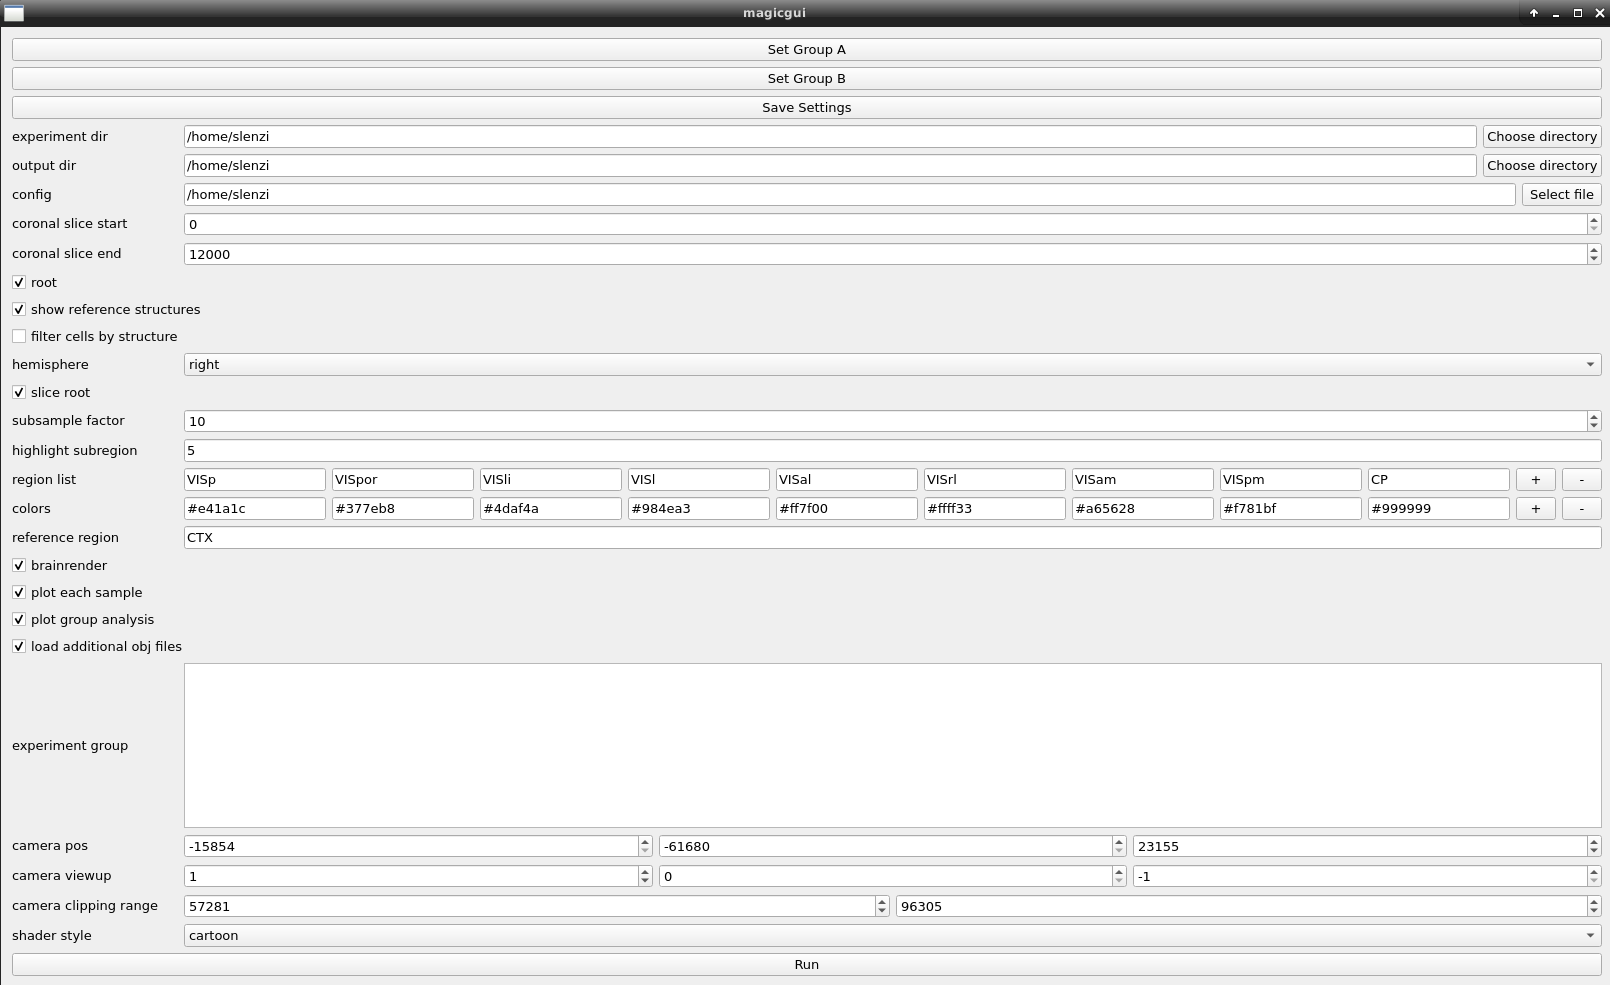
experiment dir should be a directory containing cellfinder output directories. When selected, all subfolders in the selected directory will be displayed and available in the experiment group section in the GUI where they can be selected and assigned a group for running through the analysis.
experiment group sample directories shown under experiment group can be selected and assigned to groups for comparative analysis.
Set Group A when clicked, this button will assign all currently highlighted directories to a single experimental group (group A) for analysis.
Set Group B when clicked, this button will assign all currently highlighted directories to a single experimental group (group B) for analysis.
output dir should be a directory for saving any outputs for your sample
Save Settings when clicked, this button will save the current selected settings to a file called settings.pkl in the output directory that can be loaded again later.
config select a previously saved settings.pkl file to load previous settings into the GUI.
coronal slice start if you want to show only a coronal subsection this value is the start in microns
coronal slice end if you want to show only a coronal subsection this value is the end of that section in microns
root if checked the whole brain outline will be shown
show reference structures if checked, several brain regions will be added for reference only
filter cells by structure if checked, cells displayed will be restricted to the regions listed in region list
hemisphere whether to display and count cells in left/right/both hemispheres
slice root if checked, and a subregion is selected (e.g. only one hemisphere, or a coronal section) then all other unselected regions will not be visible
subsample factor show every nth cell of the number chosen
highlight subregion outlines will be drawn for subregions that contain the string in this box. i.e. if you wanted to highlight layer 5 in displayed regions, then 5 would achieve this.
region list each item in this list will be displayed and included in any analysis
colors color labels that each correspond to items in the region list.
reference region the region used to normalise cell counts to.
brainrender if checked, brainrender will run.
barplots if checked, barplots will be generated of the cell counts.
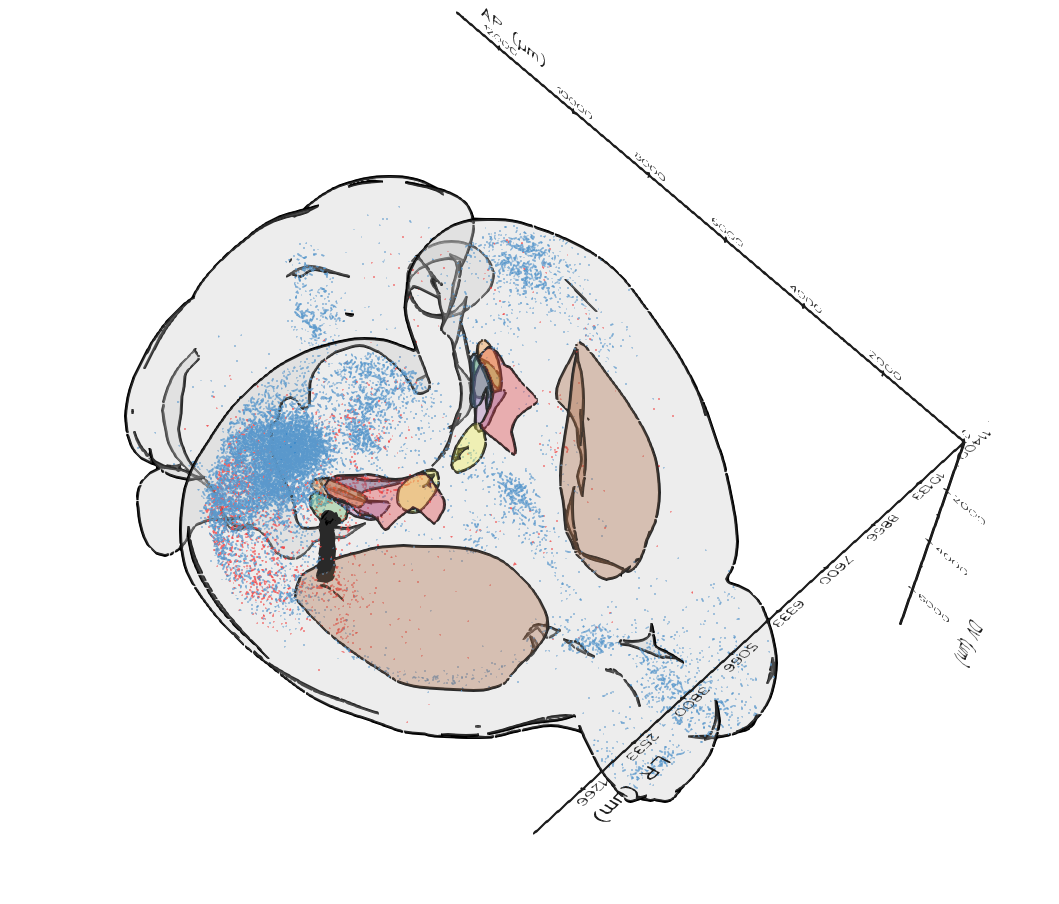
load additional obj files if any .obj files are present in the directory given then they will be rendered in the brainrender view.
camera pos position of the camera in brainrender.
camera viewup the camera "up" direction for brainrender.
camera clipping range the range of clipping the brainrender image.
shader style the shader option to be used in brainrender.
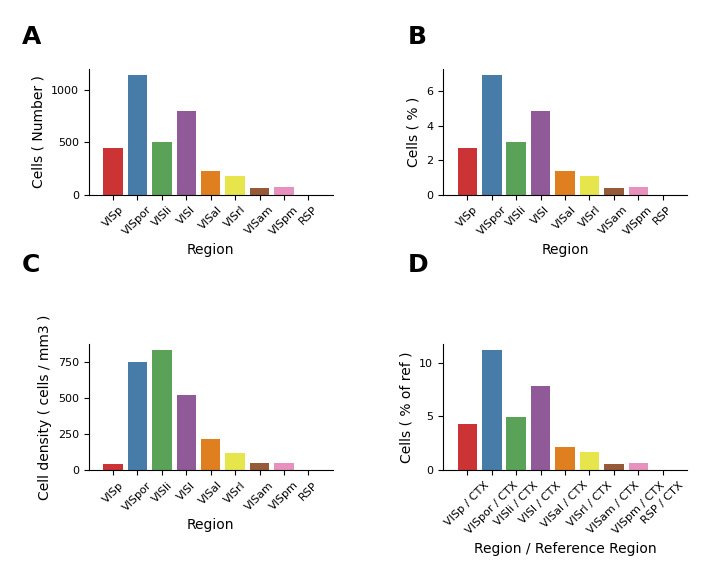
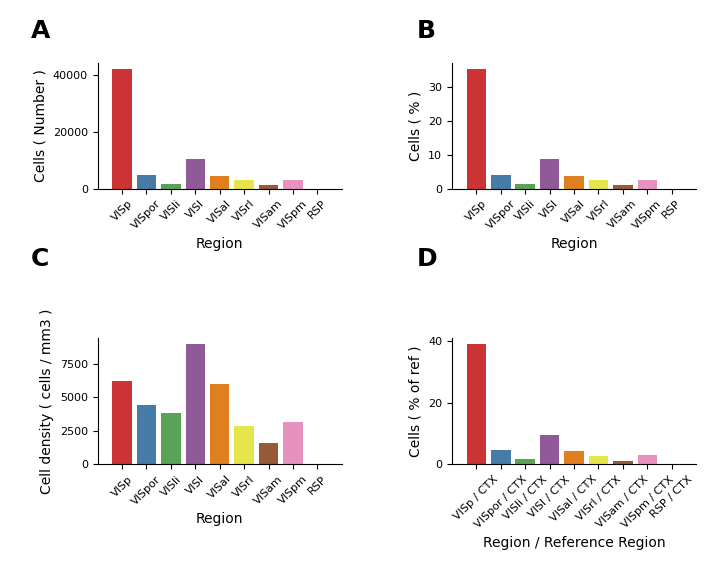
The end result should be bar plots per sample indicating the counts and percentages of cells in each region:
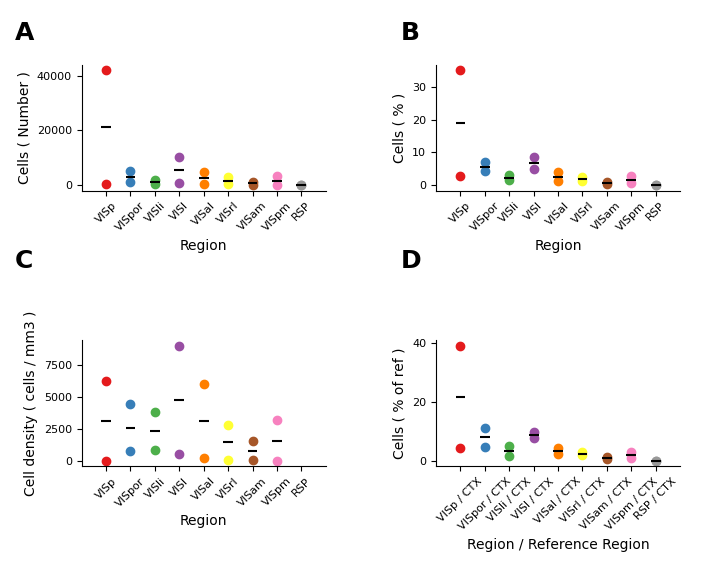
And also a pooled plot indicating the averages for all samples and the individual points:
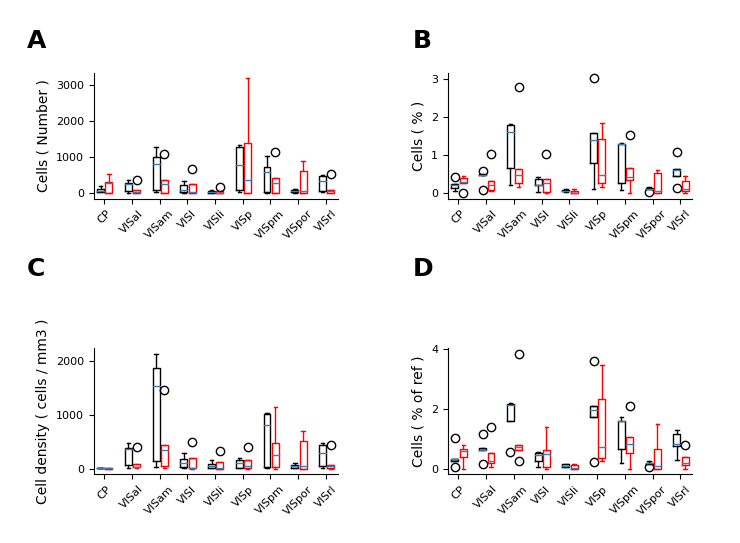
A boxplot of each experimental group:
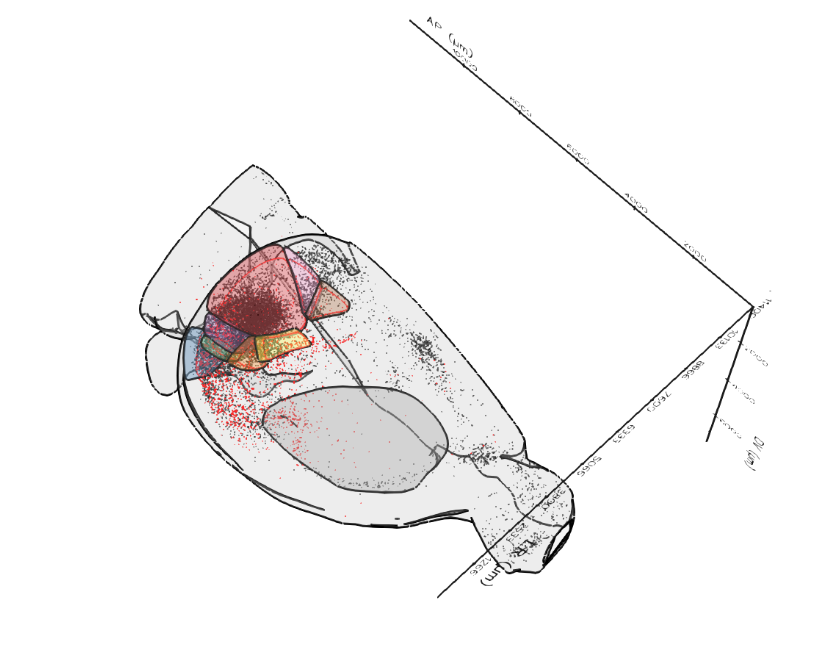
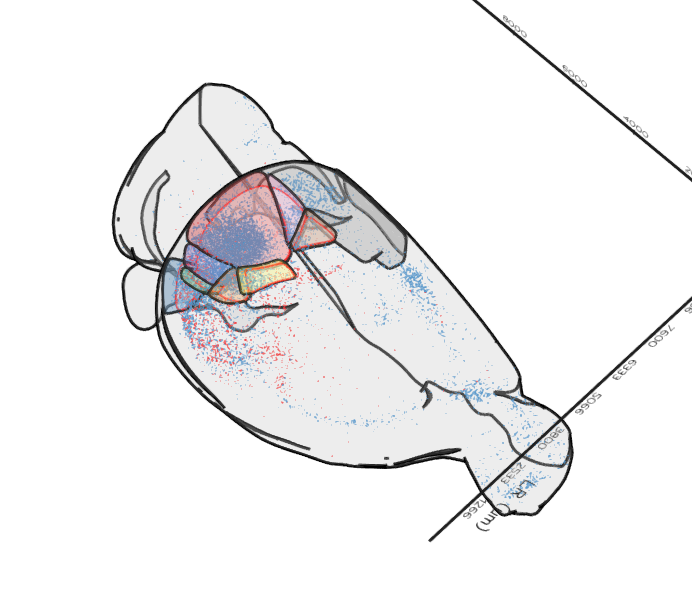
Together with a brainrender of the samples and target regions:
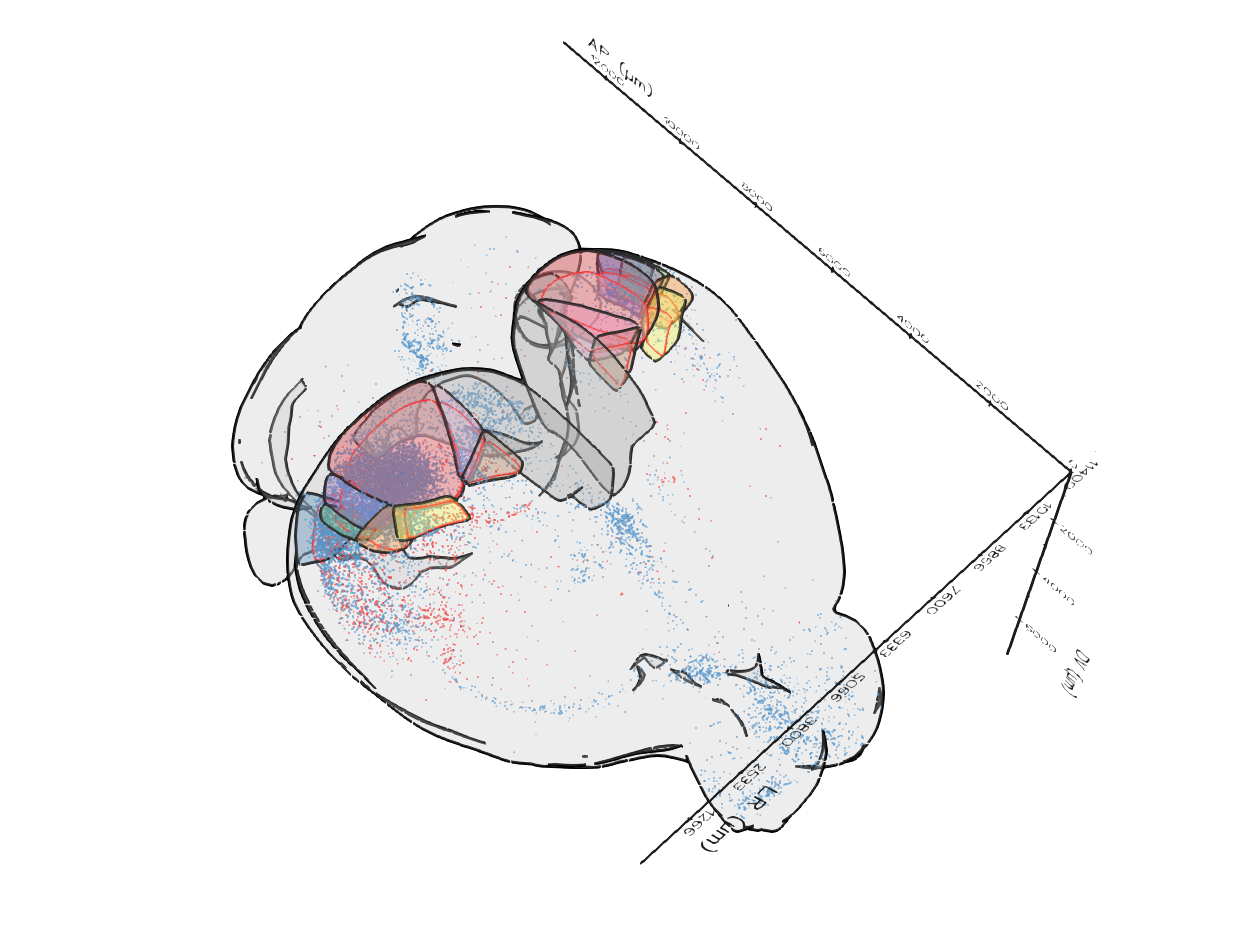
 Any .obj files in the directory hierarchy will be automatically displayed e.g.:
1 maintainer

Metadata
1 maintainer
Release files for cellfinder-visualize 0.2.3
For a detailed explanation of source distributions (sdists) and built distributions (wheels), please see the package formats documentation.
Source distribution (sdist)
| File | Size | Uploaded | |
|---|---|---|---|
| cellfinder-visualize-0.2.3.tar.gz | 15.9 kB | Details |
Built distribution (wheel)
| File | Interpreter | ABI | Platform | Reset |
|---|---|---|---|---|
| cellfinder_visualize-0.2.3-py3-none-any.whl | Python 3 | none | any | Details |
Total release size: 29.0 kB
Release files / cellfinder-visualize-0.2.3.tar.gz
| Download URL | cellfinder-visualize-0.2.3.tar.gz |
|---|---|
| Size | 15.9 kB |
| Tags | Source |
|
SHA-256 checksum How to use checksums |
de44256cb9e9b6099dbd1835dda3953d88438a0a73e3e6303592ace9662f0802
|
|
BLAKE2b-256 checksum How to use checksums |
5b64b0fbc622e0418b394a427deb6c4167ee11fefb16f85028aa77e58bb26484
|
| Upload date | |
|
Uploaded using Trusted Publishing? What is trusted publishing? |
No |
| Uploaded via |
twine/4.0.2 CPython/3.10.4
|
Release files / cellfinder_visualize-0.2.3-py3-none-any.whl
| Download URL | cellfinder_visualize-0.2.3-py3-none-any.whl |
|---|---|
| Size | 13.1 kB |
| Tags | Python 3 |
|
SHA-256 checksum How to use checksums |
c9c49f2b2eb7856d043567c79ce21433fc1ed748369aa1c608897b45be524658
|
|
BLAKE2b-256 checksum How to use checksums |
00374c3c1c2f0e2412c2068260d752dbcd9c21f8b9eb41c5d32e7c7596a8c688
|
| Upload date | |
|
Uploaded using Trusted Publishing? What is trusted publishing? |
No |
| Uploaded via |
twine/4.0.2 CPython/3.10.4
|














