
chartcn


A shadcn-inspired chart library — a thin wrapper around matplotlib that turns a pandas DataFrame into a clean chart in one call, in light and dark mode.
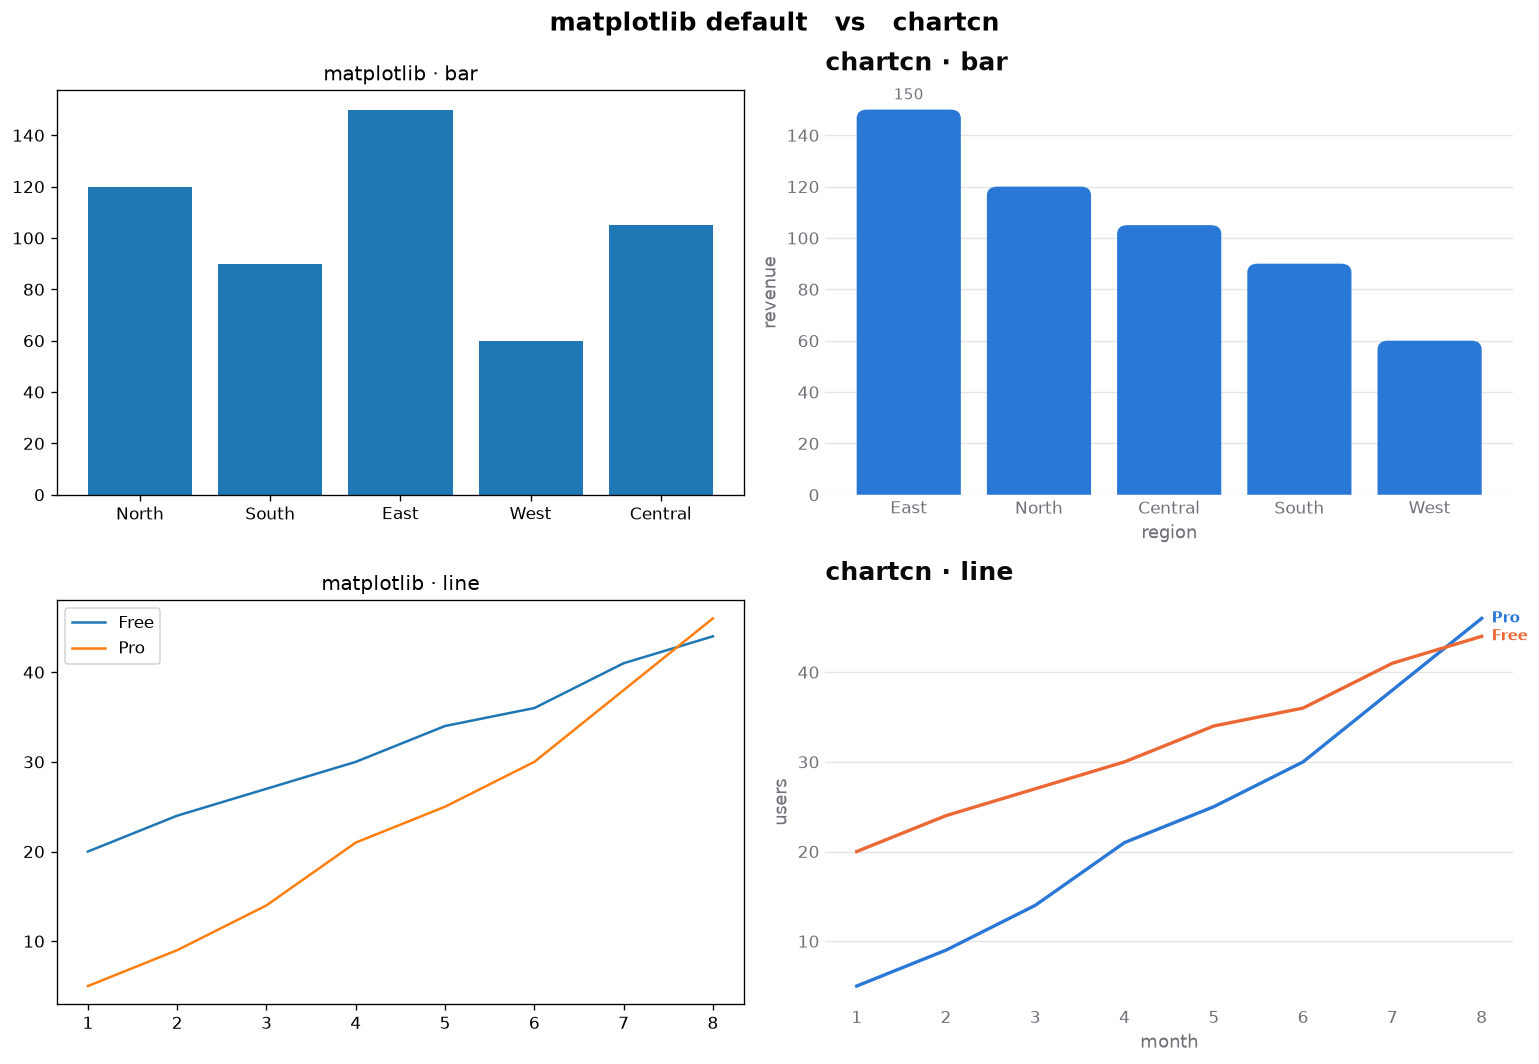
It doesn't add chart types or draw anything itself — it makes the shadcn charts
look the default: rounded bar ends, borderless axes, a faint horizontal grid, and
light/dark card surfaces, over a colorblind-safe palette. Every function returns
the underlying matplotlib Axes, so you can always drop down to raw matplotlib.
Same data, one call — matplotlib's defaults (left) vs chartcn (right):
Install
pip install chartcn
Requires Python 3.10+ (pulls in matplotlib and pandas).
Quickstart
import pandas as pd
import chartcn as viz

sales = pd.DataFrame(
    {"region": ["North", "South", "East", "West"], "revenue": [120, 90, 150, 60]}
)
ax = viz.bar(sales, x="region", y="revenue", sort="desc", title="Revenue by region")
ax.figure.savefig("revenue.png", dpi=150, bbox_inches="tight")
The return value is a real matplotlib Axes, so you keep full control — compose into
your own figure with ax=, or drop to raw matplotlib any time:
import matplotlib.pyplot as plt

fig, ax = plt.subplots()
viz.bar(sales, x="region", y="revenue", ax=ax, title="Q3 sales")
ax.axhline(100, color="0.6", lw=1)   # raw matplotlib
Charts
| Function | For | Highlights |
|---|---|---|
viz.bar |
comparing magnitude | by= grouped · stacked=True · horizontal=True · sort= |
viz.line |
trends over time | by= for multiple series · highlight= |
viz.scatter |
relationships | by= for categories · size= for a third dimension |
viz.hist |
distributions | bins="auto" · by= for groups |
# One series is the point, the rest are context
viz.line(usage, x="month", y="active_users", by="plan", highlight="Pro")

# Grouped bars
viz.bar(survey, x="quarter", y="responses", by="channel")

# A distribution in dark mode
viz.hist(latency, x="ms", bins=40, theme="dark", title="Request latency")
Every function shares the same keywords, so learning one teaches the rest:
x, y, by, highlight, sort, label, texture, title, subtitle,
caption, xlabel, ylabel, theme, palette, ax.
highlight=accents one series/group and grays the rest (dropping the legend) — the honest alternative to giving every series a loud color.label="auto"labels only the extreme or highlighted mark, never every point.texture=Trueadds hatches (bar/hist), dash patterns (line), or marker shapes (scatter) so a chart stays legible in black-and-white and for colorblind readers.
Theming
light is the default; switch per call, per block, or globally:
viz.bar(sales, x="region", y="revenue", theme="dark")   # per call

with viz.theme("dark"):                                  # scoped
    viz.bar(sales, x="region", y="revenue")

viz.set_theme("dark")                                    # global
| Theme | Look |
|---|---|
light (default) / dark |
The shadcn look — rounded bars, no spines, faint grid, card surfaces — over the colorblind-safe palette. |
classic / classic-dark |
Hairline spines, square bars, the default sans. |
Build your own by passing palette= to any chart, or with
dataclasses.replace(viz.LIGHT, ...) to tweak chrome knobs (axis_lines,
bar_radius, value_axis).
Examples
Runnable scripts for every chart, emphasis, theming, and grayscale/texture output
live in examples/, with a rendered gallery in
examples/README.md.
License
1 maintainer

Metadata
1 maintainer
Release files for chartcn 0.1.0
For a detailed explanation of source distributions (sdists) and built distributions (wheels), please see the package formats documentation.
Source distribution (sdist)
| File | Size | Uploaded | Provenance | |
|---|---|---|---|---|
| chartcn-0.1.0.tar.gz | 992.5 kB | Without provenance | Details |
Built distribution (wheel)
| File | Interpreter | ABI | Platform | Reset |
|---|---|---|---|---|
| chartcn-0.1.0-py3-none-any.whl | Python 3 | none | any | Details |
Total release size: 1.0 MB
Release files / chartcn-0.1.0.tar.gz
| Download URL | chartcn-0.1.0.tar.gz |
|---|---|
| Size | 992.5 kB |
| Tags | Source |
|
SHA-256 checksum How to use checksums |
f4855ae5ed6a8ad9b0214d00bfcfb3b6b80b3e23ef2ba973816d514256f1fae7
|
|
BLAKE2b-256 checksum How to use checksums |
e858aab508994ddf5b791d3af24ea97708e9cefaf09ff45162d7a83246c759e5
|
| Upload date | |
|
Uploaded using Trusted Publishing? What is trusted publishing? |
No |
| Uploaded via |
twine/7.0.0 CPython/3.14.0
|
Release files / chartcn-0.1.0-py3-none-any.whl
| Download URL | chartcn-0.1.0-py3-none-any.whl |
|---|---|
| Size | 25.9 kB |
| Tags | Python 3 |
|
SHA-256 checksum How to use checksums |
4337e18fa467b70b7d69a7d2f2531ac3e2149c5eee976aab496abca90d3cb4b0
|
|
BLAKE2b-256 checksum How to use checksums |
d1e53c76b2f2ef4548c1b66595808278307deb3a6ddfa3ae3eab580d0e86d6aa
|
| Upload date | |
|
Uploaded using Trusted Publishing? What is trusted publishing? |
No |
| Uploaded via |
twine/7.0.0 CPython/3.14.0
|
Security for chartcn 0.1.0
Provenance
Provenance describes where a file came from. On PyPI, provenance is shared via attestations, which provide a verifiable record of the build or publishing details. View details, limitations and caveats.
No provenance found
None of the files in this release were uploaded with provenance metadata.
A note on package security
PyPI is a repository for distributing packages, not a service for auditing them. While third-party security researchers and our staff do their best to detect and remove malicious packages, PyPI cannot guarantee the quality, security or suitability of any given package.
To learn more about protecting yourself from malicious actors, visit our package security documentation.













