A Python package for chartly multiple plots.

Project description
chartly Package


chartly is a lightweight scientific plotting library designed to
simplify the process of building visualisations. It provides a clean and
intuitive interface for generating statistical plots, geographic
visualisations, overlays, and multi-plot figures without requiring complex
setup or boilerplate code.
Whether you are exploring distributions, comparing datasets, visualising geographic data, or building composite visualisations, Chartly enables you to move from data to insight with minimal effort.
Chartly provides a small set of high-level methods that simplify the plotting workflow:
add_subplot(...)-> create a new subplotadd_subplots(...)-> create multiple subplots at onceadd_overlay(...)-> add additional plots to an existing subplotadd_basemap(...)-> create geographic visualisations using map projectionsrender()-> display the final figure
Project Status
Here's the current status of our workflows:
| Workflow | Status |
|---|---|
| Testing Suite |  |
| Deployment Suite |  |
| Sphinx Documentation |  |
| Guard Main Branch |  |
| Code Quality Checker |  |
Components
The Chartly codebase is organised as follows:
.
├── chartly/
│   ├── __init__.py
│   ├── base.py
│   ├── chartly.py
│   ├── charts.py
│   ├── utilities.py
│   └── tests/
│       ├── __init__.py
│       └── test_chartly.py
├── docs/
│   ├── __init__.py
│   ├── source/
│   │   ├── conf.py
│   │   ├── index.rst
│   │   ├── Plot.rst
│   │   ├── Multiplots.rst
│   │   └── Basemap.rst
├── requirements/
│   ├── testing.txt
│   ├── staging.txt
│   └── production.txt
├── .gitignore
├── LICENSE
├── MANIFEST.in
├── README.md
├── VERSION
├── requirements.txt
└── setup.py
Installation
Install Chartly directly from PyPI:
pip install chartly
Examples
The following examples demonstrate how to use Chartly for common visualisation tasks, from simple plots to more advanced multi-plot configurations.
Single Plot
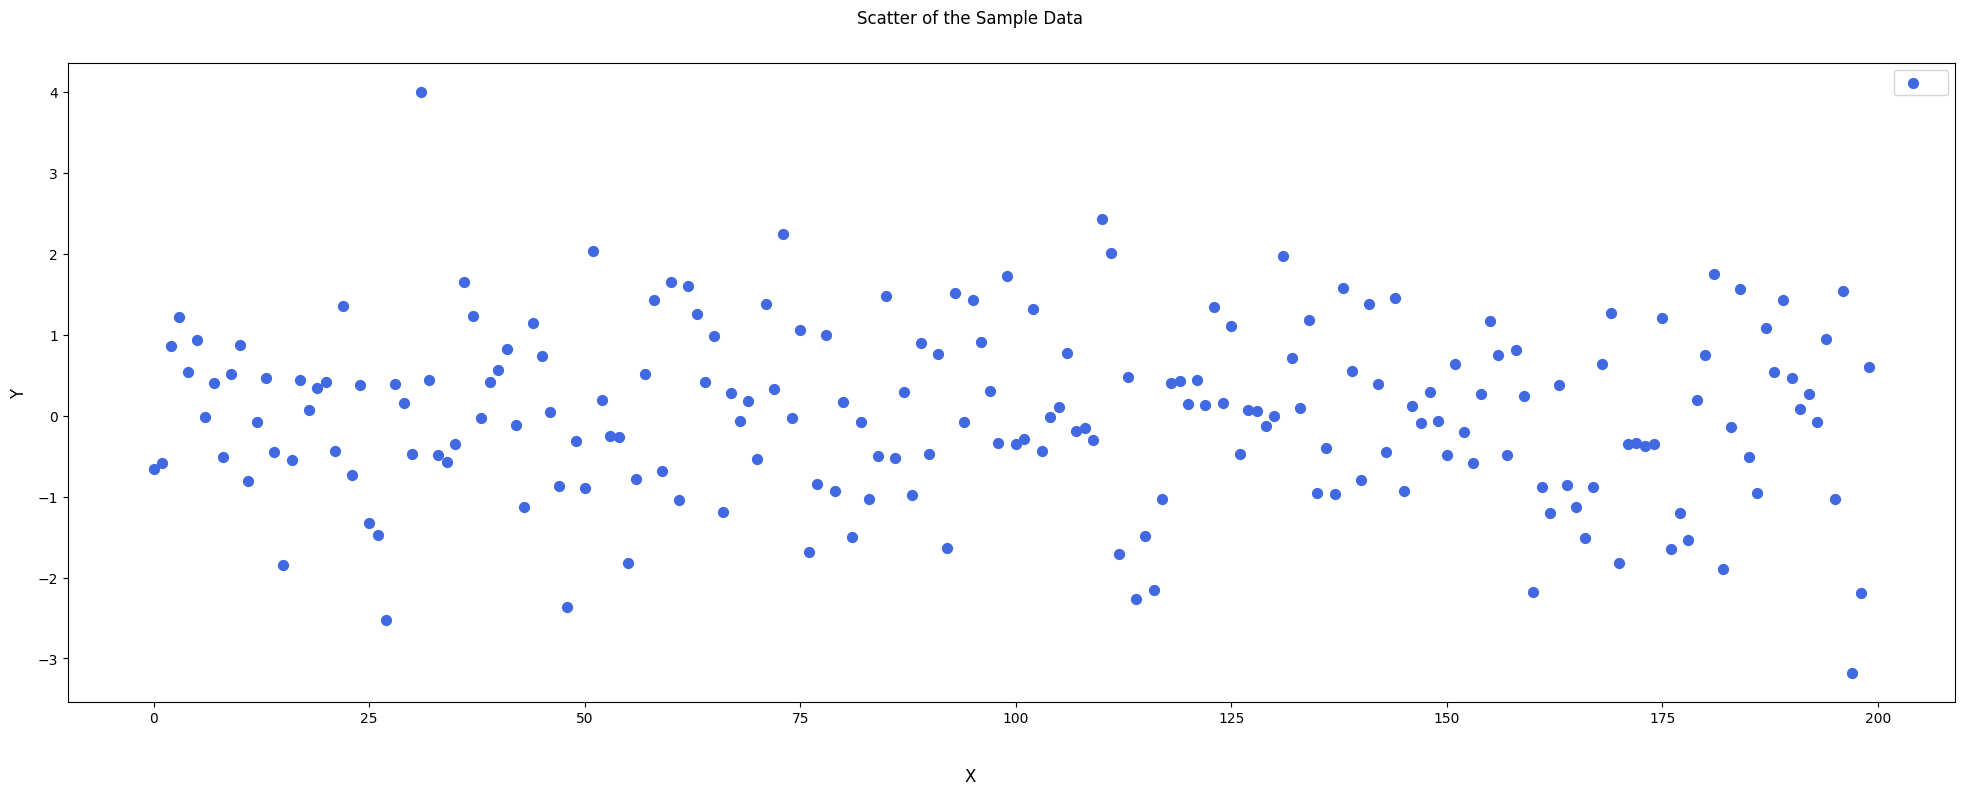
The following example generates a scatter plot with custom styling.
"""Scatter Plot of Sample Data"""

import chartly
import numpy as np

args = {
    "super_title": "Scatter of the Sample Data",
    "super_xlabel": "X",
    "super_ylabel": "Y",
}

chart = chartly.Chart(args)

x_range = np.arange(200)
sample_data = np.random.randn(200)

chart.add_subplot(
    "scatter",
    [x_range, sample_data],
    customs={"color": "royalblue", "size": 50, "marker": "o"},
)

chart.render()
This visualisation highlights how Chartly supports customisation while maintaining a simple interface.
Multiple Subplots
Chartly simplifies the process of generating multiple related plots within a single figure.
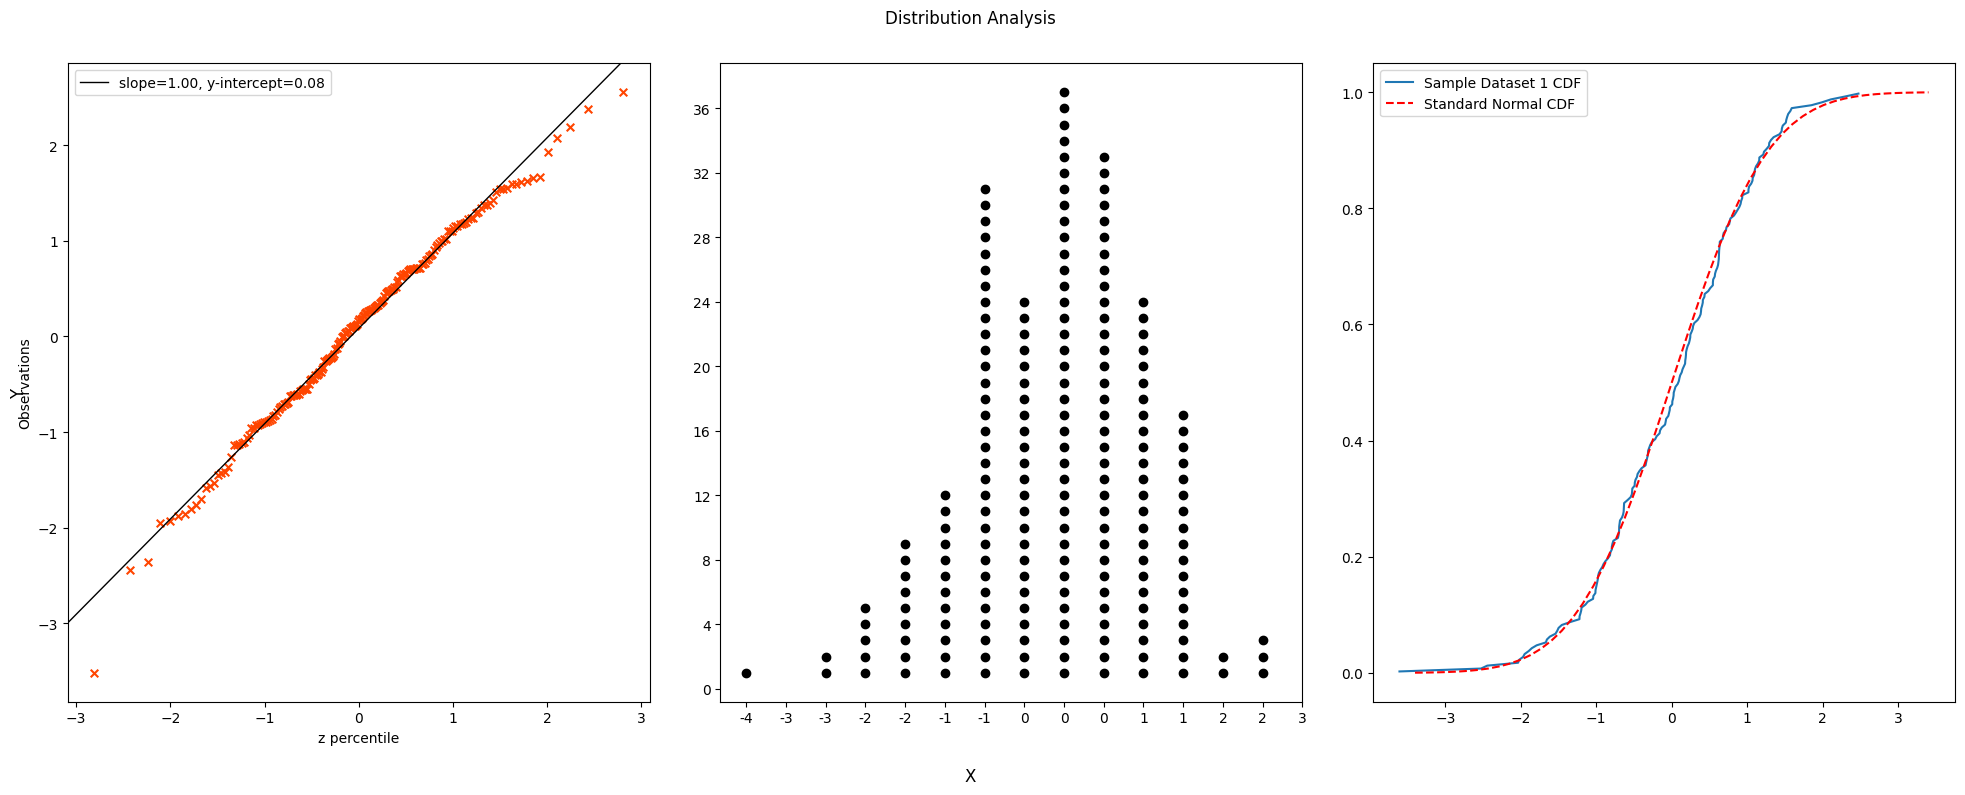
"""Distribution Analysis Using Multiple Subplots"""

import chartly
import numpy as np

args = {
    "super_title": "Distribution Analysis",
    "super_xlabel": "X",
    "super_ylabel": "Y",
    "share_axes": False,
}

chart = chartly.Chart(args)

data = np.random.randn(200)

chart.add_subplots(
    ["probability_plot", "dotplot", "normal_cdf"],
    data=data,
)

chart.render()
This example produces multiple statistical views of the same dataset without requiring loops or manual payload construction.
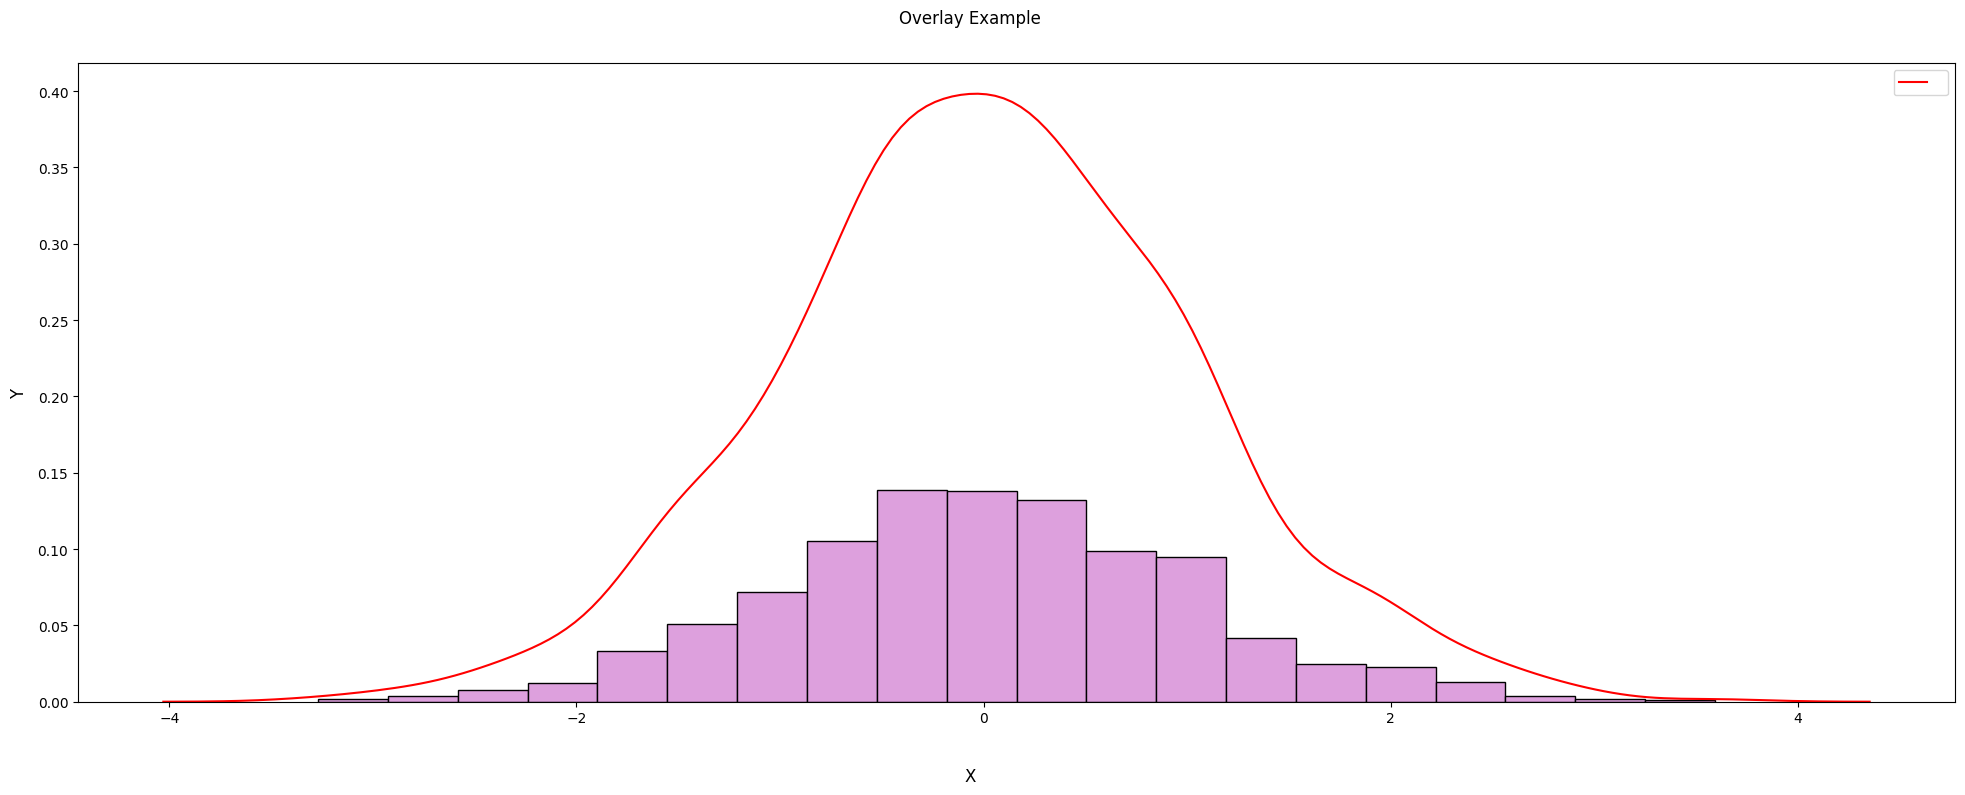
Overlay Example
Chartly also supports overlaying multiple plots within the same subplot for richer analysis.
"""Overlaying Density on a Histogram"""

import chartly
import numpy as np

args = {
    "super_title": "Overlay Example",
    "super_xlabel": "X",
    "super_ylabel": "Y",
}

chart = chartly.Chart(args)

data = np.random.randn(1000)

chart.add_subplot("histogram", data)
chart.add_overlay("density", data)

chart.render()
In this example, a density curve is layered on top of a histogram, allowing both distribution and frequency to be visualised together.
Basemap
Chartly also supports geographic visualisations with basemaps, making it possible to overlay contour data on map projections using the same simplified plotting interface.
"""Simple Basemap Example"""

import chartly
import numpy as np

super_axes_labels = {
    "super_title": "Simple Usage Of Basemap Example",
    "share_axes": False,
}

plot = chartly.Chart(super_axes_labels)

nlats, nlons = 73, 145
delta = 2.0 * np.pi / (nlons - 1)
lats = 0.5 * np.pi - delta * np.indices((nlats, nlons))[0, :, :]
lons = delta * np.indices((nlats, nlons))[1, :, :]
wave = 0.75 * (np.sin(2.0 * lats) ** 8 * np.cos(4.0 * lons))
mean = 0.5 * np.cos(2.0 * lats) * ((np.sin(2.0 * lats)) ** 2 + 2.0)
z = wave + mean

plot.add_basemap(
    lon=lons * 180.0 / np.pi,
    lat=lats * 180.0 / np.pi,
    values=z,
    customs={
        "proj": "eck4",
        "lon_0": 0,
        "draw_countries": True,
        "draw_parallels": True,
        "draw_meridians": True,
        "mask": z < 0,
        "contour": True,
        "hatch": True,
        "hatch_customs": {"type": "mask"},
    },
)

plot.render()
This example demonstrates how Chartly can plot contour data on a global map projection while keeping the user-facing interface minimal and readable.

Documentation
Full documentation is available via Sphinx:


Download files
Download the file for your platform. If you're not sure which to choose, learn more about installing packages.
Source Distribution
Built Distribution
Filter files by name, interpreter, ABI, and platform.
If you're not sure about the file name format, learn more about wheel file names.
Copy a direct link to the current filters
File details
Details for the file chartly-1.1.1.tar.gz.
File metadata
- Download URL: chartly-1.1.1.tar.gz
- Upload date:
- Size: 21.3 kB
- Tags: Source
- Uploaded using Trusted Publishing? No
- Uploaded via: twine/6.2.0 CPython/3.12.13
File hashes
| Algorithm | Hash digest | |
|---|---|---|
| SHA256 |
73095e70faaeee64c5a3b3ff037e12302f019924f9f7ab2992721011835ec638
|
|
| MD5 |
d7fe913d5535e90ab10889443b2cbad6
|
|
| BLAKE2b-256 |
b1b1e92b863aaf83cf217e77e63b70de48d2a3dc251552c6ac287e406609ee72
|
File details
Details for the file chartly-1.1.1-py3-none-any.whl.
File metadata
- Download URL: chartly-1.1.1-py3-none-any.whl
- Upload date:
- Size: 20.4 kB
- Tags: Python 3
- Uploaded using Trusted Publishing? No
- Uploaded via: twine/6.2.0 CPython/3.12.13
File hashes
| Algorithm | Hash digest | |
|---|---|---|
| SHA256 |
7ab95fa81de199bc31d93fe0ba38b6f7ffad1120ddffd36902dbb830c7588dee
|
|
| MD5 |
840f5cd20d23a3d8307932299b4bd28a
|
|
| BLAKE2b-256 |
176321522692ec46f1e3db3865b33a8c5e897b365ce2dc38676b3686e6e517c3
|


