
- check-opencloud-security
- Try it online
- Quick start
- Features
- Prerequisites
- Installation
- CLI Usage
- Checking multiple hosts
- Prometheus & Kubernetes integration
- Machine-readable output for CI (json/sarif/junit)
- GitHub Action
- Environment variables
- The built-in scanner
- Update check
- Configuration file and secrets
- Rating thresholds
- Hardening checks
- Explaining a rating
- What would raise the rating
- Webhook notifications
- Reporting only what changed
- Is the plugin itself up to date?
- Retries and backoff
- Performance data
- Caching
- Example output
- Deployment guides
- Examples
- Contributing
- License
check-opencloud-security
Check the security level of your OpenCloud instance from your own monitoring system - misconfigurations, weak hardening, known vulnerabilities, and whether a security update is pending.
This plugin ships its own built-in scanner and runs every check
locally: it talks to the instance directly, reads the
endpoints OpenCloud exposes without authentication, probes for the
misconfigurations that actually occur in OpenCloud deployments, checks the
running release against the OpenCloud release feed so a
pending update or an end-of-life release shows up like any other finding, and
rates the result on a 0-5 scale. The ratings follow the scale of the
Nextcloud scan API, so existing thresholds, graphs and alert rules keep their
meaning.
Important: The scanner is not exhaustive. Its rating does not mean an OpenCloud instance is completely secure or that no vulnerability, misconfiguration, or other issue has been overlooked.
Nothing about your instance is ever sent to a third party. The only optional outbound request is the update check, which asks GitHub for the newest OpenCloud release - and even that can be pinned, bundled or turned off entirely for an air-gapped setup.
Try it online
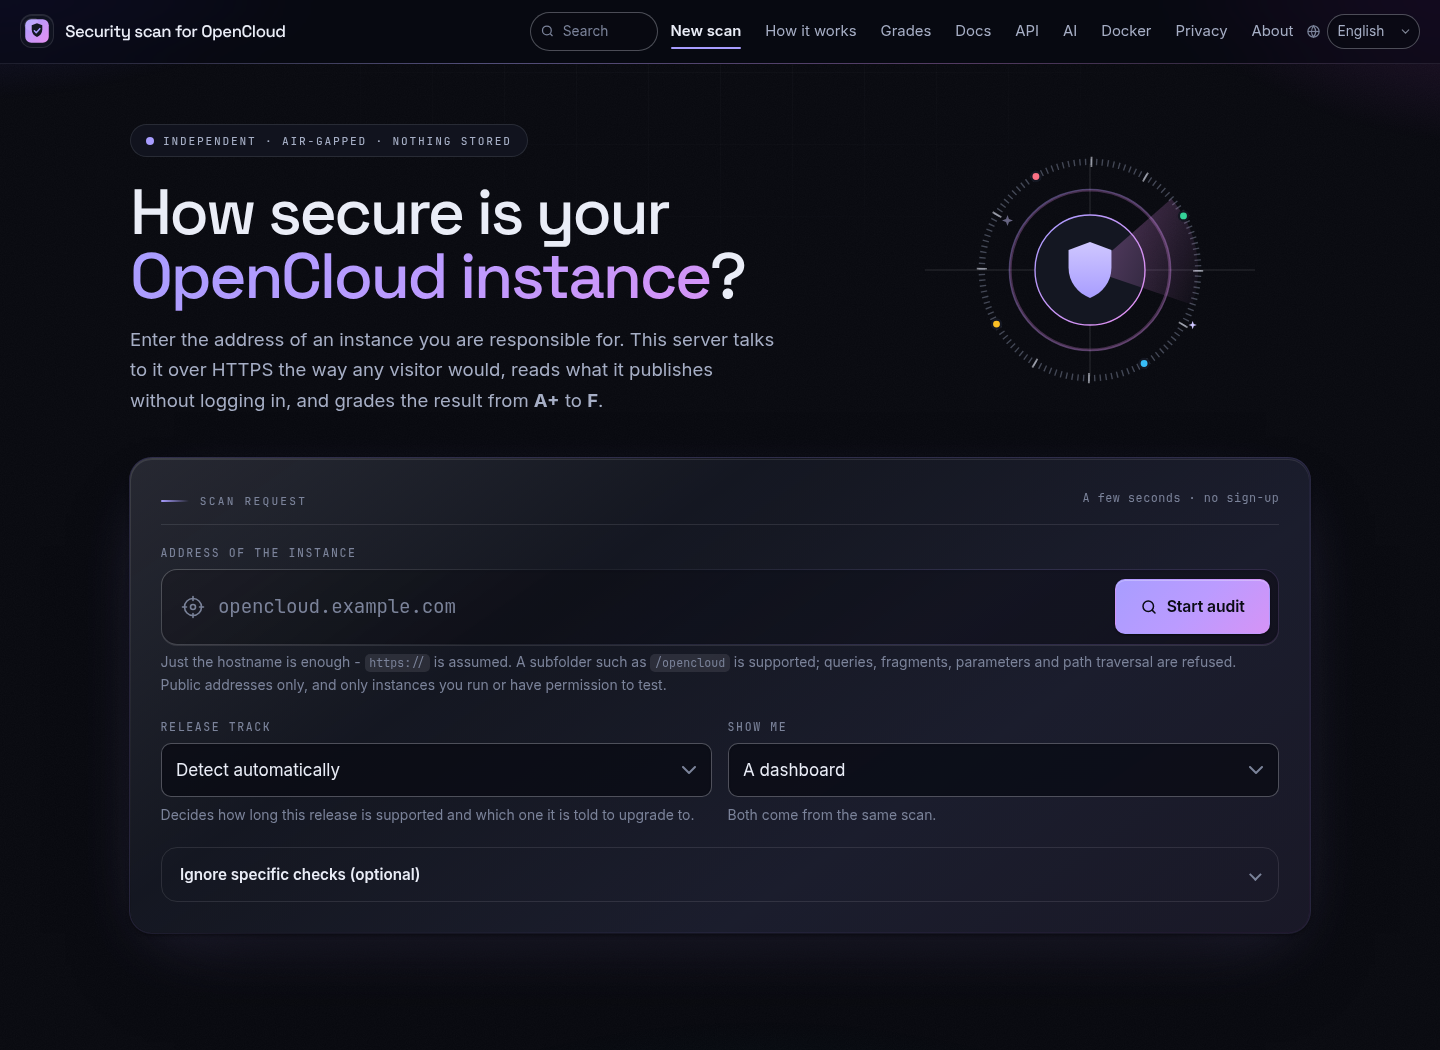
👉 scan.okxo.de - scan an instance in your browser, nothing to install
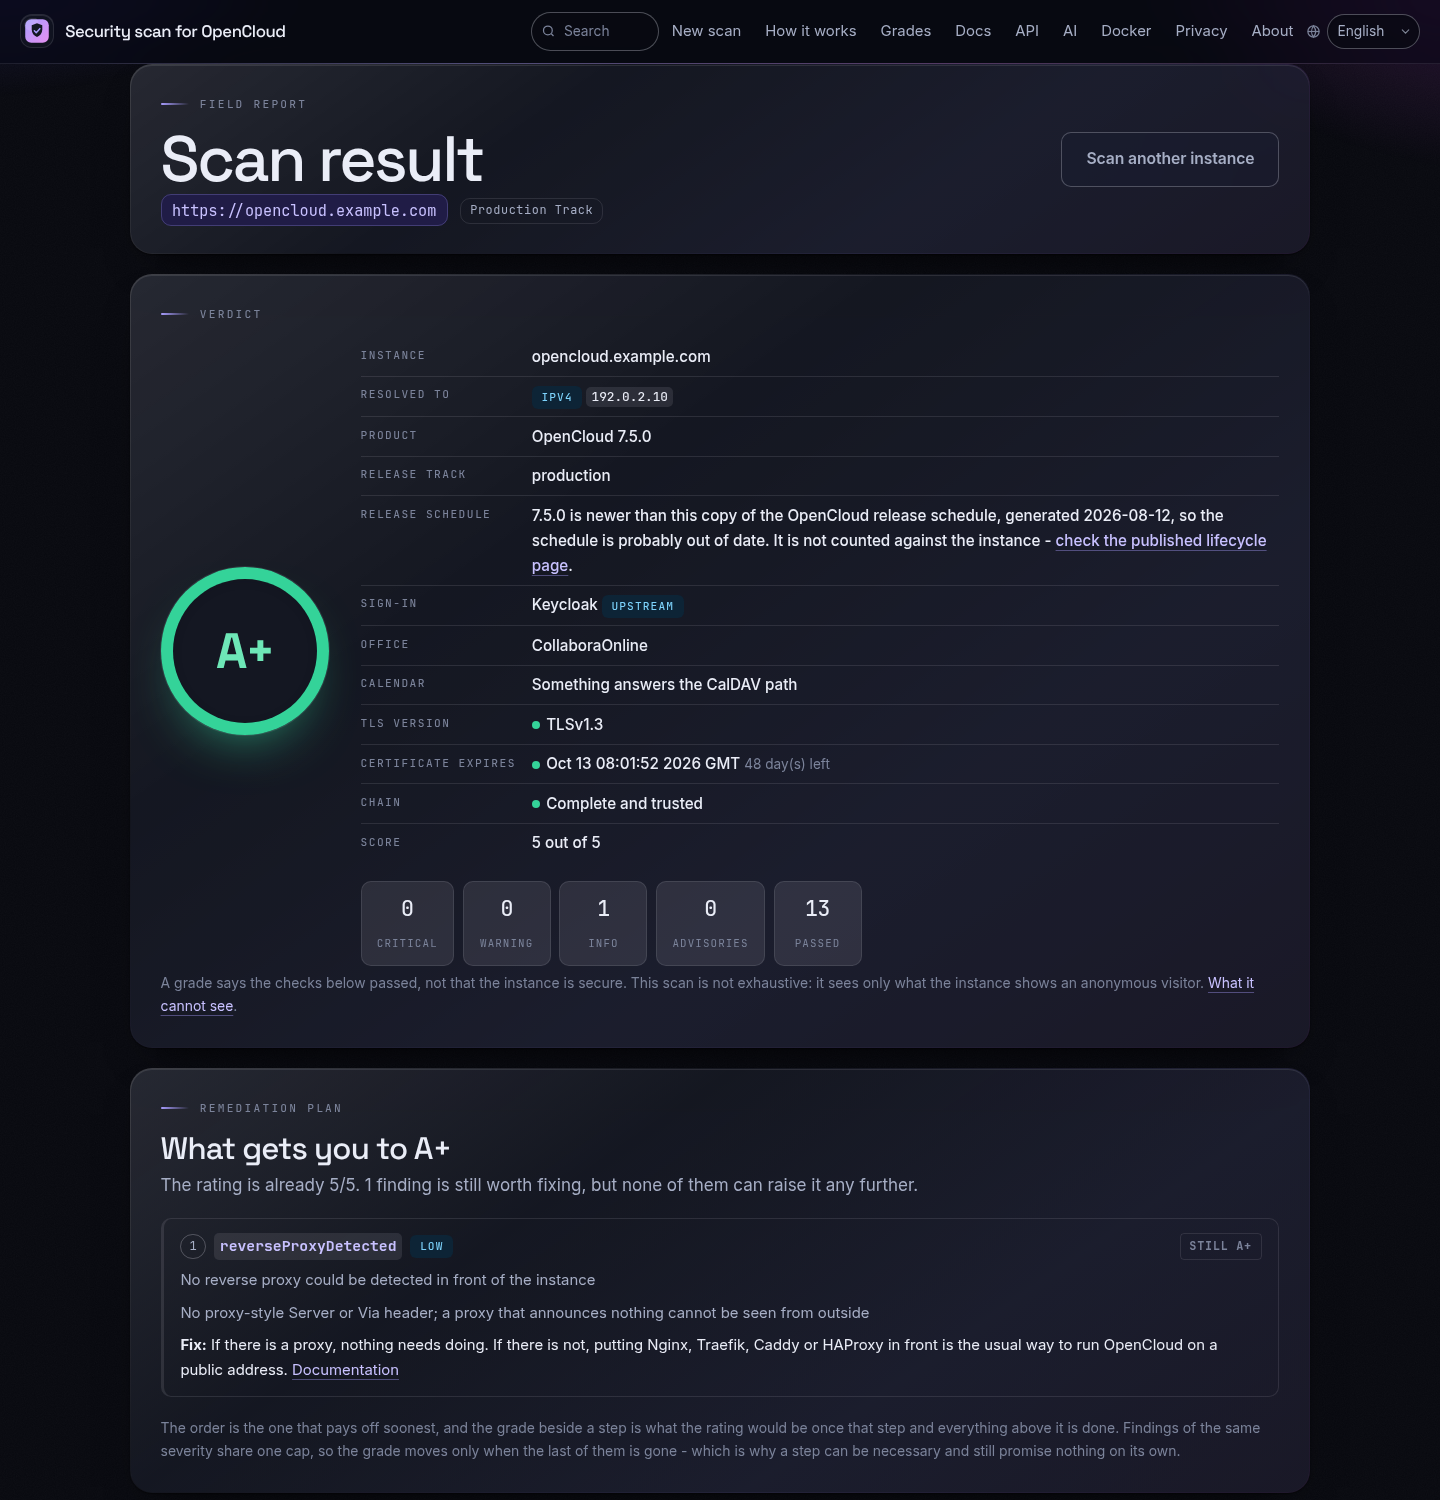
A hosted instance of the web application in this repository. Paste the address of a publicly reachable OpenCloud, watch the scan run and read the same findings the plugin reports, graded A+ to F. No account, no API key, no sign-up.
It is the fastest way to see what this project does before deciding whether to install anything, and it is genuinely useful on its own for a one-off look at a server.
Two things worth knowing, because the paragraph above just said nothing is ever sent to a third party - and using a hosted service is exactly that:
- The scan runs from that server, not from yours. It sees what any anonymous visitor on the internet sees, which is the point, but it cannot reach an instance behind a VPN or on a private network. For those, and for anything you would rather not hand to someone else's machine, run the plugin or host the service yourself - it is the same code, with no rate limit.
- A result lives for an hour, then Redis drops it. The link is the only way to reach it, nothing is written to disk, and the target address is never logged.
Quick start
Install the plugin and run a check - one command each:
pipx install check-opencloud-security     # or: uv tool install / pip install
check-opencloud-security --host opencloud.example.com
A fresh OpenCloud created with opencloud init serves TLS on port 9200 with a
self-signed certificate. Point the check at it and tell it not to hold the
certificate against the instance:
check-opencloud-security --host opencloud.example.com:9200 --insecure
For a permanent setup (Icinga2, systemd timer, cron, Docker, ...) see Installation below.
Features
- No API, no third party. Every check runs in the plugin process, against your instance. IP addresses, custom ports and internal hostnames all work, and there are no rate limits
- Pending-update and end-of-life detection against the OpenCloud release
feed: whether a newer release is out on your track, and
whether the running one still receives security fixes - with offline
pinnedandbundledmodes for air-gapped monitoring - OpenCloud-specific checks: unauthenticated Graph/WebDAV/OCS endpoints,
exposed
opencloud.yaml,proxy/server.keyand boltdb files, reachable service debug ports (/metrics,/config,/debug/pprof), enabled basic auth and version disclosure - TLS inspection: handshake, protocol version, certificate expiry and trust, plus an automatic HTTPS -> HTTP fallback that reports the downgrade instead of hiding it - see TLS and certificates
- Hardening derived from what the instance actually reports, not guessed from its version number: HSTS strength, CSP quality, public-link password and expiry enforcement, user-enumeration and password-policy settings
- Configuration from a YAML file, environment variables or a secret provider (Docker/Kubernetes secrets, files, environment, commands)
- Standard Nagios/Icinga exit codes (OK, WARNING, CRITICAL, UNKNOWN) and performance data (rating, vulnerability count, scan duration)
- Configurable rating thresholds for WARNING and CRITICAL
- Optional hardening and security-header checks (
--check-hardening) - Optional webhook notification when a check turns critical
- Automatic retry with exponential backoff on transient network errors
- Web proxy support, debugging, multi-host runs
- Installable with pipx/uv/pip - or as a ready-to-use Docker image
Prerequisites
- Python 3.10 or newer - or Docker, if you prefer the containerised route.
requestsandPyYAML, installed automatically by pipx/uv/pip.- Network access from the monitoring host to the OpenCloud instance. Unlike a hosted scanner, this plugin needs to reach the instance itself - which is exactly what makes it work for instances that are not on the internet.
Installation
Two commands cover the common case. Everything else - keeping the package current, shell completion, installing from a checkout, building the image yourself and the Icinga2/Nagios object definitions - is in Installing the plugin.
pipx install check-opencloud-security          # or: uv tool install / pip install
check-opencloud-security --host opencloud.example.com
On a monitoring host, where software is expected to arrive through the package
manager and show up in the inventory, every release also carries a .deb and
an .rpm:
sudo apt install ./check-opencloud-security_<version>_all.deb       # Debian, Ubuntu
sudo dnf install ./check-opencloud-security-<version>-1.noarch.rpm  # RHEL, Fedora
Both put the check in /usr/lib/nagios/plugins/ and configure nothing until
you say so - the details are in
Installing the plugin.
Prefer not to put Python on the host? The published image carries both entry points:
docker run --rm --entrypoint check-opencloud-security \
  okxo/opencloud-scanner:latest --host opencloud.example.com
That one line, its JSON variant and the useful flags around it are collected in
Scanning from the command line, in one line. The
image's default command starts the web application, which is why the plugin is
selected with --entrypoint.
| Route | Where it is written up |
|---|---|
pipx / uv / pip, and --upgrade-self |
Installing the plugin |
.deb and .rpm, for a monitoring host |
Installing the plugin |
| Shell completion | Installing the plugin |
| Docker, and building the image | Installing the plugin |
| Icinga2 and Nagios objects | Installing the plugin |
| Icinga Director, through the web UI | Icinga Director |
| Ansible, systemd, cron, Kubernetes | Deployment guides |
Every release ships a CycloneDX SBOM and a Sigstore provenance attestation; see Verifying what you downloaded if you would rather not take the artifact on trust.
Keeping the package current matters more here than for a plugin that asks a hosted service: the OpenCloud release schedule and the newest known release ship inside the package (see End-of-life detection).
CLI Usage
check-opencloud-security -hwill show you a manual.
Command
check-opencloud-security --host <Hostname> --check-hardening
Options
The full table - every flag, its default and the environment variable that sets the same thing - is the CLI option reference. It moved to its own page because it is a lookup table fifty rows long, and having it here meant everything below it started halfway down the file.
--help prints the same options grouped under nine headings - which instance
to check, what to probe, how the result is judged, version and update
information, comparing against an earlier run, how the scan runs, what is
printed, posting the result elsewhere, and the program itself - so the dozen
lines you want can be found without reading the other forty.
The handful you will actually type most days:
| Option | Description |
|---|---|
-H, --host |
The instance to check. Hostname, IP or URL, optionally with a port; comma-separated for several |
-d, --debug |
Explain the rating and every finding, at length |
--check-hardening |
Also report missing hardening measures and security headers |
-w, --warning / -c, --critical |
The ratings (0-5) at or below which the check warns or goes critical |
--format |
nagios, prometheus, json, sarif or junit |
--ignore-hardening |
Accept a finding you are not going to fix, by name |
--baseline / --warn-on-new |
Alert only on findings that are new or worse than last run |
Precedence is always command-line flag > environment variable > configuration file > default.
Checking multiple hosts
--host (and COS_HOST) accepts a comma-separated list of hostnames, e.g.:
check-opencloud-security --host opencloud1.example.com,opencloud2.example.com
Hosts run concurrently: the plugin creates one worker per host, up to the
default ceiling of five. A single-host check remains strictly single-threaded,
with no host worker pool. Set --concurrency or COS_CONCURRENCY to lower or
raise the ceiling (up to 32), for example --concurrency 2 for at most two
hosts at a time. Each worker keeps its result and Nagios perfdata separate;
the output starts with a one-line summary
(e.g. Checked 2 host(s): overall CRITICAL (1 CRITICAL, 1 OK)), followed by
one result block per host in the same order as the input. The plugin exits with the worst status found
across all hosts, using the usual Nagios/Icinga priority: CRITICAL >
WARNING > UNKNOWN > OK. A single host still produces the original,
single-block output and exit code, so existing single-host setups are
unaffected. Once the instances stop resembling each other, one configuration
file per instance scales better - see
Checking a fleet of instances.
Whitespace around each hostname is ignored, and empty entries (e.g. from a
trailing comma) are dropped. Because there is no hosted API involved, each
entry may be a hostname, an IPv4 address, a bracketed IPv6 address or a full
URL, with or without a port:
--host 10.0.0.5:9200,[2001:db8::1],https://cloud.example.com/.
Prometheus & Kubernetes integration
--format=prometheus produces a one-shot text payload; the built-in exporter
serves /metrics for pull-based monitoring, refreshing each configured target
on the first scrape and then at the --scrape-interval (60 seconds by
default):
check-opencloud-security --host opencloud.example.com --format=prometheus

check-opencloud-security --host opencloud.example.com \
  --prometheus-listen-port 9102
The exporter binds only to 127.0.0.1 by default. Set
--prometheus-listen-addr 0.0.0.0 only when a firewall or network policy
limits who can scrape it - that is also what a container or a Kubernetes
Deployment needs, alongside publishing port 9102.
It publishes opencloud_security_rating_score,
opencloud_security_vulnerabilities_total,
opencloud_security_hardenings_missing_total,
opencloud_security_failed_extra_checks_total,
opencloud_security_support_days_remaining,
opencloud_security_update_available,
opencloud_security_scan_duration_seconds and
opencloud_security_scrape_success. The host label identifies the configured
target; rating also carries domain, product and version.
The Prometheus and Grafana guide has the ServiceMonitor, the alerting rules, what to graph, and the legacy textfile/Pushgateway patterns; Kubernetes has the manifests.
Machine-readable output for CI (json/sarif/junit)
--format json, --format sarif or --format junit print one combined
document for every scanned host - never one per host, even for a single one, so
the output is always valid JSON/SARIF/XML. The exit code keeps its Nagios
meaning under every format (0/1/2/3), so a CI step can gate on it
exactly the way an Icinga check does; the document is a separate, additional
artifact.
jsonis a JSON array of the same document described in Webhook notifications, one object per host.sarifis SARIF 2.1.0, for a code-scanning dashboard. Its findings come from the same facts as the plugin's own text output, so a SARIF result never says anything the Nagios line would not.junitis JUnit XML with one<testsuite>per host and one<testcase>per finding, plus an always-presentratingcase so a clean host still shows up.
check-opencloud-security --host opencloud.example.com --format sarif \
  > opencloud-security.sarif
docs/output-formats.md compares every --format
value, including nagios and prometheus, and
Running the check from CI has the GitHub Actions and GitLab CI
steps that upload the file.
GitHub Action
action.yml runs the same check as a step, so a workflow can
scan an instance on a schedule without installing anything itself. The
runner has to be able to reach the instance - a hosted runner cannot see
anything behind your firewall, which is what a self-hosted runner is for, and
what the scan measures about TLS, enforced HTTPS and reachable debug ports is
what an outsider on the runner's network sees.
name: OpenCloud security check

on:
  schedule:
    - cron: "0 6 * * *"
  workflow_dispatch:

permissions:
  contents: read

jobs:
  scan:
    runs-on: ubuntu-latest
    steps:
      - uses: sowoi/check-opencloud-security@v1.18.2
        with:
          target: opencloud.example.com
          # Raises GitHub's anonymous rate limit for the release feed. The
          # token the job already has is enough; it needs no scopes.
          releases-token: ${{ github.token }}
Pin the tag. The release schedule and the newest known OpenCloud version
ship inside the package, so which version runs is part of the verdict:
@v1.18.2 installs 1.18.2, while a branch or a commit SHA installs whatever
the newest release happens to be on the day the workflow runs, and says so in
a warning annotation.
| Input | Default | What it does |
|---|---|---|
target |
required | The instance to scan, as a hostname or a URL. |
version |
the pinned tag | The release of the check to install. |
format |
json |
json, sarif, junit or nagios. |
output-file |
opencloud-security.json |
Where the output is written. |
fail-on |
warning |
warning, critical or never. |
warning |
plugin default | Rating at or below which the result is a WARNING. |
critical |
plugin default | Rating at or below which the result is CRITICAL. |
check-hardening |
true |
Count hardening measures towards the result. |
ignore-hardening |
none | Hardening identifiers to waive, comma-separated. |
release-track |
auto |
auto, rolling, production or lts. |
releases-token |
none | A token for the release feed's rate limit; needs no scopes. |
summary |
true |
Write the result to the job summary. |
extra-args |
none | Further plugin flags, passed verbatim. |
The step fails on anything worse than OK by default. fail-on: critical
tolerates a WARNING but still fails on CRITICAL and on UNKNOWN, because a scan
that did not run is not a pass; fail-on: never always succeeds and leaves the
decision to a later step reading the outputs:
| Output | What it holds |
|---|---|
exit-code |
The Nagios exit code: 0 OK, 1 WARNING, 2 CRITICAL, 3 UNKNOWN. |
status |
OK, WARNING, CRITICAL or UNKNOWN. Only for format: json. |
rating |
The rating, 0-5. Only for format: json. |
rating-label |
The letter grade: A+, A, C, D, E or F. Only for format: json. |
message |
The one-line summary. Only for format: json. |
result-file |
The file the output was written to. |
Configuration travels to the plugin as COS_* environment variables rather
than on the command line, so a target does not end up in a public log.
Running the check from CI has the rest: feeding format: sarif
to the code-scanning dashboard, reporting without failing the job, and the
GitLab CI equivalent.
Environment variables
Every option has a COS_-prefixed environment variable equivalent (see the
table above). This is especially useful for Docker, systemd, and cron, where
setting environment variables is often more convenient than editing a command
line. An explicit command-line flag always takes precedence over its
environment variable.
export COS_HOST=opencloud.example.com
export COS_PROXY=http://proxy.example.com:3128
check-opencloud-security
Boolean variables (COS_DEBUG, COS_CHECK_HARDENING, COS_INSECURE, ...)
accept 1, true, yes, or on (case-insensitive) to enable the
corresponding flag; any other value (including unset/empty) is treated as
disabled.
The same values can also come from a YAML file or a secret provider - see Configuration file and secrets.
The built-in scanner
The plugin has one backend: the scanner in
opencloud_local_scan/, which runs in the
plugin process and works the verdict out itself.
That is deliberate. A hosted scanner can only see what is reachable from the internet, refuses IP addresses and internal hostnames, rate-limits its callers and learns about your instance in the process. Scanning locally has none of those constraints.
There is nothing to enable and no --scan-backend flag to pass. Everything
below describes what the built-in scanner does and how to tune it.
What the scanner checks
Everything is read from what the instance publishes without authentication:
/status.php for the product and productversion, the capabilities document,
the security headers, the OpenID Connect discovery document, and the paths and
ports that ought not to answer at all. On top of that come the additional
checks (extraChecks in the JSON, disabled with --no-extra-checks): TLS and
certificates, whether the zone is signed and who may issue it a certificate,
cookie attributes, CORS and TRACE, unauthenticated Graph, WebDAV and OCS
endpoints, exposed deployment files, a collaboration backend's admin console
where one is published beside the instance, directory listings, the documented
demo accounts, debug endpoints and ports, iframe embedding, basic auth and
version disclosure.
A failed additional check caps the rating (critical -> D, high -> C, medium
-> A, low -> A+); set scanner.extra_checks_rating: false to report them
without touching the rating.
What the scanner reads, and what it deliberately does not is the full inventory: every endpoint, every check and its severity, the observations that are recorded but never graded - who signs users in, what is in front of the instance, which office and calendar integrations are visible - how the version is read correctly, which debug ports are probed, and the questions a scan from outside cannot answer at all.
The reasoning behind each group of checks has a page of its own:
docs/csp.md, docs/tls.md,
docs/cookies.md,
docs/authentication.md,
docs/sharing.md, docs/exposure.md,
docs/embedding.md,
docs/lifecycle.md and
docs/status-php.md.
Everything a scan cannot see - the audit log, the firewall, your identity provider's policy, your backups - is Running OpenCloud in a secure infrastructure.
TLS and self-signed certificates
OpenCloud's proxy terminates TLS itself on port 9200, and opencloud init
generates a self-signed certificate for it. Many deployments then put a reverse
proxy with a real certificate in front; many others do not. See
docs/tls.md for every TLS and certificate check this scanner
runs and why each one matters.
The scanner handles both without needing to be told which one it is looking at:
- HTTPS with certificate verification. If that works, everything is fine.
- HTTPS without verification. The scan continues and reports
tlsTrustedas a failed check - you still get the full result, plus the fact that the chain is not trusted. - Plain HTTP, reported as
httpsAvailable(critical).
--insecure (COS_INSECURE) skips step 1. The untrusted chain is still
listed in the output; it just stops counting against the rating. Use it for an
instance you know is self-signed, so that a genuinely broken certificate
elsewhere still stands out.
Debug ports
Every OpenCloud service has a debug listener that serves /healthz,
/readyz, /metrics, /config and /debug/pprof. They bind to loopback by
default, so a debug port that answers from your monitoring host is a genuine
finding - usually a container that published the whole port range. The scanner
probes the five most informative ones (9205, 9141, 9124, 9134, 9239), each a
single TCP connect with a three second timeout, so a firewalled host costs up
to 15 seconds.
scanner:
  check_debug_ports: true
  debug_ports: [9205, 9141]
  debug_port_timeout: 1
  concurrency: 8            # run the probes in parallel instead
Turn them off entirely with --no-debug-ports. Which port belongs to which
service, and how scanner.concurrency shortens a run without changing a
verdict, is in
Debug ports.
End-of-life detection
A version number on its own does not tell you whether an OpenCloud instance is still receiving security fixes, because OpenCloud maintains three kinds of releases at the same time:
| Track | Cadence | Supported until | Support |
|---|---|---|---|
| Rolling | about every 3 weeks | its successor is released | community |
| Production | about every 6 months | the next production release | professional |
| LTS | a production line | 2 years after the line opened | professional |
See the OpenCloud release lifecycle for the authoritative description.
Where the tracks stand today, straight from the bundled schedule:
| Track | Current release | Line | Line opened | Supported until |
|---|---|---|---|---|
| Rolling | 7.5.0 |
7.5 |
2026-08-25 | the next rolling release |
| Production | 7.2.4 |
7.2 |
2026-06-25 | the next production release |
| LTS | 4.0.8 |
4.0 |
2025-12-01 | 2027-12-01 |
Read from the OpenCloud release lifecycle on 2026-08-26.
A line that is out of support is rated F and reported as CRITICAL:
CRITICAL: The 7.3 rolling release line is end-of-life and has no security fixes. Upgrade to 7.4.0.
OpenCloud 7.3.0 on cloud.example.com, rating: F, last scanned: 2026-08-12 15:18:08.839323
Release lifecycle: 7.3 (rolling), out of support since 2026-08-03, upgrade to 7.4.0
A supported line reports how much time is left, which is what makes an LTS instance worth monitoring at all:
Release lifecycle: 4.0 (lts), supported until 2027-12-01 (476 days left)
The remaining window is also published as the support_days_left performance
value, so a graph shows it shrinking - and going negative once the line is
overdue.
scanner:
  use_release_schedule: true      # false disables the EOL check entirely
  # release_schedule: /etc/check-opencloud-security/schedule.json
Or via the environment: COS_SCANNER_USE_RELEASE_SCHEDULE,
COS_SCANNER_RELEASE_SCHEDULE.
Why the same version can be current on one track and long dead on another, how the schedule is built and refreshed, and what happens when an instance is newer than the file it is judged against, is in Release tracks, end of life and the update recommendation.
Advisory database
Known vulnerabilities are matched against the version range
[introduced, fixed) of a local advisory database. Sources are merged in this
order and de-duplicated by id:
- the file bundled with the package,
- every file in
scanner.vulnerability_db, - the JSON feed in
scanner.vulnerability_feed.
The native format ({"advisories": [{"id": ..., "introduced": ..., "fixed": ...}]}), the GitHub Advisory API format and OSV documents are all
understood, so an air-gapped setup can mirror a feed to a file without
conversion. A feed that is unreachable is logged and ignored - it never turns a
healthy instance into UNKNOWN.
The bundled database is empty. At the time of writing no CVE or GHSA has been published for OpenCloud, so
vulnerabilities: []means "nothing in the database you configured matched", not "this version is known to be safe". The rating you get is driven by the configuration checks above. Pointscanner.vulnerability_feedat OSV or your own advisory mirror to make that part of the check meaningful.
Running the scanner as a service
The package ships a second entry point, check-opencloud-scanner. It runs the
very same scanner, either once or as a service:
# one-shot: print the full result document as JSON
check-opencloud-scanner scan opencloud.example.com

# as a service, on this machine only
check-opencloud-scanner serve --port 8811
| Endpoint | Behaviour |
|---|---|
POST /api/queue (url=<host>) |
Scan the host, return {"uuid": ...} |
GET /api/result/<uuid> |
Return the stored result |
POST /api/requeue (url=<host>) |
Discard the cache and scan again |
GET /api/scan?url=<host> |
Convenience: scan and return the document |
GET /healthz |
Liveness probe |
The plugin does not talk to this service - it has no remote backend and
always scans in process. The service exists so that several consumers (a
dashboard, a script, a second monitoring system) can share one cached result,
and so that scans can run from a host closer to the instance than the
monitoring server is. Results are cached per host for service.cache_ttl
seconds, 15 minutes by default.
It listens on 127.0.0.1 unless you say otherwise, and any other address
requires a token. The service scans whatever host a request names, and it
does not validate that host against anything - that is the plugin's trust
model, where an operator names their own instances. Reachable by strangers and
unauthenticated, the same property makes it a way to read the inside of the
network it runs on. So --listen/COS_SERVICE_LISTEN anywhere but loopback
without --token/COS_SERVICE_TOKEN refuses to start rather than serving
open. See ADR 0030.
Running it in a container, and the ready-made
docker/docker-compose.monitoring.yml
that starts the scanner plus a check container with Docker secrets, are in
Running the scanner as a service.
The plain docker compose up in that directory is the public web application
instead - see the web application.
Update check
There is no update endpoint on an OpenCloud instance, so "is this the newest
release?" is answered by comparing the productversion the instance reports
against the OpenCloud release feed on GitHub. --update-source selects where
that number comes from:
| Mode | Behaviour |
|---|---|
auto (default) |
Try the feed; on any failure fall back to the release bundled with the package |
feed |
Only the feed. A failure is reported as unknown rather than silently ignored |
pinned |
Use --latest-version. No network access |
bundled |
Use the release recorded in the shipped data file. No network access |
off |
Skip the update check entirely (same as --no-update-check) |
# ask GitHub, with a token to stay clear of the anonymous rate limit
check-opencloud-security --host opencloud.example.com \
  --release-token 'secret://releases_token'

# fully offline: compare against a version you control
check-opencloud-security --host opencloud.example.com --latest-version 7.4.0
The anonymous GitHub API allows sixty requests per hour and IP address, shared
with everything else on that address. A token - a fine-grained one without any
permission is enough - raises that considerably. In auto mode a rate-limited
lookup is not an error: the check falls back to the bundled release, which is
as new as the installed package.
The result is reported as an extra output line and as the update_available
performance metric; with --update-warning a pending update turns an otherwise
OK result into WARNING. A failing update check never aborts the security
check.
The recommendation follows your track, not the newest release overall. A
release feed only knows the newest release, and on OpenCloud that is always a
rolling one; recommending it to a production or LTS instance would quietly move
it onto a three-week support window. --release-track says which track you are
on when the schedule should not work it out for itself. Both, with the tables
that say what is recommended for which installed version, are in
Release tracks, end of life and the update recommendation.
Configuration file and secrets
All settings can live in a file instead of the command line, and the quickest way to write one is to let the plugin ask:
check-opencloud-security --configure
The wizard asks for the one required setting - the host - explains what it is
for, and shows an example. Everything else has a working default, so the
optional settings are offered group by group and only asked for if you say
yes. The result is written as JSON with mode 0600, and found automatically
from then on:
check-opencloud-security # no arguments needed any more
Use --config to say where it should go, e.g.
--configure --config /etc/check-opencloud-security/.env.json. An existing
file is shown and confirmed before it is replaced. The equivalent for the
scanner on its own is check-opencloud-scanner configure.
The file is read from --config, COS_CONFIG_FILE, ./.env.json,
./check-opencloud-security.yml, ~/.config/check-opencloud-security/.env.json
or /etc/check-opencloud-security/ (first match wins). A .json suffix is
read as JSON, anything else as YAML - the two are interchangeable. See
config/check-opencloud-security.example.yml
for a fully commented example.
host: opencloud.example.com
check_hardening: true

scanner:
  verify_tls: false        # self-signed instance
  target_port: 9200
  tls_min_days: 21
  check_debug_ports: true

releases:
  mode: auto
  token: secret://releases_token
Nested keys map one to one onto the environment variables: scanner.target_port
is COS_SCANNER_TARGET_PORT, releases.token is COS_RELEASES_TOKEN,
scanner.tls_min_days is COS_SCANNER_TLS_MIN_DAYS. Precedence is
command line > environment variable > configuration file > default.
Secrets never have to be written into the file or the process environment.
Any value may instead be a secret://, file://, env:// or exec://
reference, or be named with a _file suffix pointing at a file - see
Secrets in the configuration.
Rating thresholds
The scanner grades an instance from A+ (best) down to F. The plugin maps
that grade to a numeric rating and compares it against two inclusive
thresholds:
| Rating | 5 | 4 | 3 | 2 | 1 | 0 |
|---|---|---|---|---|---|---|
| Grade | A+ |
A |
C |
D |
E |
F |
-c, --critical/COS_CRITICAL(default1, i.e.E) - a rating at or below this value isCRITICAL.-w, --warning/COS_WARNING(default3, i.e.C) - a rating at or below this value isWARNING.
Two rules always apply on top of the thresholds:
- Known vulnerabilities raise the state to at least
WARNING, even when the overall rating still looks acceptable. The reported identifiers are listed in the output. - An end-of-life version is always
CRITICAL, because it receives no security fixes at all.
A single critical finding does not page by default. The worst finding caps the rating rather than setting it: critical caps at
2(D), which the default--critical 1still reports asWARNING. That is deliberate - it keeps one exposed path from being indistinguishable from an end-of-life instance. If a critical finding should wake somebody up, run with--critical 2.
A rating outside the documented 0-5 range yields UNKNOWN. --critical
must not be higher than --warning, and both must be within 0-5; otherwise
the plugin refuses to run.
# Only alert once the instance is actually end-of-life
check-opencloud-security --host opencloud.example.com --warning 1 --critical 0

# Page on any critical finding
check-opencloud-security --host opencloud.example.com --warning 4 --critical 2
Hardening checks
Besides the pass/fail checks above, the scanner reports which hardening
measures the instance has in place. With --check-hardening /
COS_CHECK_HARDENING these are evaluated as well.
The names are terse because they end up in alert text. Run the plugin with
--debug to get the explanation printed next to the finding, or read them all
at once: Hardening measures, one by one says what each
identifier means, what a failure actually indicates and which OpenCloud
environment variable changes it - along with the two measures nobody can
influence, and how to accept a finding you are not going to fix with
--ignore-hardening.
Two further entries can show up in the "Missing hardening" line: httpsEnforced
when the instance does not enforce HTTPS, and the name of any security header
from setup.headers that is absent or too weak (e.g.
Strict-Transport-Security). --debug explains those too.
Anything reported as missing is listed in the output and exported as the
hardenings_missing performance metric. A result that would otherwise be OK
is raised to WARNING; an existing WARNING/CRITICAL is never downgraded.
check-opencloud-security --host opencloud.example.com --check-hardening
Some findings are real but not actionable in your environment: a CSP you cannot
tighten without breaking the web UI, an HSTS header your reverse proxy owns.
--ignore-hardening accepts one by name, and the rating is recalculated
without it - but the finding stays in the JSON result, flagged "ignored": true, because a waiver suppresses an alert and not the evidence:
check-opencloud-security --host opencloud.example.com --check-hardening \
    --ignore-hardening 'cspWithoutUnsafeInline,hstsPreload'
See Accepting a finding you are not going to fix for the wildcards, what a waiver will not do, and why a configuration file is the better home for one.
Explaining a rating
A rating on its own is a verdict without an argument. -d / --debug (or
COS_DEBUG=1) adds the reasoning to the output: where the rating started, what
pulled it down, and what every identifier in the report means.
check-opencloud-security --host opencloud.example.com --check-hardening --debug
--- Why this rating ---
Starting point: 5/5 - the installed release is current and no advisory matches this version
Failed check basicAuthDisabled [medium] caps the rating at 4/5 - WWW-Authenticate: Basic realm="..."
Final rating: 4/5 (B). WARNING at or below C, CRITICAL at or below E.

--- Missing hardening measures ---
basicAuthDisabled: HTTP Basic authentication is enabled
    The instance answers with a 'WWW-Authenticate: Basic' challenge, so usernames
    and passwords can be replayed on every request without going through the
    identity provider ... It is often deliberate: CalDAV, CardDAV and WebDAV
    clients cannot speak OpenID Connect and have nothing else to authenticate
    with, which is why this counts as a medium finding rather than a serious one.
    Setting: PROXY_ENABLE_BASIC_AUTH
    Fix: Set PROXY_ENABLE_BASIC_AUTH=false (the default) if nothing needs it. If
    calendar, contact or WebDAV clients do, keep it on and give them app tokens
    rather than account passwords.
    Docs: https://docs.opencloud.eu/docs/dev/server/services/proxy/environment-variables
--- end of explanation ---
The starting point is what the version and the advisory database alone would
give: 5 up to date, 4 a patch update pending, 3 a whole release line
behind, 2 known vulnerabilities, 1 critical or high ones, 0 end of life.
Failed additional checks then cap it by severity - critical to 2, high to
3, medium to 4, low to 5. A check that failed but did not decide the
outcome is still listed, marked as such, so nothing looks quietly dropped.
Without --debug the output stays the size a monitoring system wants. The
same breakdown is always present in the scan result as ratingExplanation, so
it can be read without rerunning the check:
python -m opencloud_local_scan.cli scan opencloud.example.com | jq .ratingExplanation
Note that --debug also switches logging to DEBUG, so HTTP-level detail
goes to stderr while the explanation goes to stdout with the rest of the
plugin output.
What would raise the rating
Knowing why a rating is a C is only half of what an operator wants. The other half is which two things to fix to make it an A+, and in which order.
Every scan result carries a remediationPlan, worked out by replaying the
rating arithmetic with one finding removed at a time. Because it is a replay
of the same code that produced the rating, the predicted grades cannot drift
away from the real ones - and because it is derived, nothing extra is stored.
python -m opencloud_local_scan.cli scan opencloud.example.com | jq .remediationPlan
--debug prints the same list under the explanation:
--- What would raise the rating ---
Two fixes would raise this instance from 3/5 to 5/5.
1. exposed:/opencloud.yaml [high] - then 4/5 (B)
    A deployment file is publicly readable (/opencloud.yaml)
    Observed: HTTP 200 with 4.1 kB of YAML
    Fix: Stop serving the deployment directory. Proxy to OpenCloud's own
    address rather than exposing the filesystem ...
2. basicAuthDisabled [medium] - then 5/5 (A+)
    HTTP Basic authentication is enabled
    Fix: Set PROXY_ENABLE_BASIC_AUTH=false (the default) if nothing needs it ...
Three things about that list are worth knowing before acting on it:
- The order is not arbitrary. Findings of the same severity share one
ceiling, so fixing the first of three medium findings changes nothing at
all. Steps that gain nothing on their own are still listed - with
still 4/5rather thanthen 5/5- because leaving them out would suggest they can be skipped. - An update can be one of the steps. Fixing findings can never lift a rating above what the installed version allows, so the plan inserts the upgrade at the point where it actually starts to gain something.
- Some findings can never be fixed. Flags OpenCloud hardcodes are listed separately as blocked, and they bound how far the plan can reach. See Measures that are not settings.
Waived findings are listed too, marked as waived: a waiver silences an alert, it does not fix anything, and the plan says so.
The same plan appears on the web dashboard, in the JSON, CSV, SARIF and PDF
exports, and as the plan_remediation MCP tool.
Webhook notifications
The plugin can post a JSON notification to an HTTP(S) endpoint when a check
reaches a critical level. The feature is optional and disabled by default -
it activates only once --webhook-url (or COS_WEBHOOK_URL) is set.
check-opencloud-security --host opencloud.example.com \
  --webhook-url https://hooks.example.com/opencloud
--webhook-on/COS_WEBHOOK_ON(defaultcritical) selects the lowest state that triggers a notification. Each level includes the more severe ones:critical,warning(WARNING + CRITICAL),unknown(UNKNOWN + WARNING + CRITICAL) andalways.--webhook-format/COS_WEBHOOK_FORMAT(defaultgeneric) posts the body as a Slack Block Kit attachment (slack, also accepted by Mattermost and the common Matrix webhook bridges) or a Discord embed (discord) instead of the plugin's own flat document. The default is unchanged, so this is entirely opt-in:check-opencloud-security --host opencloud.example.com \ --webhook-url https://hooks.slack.com/services/... \ --webhook-format slack
Anything else - ntfy, Alertmanager, a custom receiver - still wants thegenericdocument; Webhook recipes has one for each.--webhook-header/COS_WEBHOOK_HEADERSadds request headers, e.g. for authentication. Repeat the flag, or separate entries with;in the environment variable:COS_WEBHOOK_HEADERS="X-Auth-Token: abc; X-Env: prod".--webhook-timeout/COS_WEBHOOK_TIMEOUT(default10) limits the webhook call; it is independent of the scan--timeout.- Webhook destinations that resolve to private, loopback, or link-local
addresses are blocked to prevent server-side request forgery. Set
--allow-private-webhooksorCOS_ALLOW_PRIVATE_WEBHOOKS=trueonly for an intentional internal receiver.
Delivery reuses --retries / --backoff-factor. A failing webhook never
changes the check result - the plugin appends Webhook delivery failed to
its output and still exits with the state it measured, so a broken
notification channel cannot hide (or fake) a vulnerable instance.
When several hosts are checked in one run, each host that reaches the
configured state produces its own notification. Scans that fail outright
(unreachable host, broken TLS) notify as well when --webhook-on is set to
unknown or always.
Note: treat the webhook as a supplement to your monitoring system, not a replacement. It is fire-and-forget and is not retried beyond the configured retry budget.
Webhook recipes has the full payload field by field, how to verify its signature, and an adapter for each receiver that wants its own JSON - Slack, Discord, ntfy, Alertmanager - along with Uptime Kuma, whose Push monitor takes the document as it is and treats silence as a failure, so a check that stopped running shows up too.
Reporting only what changed
A check that runs every five minutes reports the same finding until someone
fixes it, which is how people learn to acknowledge an alert and stop reading
it. --baseline writes the findings of each run to a file and compares the
next run against it; --warn-on-new then reports OK while the picture is
unchanged, and its normal status as soon as anything is new or worse:
check-opencloud-security -H opencloud.example.com \
    --check-hardening \
    --baseline /var/lib/check_opencloud/baseline.json \
    --warn-on-new
The full state is still printed either way - only the alert is suppressed, never the evidence. An end-of-life release always alerts, however long it has been in the baseline.
Reporting only what changed has the diff formats
(text, markdown, slack, json), what counts as a regression, and the
rules that keep a baseline from hiding anything.
Is the plugin itself up to date?
The plugin reports on OpenCloud's updates but says nothing about its own age,
and a check running an old advisory database is a blind spot. --self-update-check
asks PyPI once a day and appends a note:
Plugin update available: check-opencloud-security 1.2.0 is published, this is 1.1.0 (upgrade with --upgrade-self)
It is off by default, cached under ${XDG_CACHE_HOME:-~/.cache}/check-opencloud-security/,
and never changes the exit code: whether PyPI answered says nothing about
the health of the instance being monitored. Every failure - no network, a
proxy in the way, PyPI down - is silent.
Upgrade with --upgrade-self, or look at what it would do first
with --upgrade-self check (--upgrade-self --check-only is the same thing).
Retries and backoff
Transient network errors (timeouts, connection resets, 5xx responses from the
instance) are retried automatically with exponential backoff before the check
gives up and reports UNKNOWN.
--retries/COS_RETRIES(default2) - number of retry attempts after the initial try (so the default performs up to 3 attempts total).--backoff-factor/COS_BACKOFF_FACTOR(default0.5) - base delay in seconds; the wait before each retry doubles (backoff_factor * 2^attempt), e.g.0.5s,1s,2s, ...--timeout/COS_TIMEOUT(default10) - how long a single request may take before it counts as a failure. Raise it on slow links or when scanning through a proxy.
Set --retries 0 to disable retries entirely and fail fast. A retry re-runs
the whole scan, so a high retry count on an unreachable host makes the check
take noticeably longer than the timeout alone suggests.
Performance data
Output includes standard Nagios/Icinga performance data after a |
character, so Icinga2/Grafana/etc. can graph results over time:
rating=5;@0:3;@0:1;0;5 vulnerabilities=0;;;0; time=1.234s;;;0;
The rating metric carries the configured WARNING and CRITICAL thresholds in
Nagios range syntax (@0:3 means "warn inside 0-3"), so Icinga2 draws them on
the graph without extra configuration.
| Metric | Meaning |
|---|---|
rating |
Numeric scan rating, 0-5 (5=A+ ... 0=F), U if unknown |
vulnerabilities |
Number of known vulnerabilities reported for the scanned version |
time |
Time spent on the scan, in seconds |
hardenings_missing |
Missing hardening measures (only with --check-hardening) |
extra_checks_failed |
Number of failed additional checks |
update_available |
1 when a newer OpenCloud release exists |
support_days_left |
Days until the release line loses support (negative when overdue) |
Outside Icinga2, the same numbers reach Prometheus through the node_exporter textfile collector or a Pushgateway - see Prometheus and Grafana.
Caching
The plugin holds no cache: every run scans the instance afresh, so there is nothing to invalidate and no flag to force a fresh scan.
The one place caching does happen is the optional
scan service, which reuses a result for
service.cache_ttl seconds. POST /api/requeue discards it and scans again.
Example output
A healthy instance:
$ check-opencloud-security -H opencloud.example.com
OK: Server is up to date. No known vulnerabilities.
OpenCloud 7.4.0 on opencloud.example.com, rating: A+, last scanned: 2026-05-29 08:50:58.000000
Additional checks: all passed | rating=5;@0:3;@0:1;0;5 vulnerabilities=0;;;0; time=0.731s;;;0; extra_checks_failed=0;;;0;
A major release that no longer receives fixes - always CRITICAL, regardless of the thresholds:
$ check-opencloud-security -H opencloud.example.com
CRITICAL: The 7.3 rolling release line is end-of-life and has no security fixes. Upgrade to 7.4.0.
OpenCloud 1.0.0 on opencloud.example.com, rating: F, last scanned: 2026-05-30 07:48:58.000000
Additional checks: all passed | rating=0;@0:3;@0:1;0;5 vulnerabilities=0;;;0; time=0.842s;;;0; extra_checks_failed=0;;;0;
A single critical finding caps the rating at D, which the default thresholds
report as WARNING - see Rating thresholds:
$ check-opencloud-security -H opencloud.example.com
WARNING: Rating D is at or below the warning threshold C, but no known vulnerabilities.
OpenCloud 7.4.0 on opencloud.example.com, rating: D, last scanned: 2026-05-29 08:51:33.000000
Additional checks failed (1): exposed:/opencloud.yaml | rating=2;@0:3;@0:1;0;5 vulnerabilities=0;;;0; time=0.860s;;;0; extra_checks_failed=1;;;0;
With --check-hardening on a production instance whose proxy still offers
HTTP Basic authentication:
$ check-opencloud-security -H opencloud.example.com --check-hardening
WARNING: 3 hardening measure(s) missing, but no known vulnerabilities.
OpenCloud 7.2.3 on opencloud.example.com, rating: B, last scanned: 2026-08-12 15:58:04.138671
Release lifecycle: 7.2 (production), current release
Missing hardening: basicAuthDisabled, cspWithoutUnsafeInline, publicLinkPasswordEnforced (run with --debug for what each means and how to fix it)
Additional checks failed (1): basicAuthDisabled
Update check (feed, installed 7.2.3): up to date | rating=4;@0:3;@0:1;0;5 vulnerabilities=0;;;0; time=1.835s;;;0; hardenings_missing=3;;;0; extra_checks_failed=1;;;0; update_available=0;;;0;1
The rating dropped to B because basicAuthDisabled is also an additional
check, and a failed medium check caps the rating at 4. A hardening measure
that is only a hardening measure raises the state to WARNING without
lowering the grade. Add --debug to have the check spell that out, along with
what each identifier means - see
Explaining a rating.
Deployment guides
The longer deployment walk-throughs live in docs/, so that
this file stays the reference for the options themselves. The index there is
grouped by what you are trying to do; the ones people reach for first:
| Guide | What it covers |
|---|---|
| Running OpenCloud in a secure infrastructure | Everything a scan cannot see: an external identity provider, the audit log, the firewall, and where continuous monitoring fits |
| Installing the plugin | pipx/uv/pip, updating, shell completion, Docker, and the Icinga2 and Nagios objects |
| CLI option reference | Every flag, its default, and the environment variable that sets the same thing |
| Worked examples | Complete invocations for the situations that come up most often |
| The public scan service | The web application: FastAPI, an ARQ worker and Redis, with queueing, SSRF protection and rate limits |
| Using the scanner from an AI agent | The MCP endpoint, configured for Claude Code, Claude Desktop, Copilot, Cursor, Zed and Windsurf |
| Troubleshooting | The errors people actually hit, and the exit code reference |
Something not working? Start with Troubleshooting, which also carries the exit code reference.
Examples
Complete, copy-and-paste invocations for the situations that come up most often - the basics, release tracks, waivers, instances that are not on the public internet, thresholds and notifications, an Icinga2 apply rule and the scanner on its own - are collected in Worked examples.
# A production instance, hardening reported, two findings accepted,
# notified on anything worse than OK - a realistic complete invocation
check-opencloud-security --host opencloud.example.com \
    --release-track production \
    --check-hardening \
    --ignore-hardening 'cspWithoutUnsafeInline,hstsPreload' \
    --update-warning \
    --warning 4 --critical 2 \
    --webhook-url https://hooks.example.com/opencloud \
    --webhook-on warning
Contributing
Bug reports, feature requests and pull requests are welcome. ARCHITECTURE.md is the map: the three layers, the agent-facing surfaces, where a new check, setting, endpoint or MCP tool belongs, and which decisions already have an architectural record. See CONTRIBUTING.md for the development setup, the test suite, the linting rules and how releases are cut, and CODE_OF_CONDUCT.md for what to expect from everyone involved.
The issue templates ask for the --debug output, which is usually what a fix
depends on. Redact tokens and real hostnames before you paste anything -
use opencloud.example.com, as the codebase does throughout.
Found a vulnerability in the plugin? Do not open an issue - report it privately, as described in SECURITY.md.
License
Licensed under the terms of GNU General Public License v3.0. See LICENSE file.
This project is built for OpenCloud, whose work makes secure, self-hosted collaboration possible. Thank you to the OpenCloud team.
Trademarks and affiliation
This is an independent community project. It is not affiliated with, endorsed by, sponsored by or supported by OpenCloud GmbH, and nothing it reports is an official statement about OpenCloud software.
"OpenCloud", the OpenCloud logo and all related names and marks are the property of their respective owners. They appear here only to identify the software this tool checks, which is nominative use and implies no relationship. All rights in OpenCloud remain with OpenCloud GmbH.




1 maintainer

Download files
Download the file for your platform. If you're not sure which to choose, learn more about installing packages.
Source Distribution
Built Distribution
Filter files by name, interpreter, ABI, and platform.
If you're not sure about the file name format, learn more about wheel file names.
Copy a direct link to the current filters
File details
Details for the file check_opencloud_security-1.20.0.tar.gz.
File metadata
- Download URL: check_opencloud_security-1.20.0.tar.gz
- Upload date:
- Size: 541.4 kB
- Tags: Source
- Uploaded using Trusted Publishing? Yes
- Uploaded via:
uv/0.12.9 {"installer":{"name":"uv","version":"0.12.9","subcommand":["publish"]},"python":null,"implementation":{"name":null,"version":null},"distro":{"name":"Ubuntu","version":"24.04","id":"noble","libc":null},"system":{"name":null,"release":null},"cpu":null,"openssl_version":null,"setuptools_version":null,"rustc_version":null,"ci":true}
File hashes
| Algorithm | Hash digest | |
|---|---|---|
| SHA256 |
e23c53dc0977f941aa1d28630a9349a12ea6fe95c5f8e2280deb54fcc10cc150
|
|
| MD5 |
22e11488a6b99dd9da37355b443bb020
|
|
| BLAKE2b-256 |
30715ff366bd76b2c68a835088a1ed7885b1096c19ef5a172f0946ded44c9b8a
|
File details
Details for the file check_opencloud_security-1.20.0-py3-none-any.whl.
File metadata
- Download URL: check_opencloud_security-1.20.0-py3-none-any.whl
- Upload date:
- Size: 268.7 kB
- Tags: Python 3
- Uploaded using Trusted Publishing? Yes
- Uploaded via:
uv/0.12.9 {"installer":{"name":"uv","version":"0.12.9","subcommand":["publish"]},"python":null,"implementation":{"name":null,"version":null},"distro":{"name":"Ubuntu","version":"24.04","id":"noble","libc":null},"system":{"name":null,"release":null},"cpu":null,"openssl_version":null,"setuptools_version":null,"rustc_version":null,"ci":true}
File hashes
| Algorithm | Hash digest | |
|---|---|---|
| SHA256 |
9be6e781e9c1b8470eb0fc432f746a5a49e782a2ce0b5f01c8b4f85a24ded472
|
|
| MD5 |
7de7a2981af56fbaf56f3d875b8c20c4
|
|
| BLAKE2b-256 |
beb53f64a9034ac616fc537f1cab875a41688b687399d044fdcb1056720cc9e4
|














