Windows tray widget + dashboard for Claude plan usage (5-hour & weekly limits)
Verified details
These details have been verified by PyPIProject links
GitHub Statistics
Maintainers

Project description

Claude Usage Tracker
A small Windows desktop widget that tracks your Claude plan limits — the 5-hour
and weekly usage windows, the exact numbers the /usage command shows — with a
live always-on-top widget, a glass dashboard, a tray icon, and a toast notification
every time usage crosses a 20% mark.
It reads the OAuth token Claude Code already stores on your machine and calls the
same endpoint /usage uses. Read-only — it never modifies your credentials and
talks to nothing but that one Anthropic endpoint.
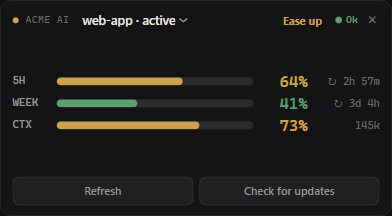
The always-on-top mini widget (sample data)
The full dashboard — gauges, live reset countdowns, burn-rate, history, overage credits, and Open Sessions (sample data)
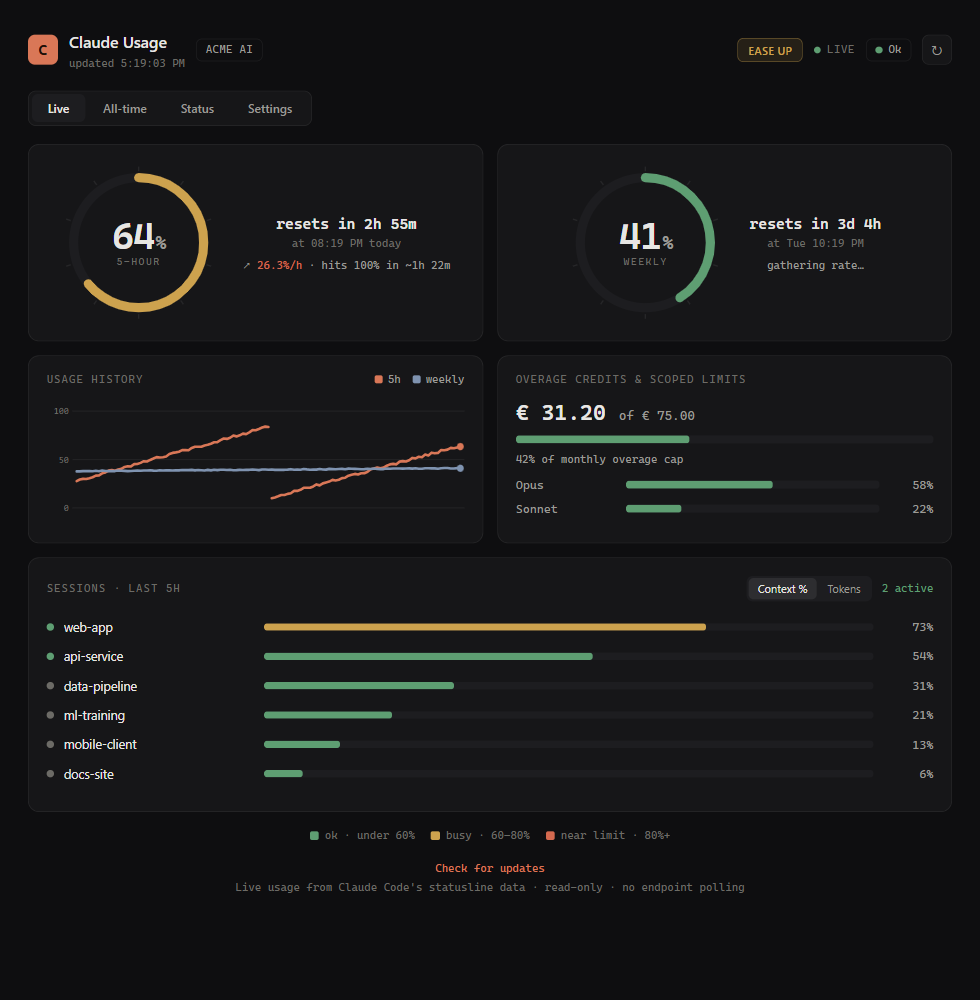
Open Sessions — per-project context-window fill % (toggle to Tokens), with active indicators (sample data)

Features
- Always-on-top mini widget — a tiny frameless, draggable strip (5h, weekly, and the active terminal's context %) that stays on top. Toggle it from the tray.
- Full dashboard — animated ring gauges, live reset countdowns, a burn-rate / time-to-limit projection ("≈7%/h · hits 100% in ~1h 10m"), a usage history sparkline, overage credits, and per-model (Opus/Sonnet) scoped weekly limits.
- Open Sessions — per-project context-window fill % and last-5h token usage, read from your local Claude Code logs (token counts only, never content), with Context % / Tokens tabs and active indicators — see which terminal is burning your usage.
- Live tray icon — two bars (left = 5h, right = weekly) that fill and change colour with usage.
- 20% notifications — a Windows toast each time the 5h or weekly window crosses 20 / 40 / 60 / 80 / 100%. The first reading is recorded silently, so you only get pinged on future crossings, never a burst at startup.
- Auto-start on login, single-instance, graceful rate-limit (HTTP 429) back-off, and automatic pickup of account/token changes (it re-reads your login each poll).
Colour scale
Bars and gauges share one scale (low → high):
| Range | 0–20% | 20–60% | 60–80% | 80–90% | 90–99% | 100% |
|---|---|---|---|---|---|---|
| Colour | green | blue | orange | red | black | yellow |
The 90–99% "black" band gets a red glow/outline so it reads as danger rather than empty.
Tray icon at 5/40, 45/72, 85/94, 95/100, and 0/0 percent

Install
Requirements
- Windows 10 / 11
- Python 3.11+ — install from python.org and tick "Add python.exe to PATH"
- Claude Code installed and logged in, so
~/.claude/.credentials.jsonexists - Edge WebView2 runtime (preinstalled on Windows 11; otherwise a free download) — for the dashboard/widget windows
Steps
git clone https://github.com/paris-paraskevas/claude-usage-tracker.git
cd claude-usage-tracker
python install.py
That's all. install.py will:
- create a local virtualenv (
.venv) and install dependencies, - generate the app icon,
- add Desktop + Start Menu + Startup shortcuts (so it auto-starts on login).
Then launch Claude Usage Tracker from the Start Menu or Desktop (or run the
command install.py prints). The mini widget appears top-right and a tray icon
appears by the clock. Uninstall the shortcuts any time with python uninstall.py.
Usage
Launch "Claude Usage Tracker" from the Start Menu/Desktop, or run it directly:
.venv\Scripts\pythonw.exe claude_usage_tracker.py
Tray menu: Show/Hide widget, Open dashboard (native window), Open in
browser, Refresh now, open config/log, Quit. The widget has a × to hide
it; drag it anywhere.
CLI:
.venv\Scripts\python.exe claude_usage_tracker.py --once          # print status once
.venv\Scripts\python.exe claude_usage_tracker.py --once --debug  # + raw API JSON
.venv\Scripts\pythonw.exe claude_usage_tracker.py --widget       # just the widget
.venv\Scripts\pythonw.exe claude_usage_tracker.py --window       # just the dashboard window
.venv\Scripts\python.exe claude_usage_tracker.py --uninstall-autostart
Configuration
Edit config.json (created on first run, in the app's data dir), then restart:
| Key | Default | Meaning |
|---|---|---|
poll_interval_seconds |
60 |
How often to check usage. |
threshold_step |
20 |
Ping every N percent. |
windows |
["five_hour", "seven_day"] |
Which limits to notify on. |
notify_at_100 |
true |
Ping when a limit hits 100%. |
notify_on_start |
true |
One summary toast at launch. |
dashboard_port |
8787 |
Local dashboard port. |
show_widget_on_start |
true |
Show the mini widget at launch. |
widget_width / widget_height |
392 / 150 |
Widget size in pixels. |
How it works
GET https://api.anthropic.com/api/oauth/usage with the bearer token from
~/.claude/.credentials.json (claudeAiOauth.accessToken) and the
anthropic-beta: oauth-2025-04-20 header. The response carries five_hour,
seven_day, scoped per-model weekly limits, overage spend, and reset timestamps —
the same data the CLI's /usage renders.
Token refresh is handled by Claude Code itself; if your login expires, the tracker
shows an error state until you run any claude command to refresh it. The token is
only ever read — never written, logged, or sent anywhere but that endpoint.
Layout
claude_usage_tracker.py   the whole app (tray, server, dashboard+widget HTML, poller)
install.py / uninstall.py shortcut setup / teardown
requirements.txt          pystray, Pillow, winotify, pywebview
docs/                     screenshots
Runtime files (config.json, state.json, history.json, *.log) live next to the
script (or in %LOCALAPPDATA%\ClaudeUsageTracker when packaged) and are git-ignored.
Project details
Verified details
These details have been verified by PyPIProject links
GitHub Statistics
Maintainers
Release history Release notifications | RSS feed


Download files
Download the file for your platform. If you're not sure which to choose, learn more about installing packages.
Source Distribution
Built Distribution
Filter files by name, interpreter, ABI, and platform.
If you're not sure about the file name format, learn more about wheel file names.
Copy a direct link to the current filters
File details
Details for the file claude_usage_tracker-0.1.6.tar.gz.
File metadata
- Download URL: claude_usage_tracker-0.1.6.tar.gz
- Upload date:
- Size: 30.0 kB
- Tags: Source
- Uploaded using Trusted Publishing? Yes
- Uploaded via: twine/6.1.0 CPython/3.13.12
File hashes
| Algorithm | Hash digest | |
|---|---|---|
| SHA256 |
a13dcbe06bcc809efb52e18bc8a1385387213ccd1137e01b224b05cd0853bff3
|
|
| MD5 |
441adb37b85fae82d91b1100ca8184e6
|
|
| BLAKE2b-256 |
7fbf114f5ec371e182960da7045fa9acc3bda3cb18a4c34cabb4efb4afe12481
|
Provenance
The following attestation bundles were made for claude_usage_tracker-0.1.6.tar.gz:
Publisher:
publish.yml on paris-paraskevas/claude-usage-tracker
-
Statement:
-
Statement type:
https://in-toto.io/Statement/v1 -
Predicate type:
https://docs.pypi.org/attestations/publish/v1 -
Subject name:
claude_usage_tracker-0.1.6.tar.gz -
Subject digest:
a13dcbe06bcc809efb52e18bc8a1385387213ccd1137e01b224b05cd0853bff3 - Sigstore transparency entry: 1968274697
- Sigstore integration time:
-
Permalink:
paris-paraskevas/claude-usage-tracker@87b5035dc8cc3dd7c78ef961396eab151dac0ebd -
Branch / Tag:
refs/tags/v0.1.6 - Owner: https://github.com/paris-paraskevas
-
Access:
public
-
Token Issuer:
https://token.actions.githubusercontent.com -
Runner Environment:
github-hosted -
Publication workflow:
publish.yml@87b5035dc8cc3dd7c78ef961396eab151dac0ebd -
Trigger Event:
release
-
Statement type:
File details
Details for the file claude_usage_tracker-0.1.6-py3-none-any.whl.
File metadata
- Download URL: claude_usage_tracker-0.1.6-py3-none-any.whl
- Upload date:
- Size: 30.4 kB
- Tags: Python 3
- Uploaded using Trusted Publishing? Yes
- Uploaded via: twine/6.1.0 CPython/3.13.12
File hashes
| Algorithm | Hash digest | |
|---|---|---|
| SHA256 |
f8262d5f9e769557764fc6313774eb1031b01b86b8e6a1c1634e2471afb88673
|
|
| MD5 |
5e713f848e4540cb1d2b260ebedab9f6
|
|
| BLAKE2b-256 |
11c8072f2053c3ee9da854b2d10ac9f648b7808a713fdd6399dab636116843c3
|
Provenance
The following attestation bundles were made for claude_usage_tracker-0.1.6-py3-none-any.whl:
Publisher:
publish.yml on paris-paraskevas/claude-usage-tracker
-
Statement:
-
Statement type:
https://in-toto.io/Statement/v1 -
Predicate type:
https://docs.pypi.org/attestations/publish/v1 -
Subject name:
claude_usage_tracker-0.1.6-py3-none-any.whl -
Subject digest:
f8262d5f9e769557764fc6313774eb1031b01b86b8e6a1c1634e2471afb88673 - Sigstore transparency entry: 1968274854
- Sigstore integration time:
-
Permalink:
paris-paraskevas/claude-usage-tracker@87b5035dc8cc3dd7c78ef961396eab151dac0ebd -
Branch / Tag:
refs/tags/v0.1.6 - Owner: https://github.com/paris-paraskevas
-
Access:
public
-
Token Issuer:
https://token.actions.githubusercontent.com -
Runner Environment:
github-hosted -
Publication workflow:
publish.yml@87b5035dc8cc3dd7c78ef961396eab151dac0ebd -
Trigger Event:
release
-
Statement type:


