
ClawMetry - Real-time observability dashboard for OpenClaw AI agents

Project description
🦞 ClawMetry






See your agent think. Real-time observability for OpenClaw AI agents.
🌐 Read this in: English · 简体中文 · 日本語 · 한국어 · Español · Português (BR) · Français · Deutsch · हिन्दी · العربية · Русский · more →
One command. Zero config. Auto-detects everything.
pip install clawmetry && clawmetry
Opens at http://localhost:8900 and you're done.
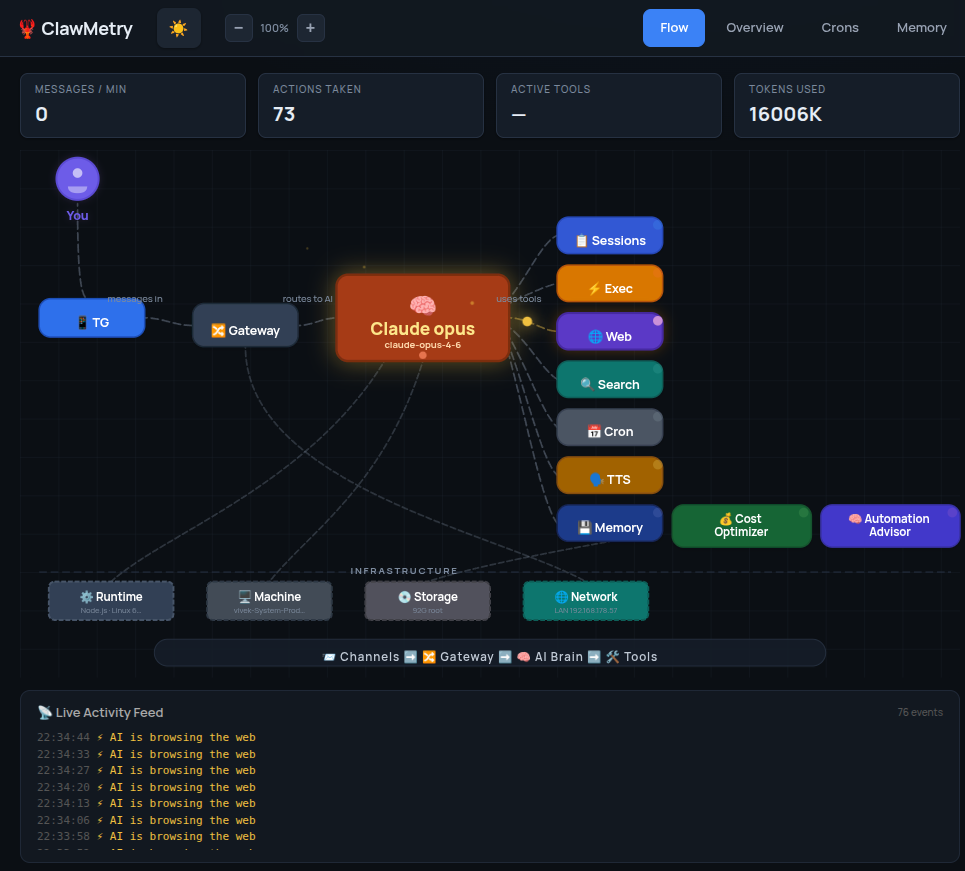
What You Get
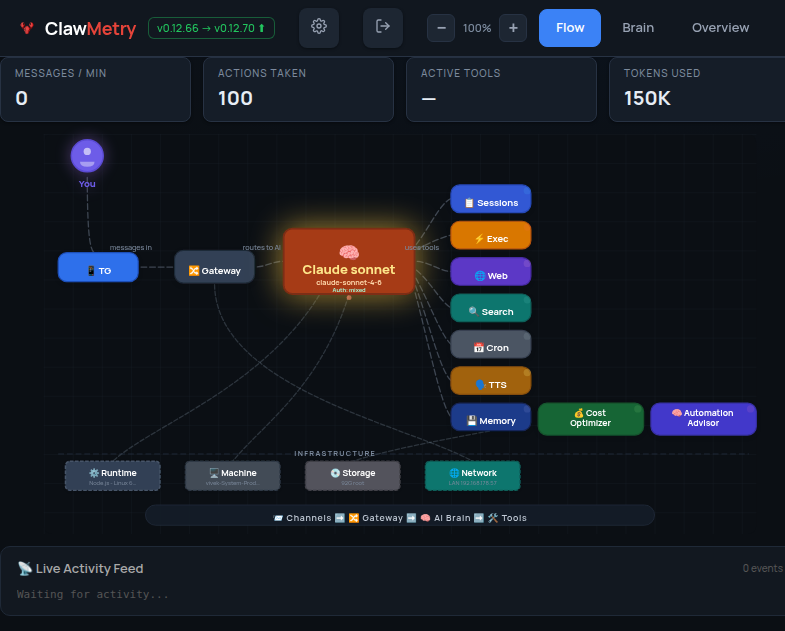
- Flow — Live animated diagram showing messages flowing through channels, brain, tools, and back
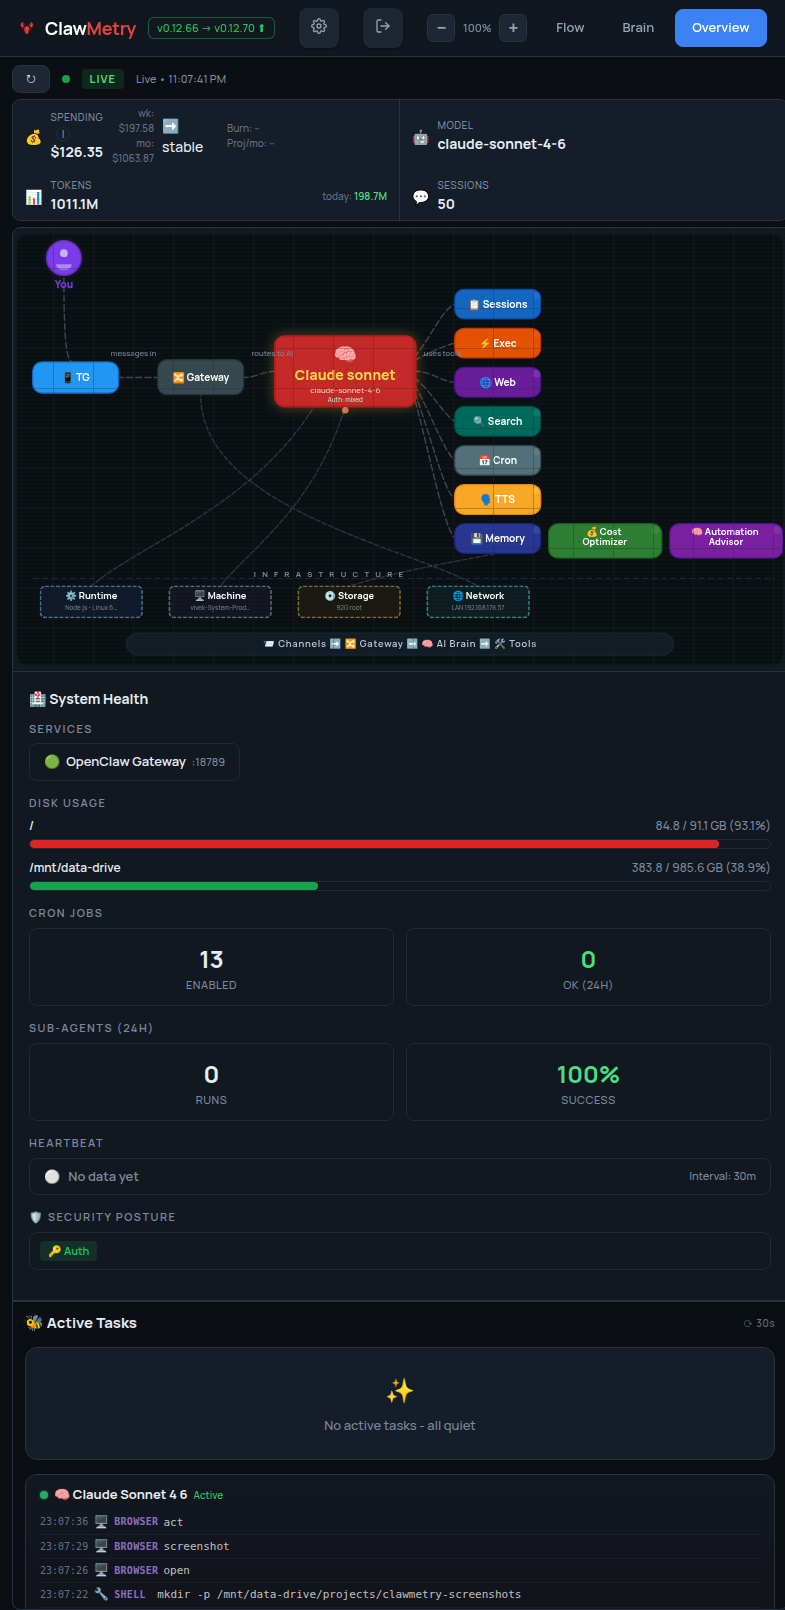
- Overview — Health checks, activity heatmap, session counts, model info
- Usage — Token and cost tracking with daily/weekly/monthly breakdowns
- Sessions — Active agent sessions with model, tokens, last activity
- Crons — Scheduled jobs with status, next run, duration
- Logs — Color-coded real-time log streaming
- Memory — Browse SOUL.md, MEMORY.md, AGENTS.md, daily notes
- Transcripts — Chat-bubble UI for reading session histories
- Alerts — Budget caps, error-rate triggers, agent-offline detection; routes to Slack, Discord, PagerDuty, Telegram, Email
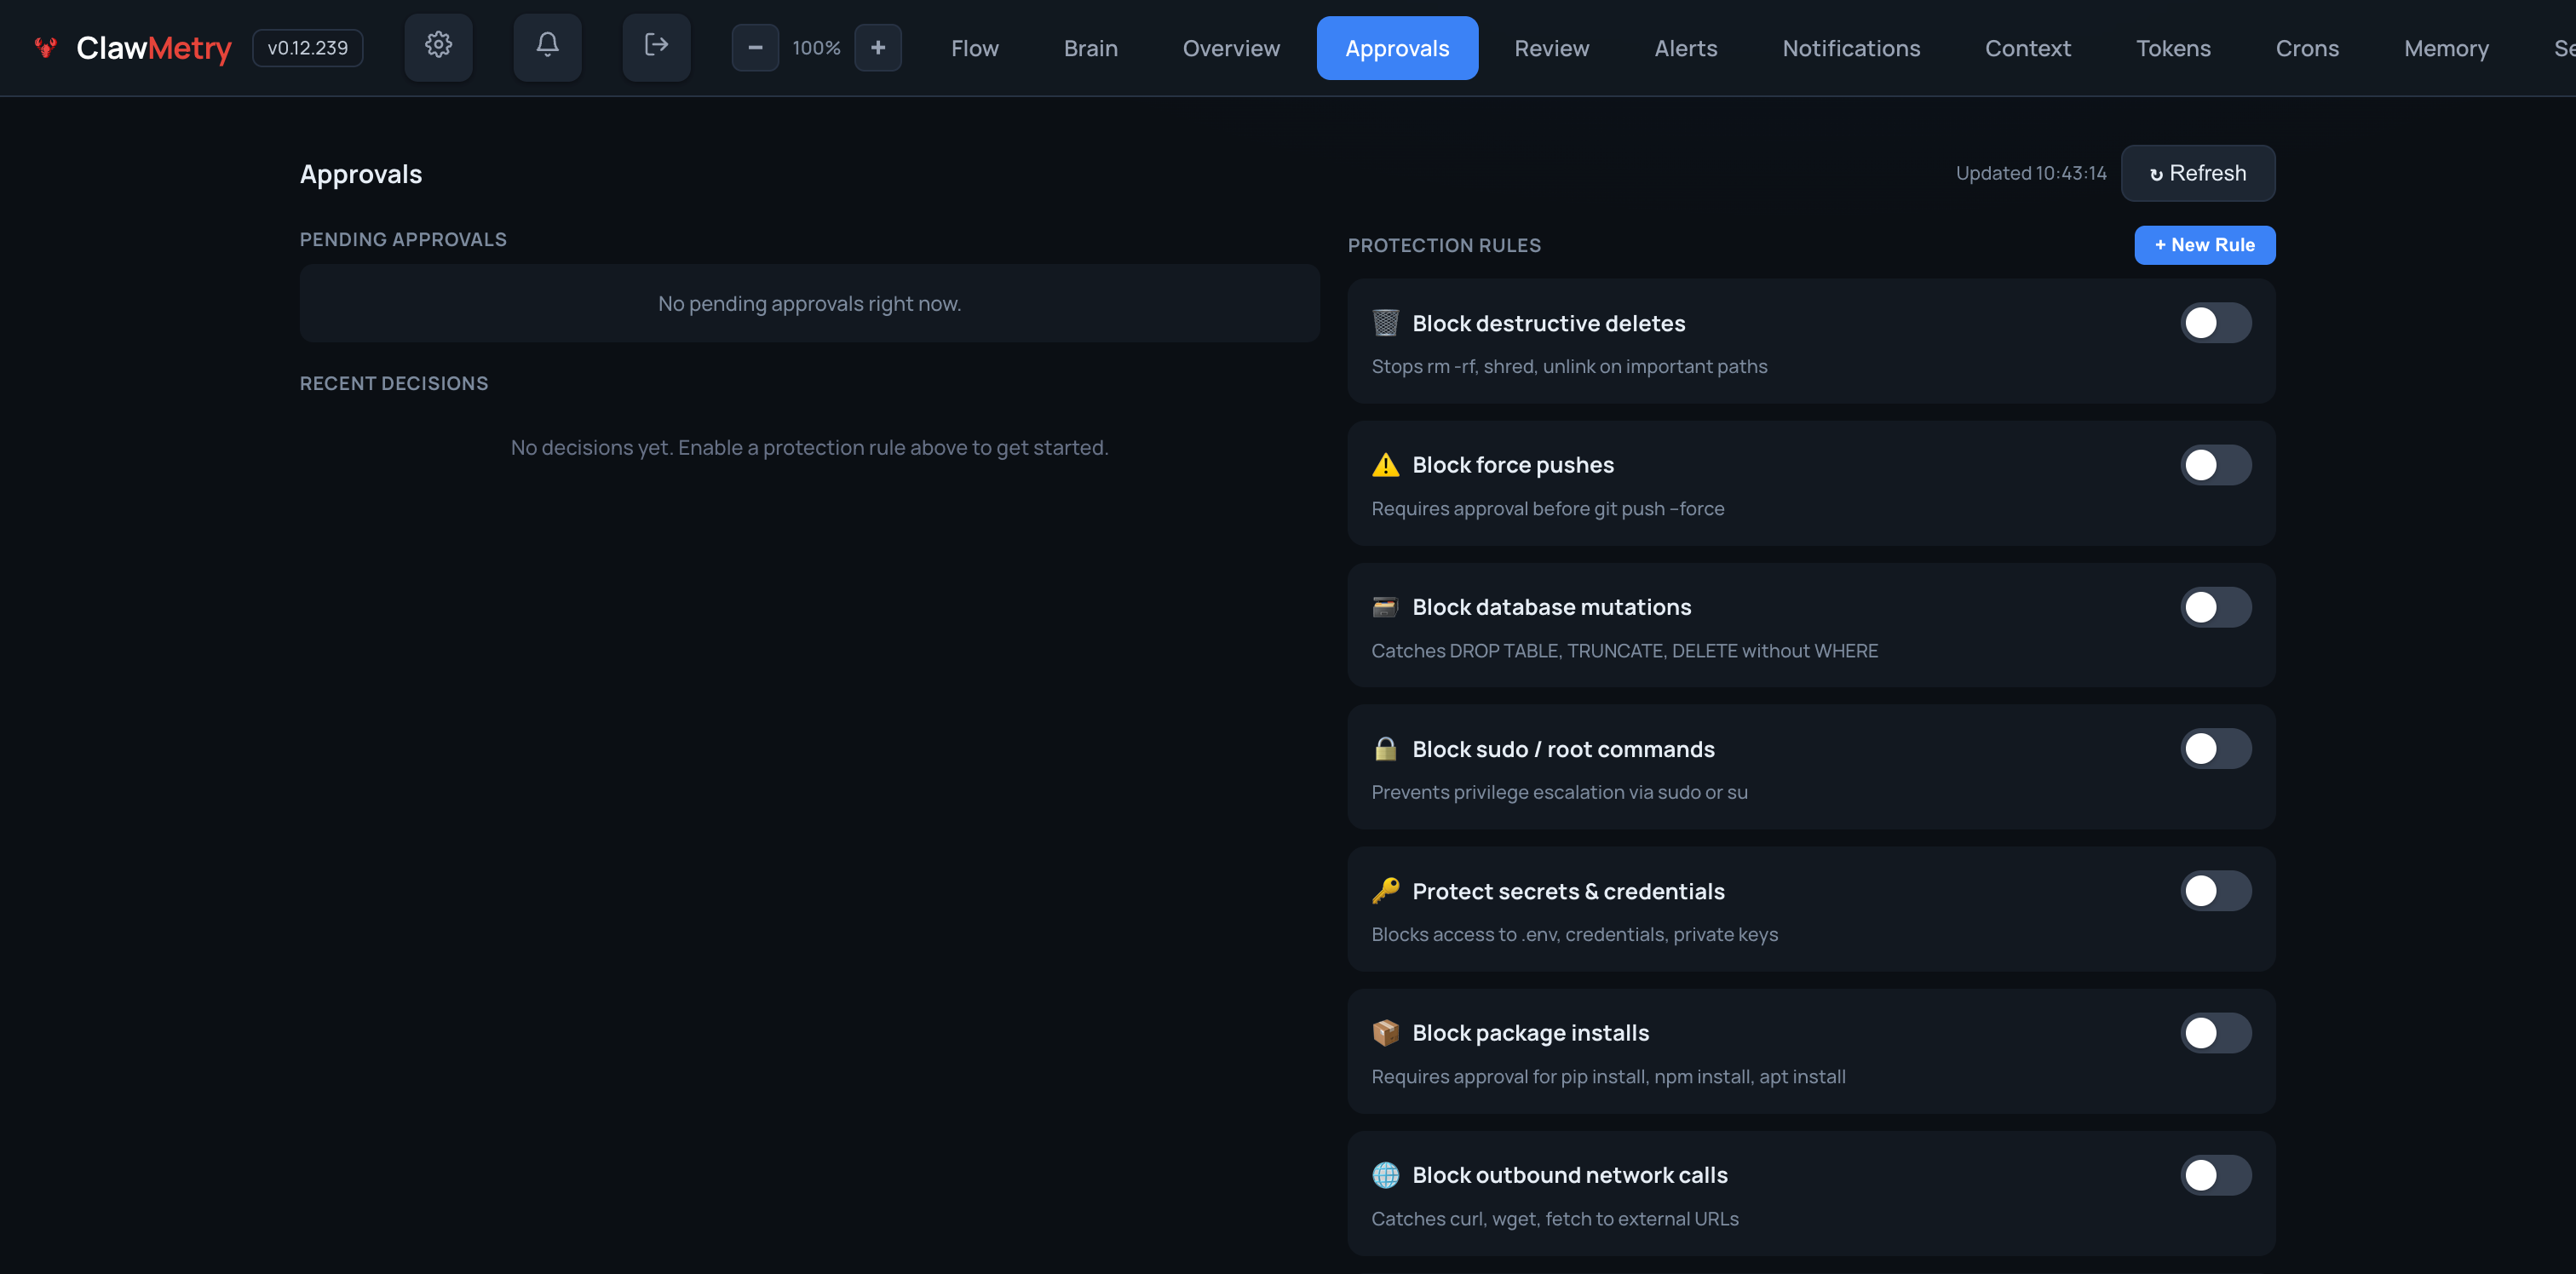
- Approvals — Gate destructive deletes, force pushes, DB mutations, sudo, package installs, network calls behind one-click sign-off
Screenshots
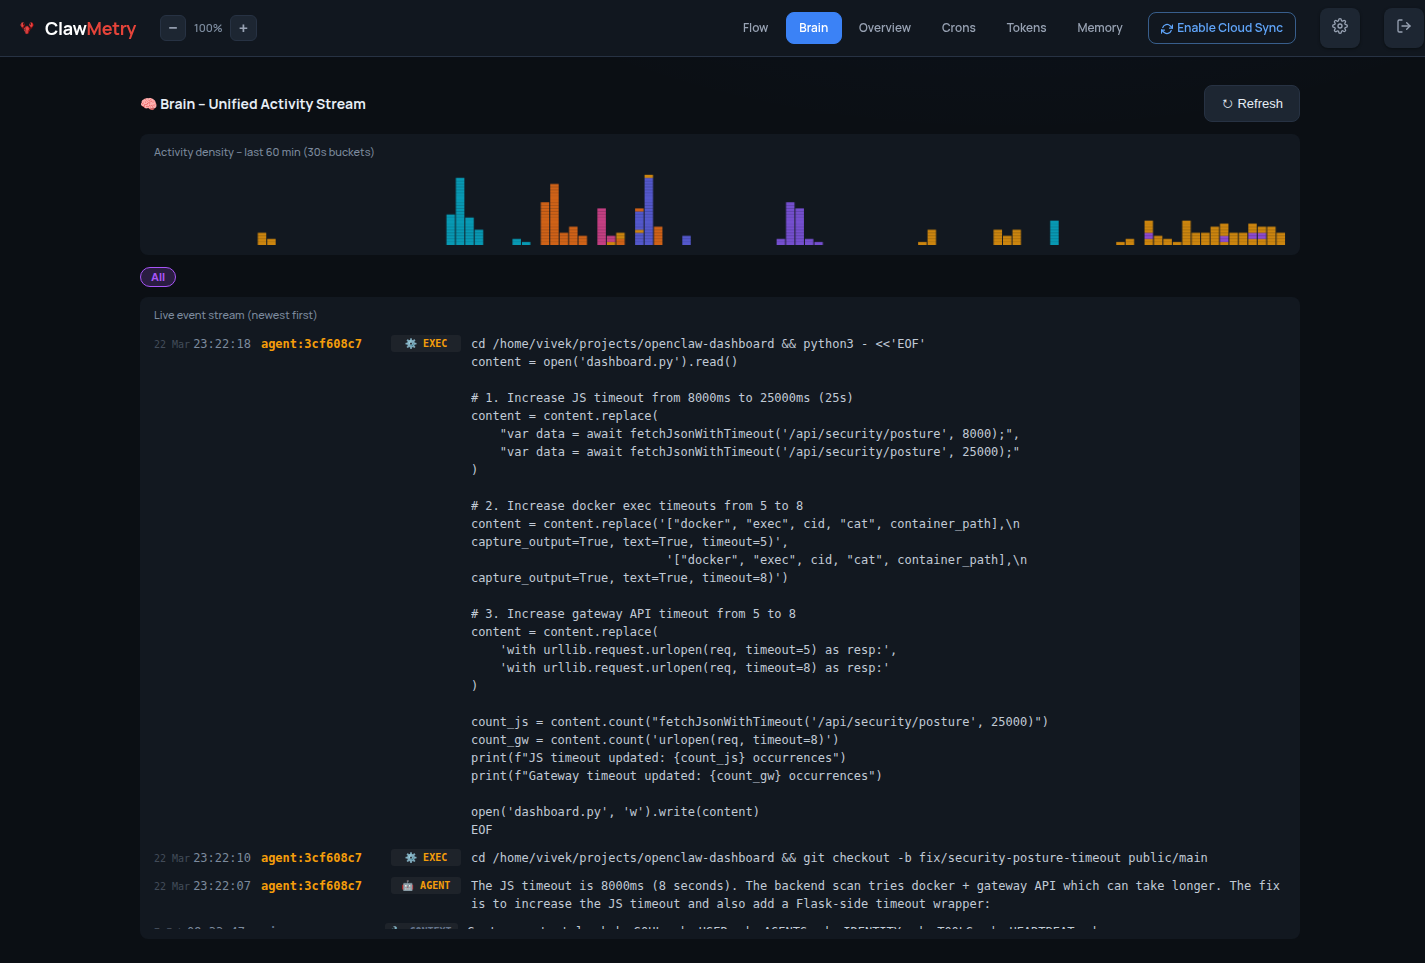
🧠 Brain — Live agent event stream
📊 Overview — Token usage & session summary
⚡ Flow — Real-time tool call feed
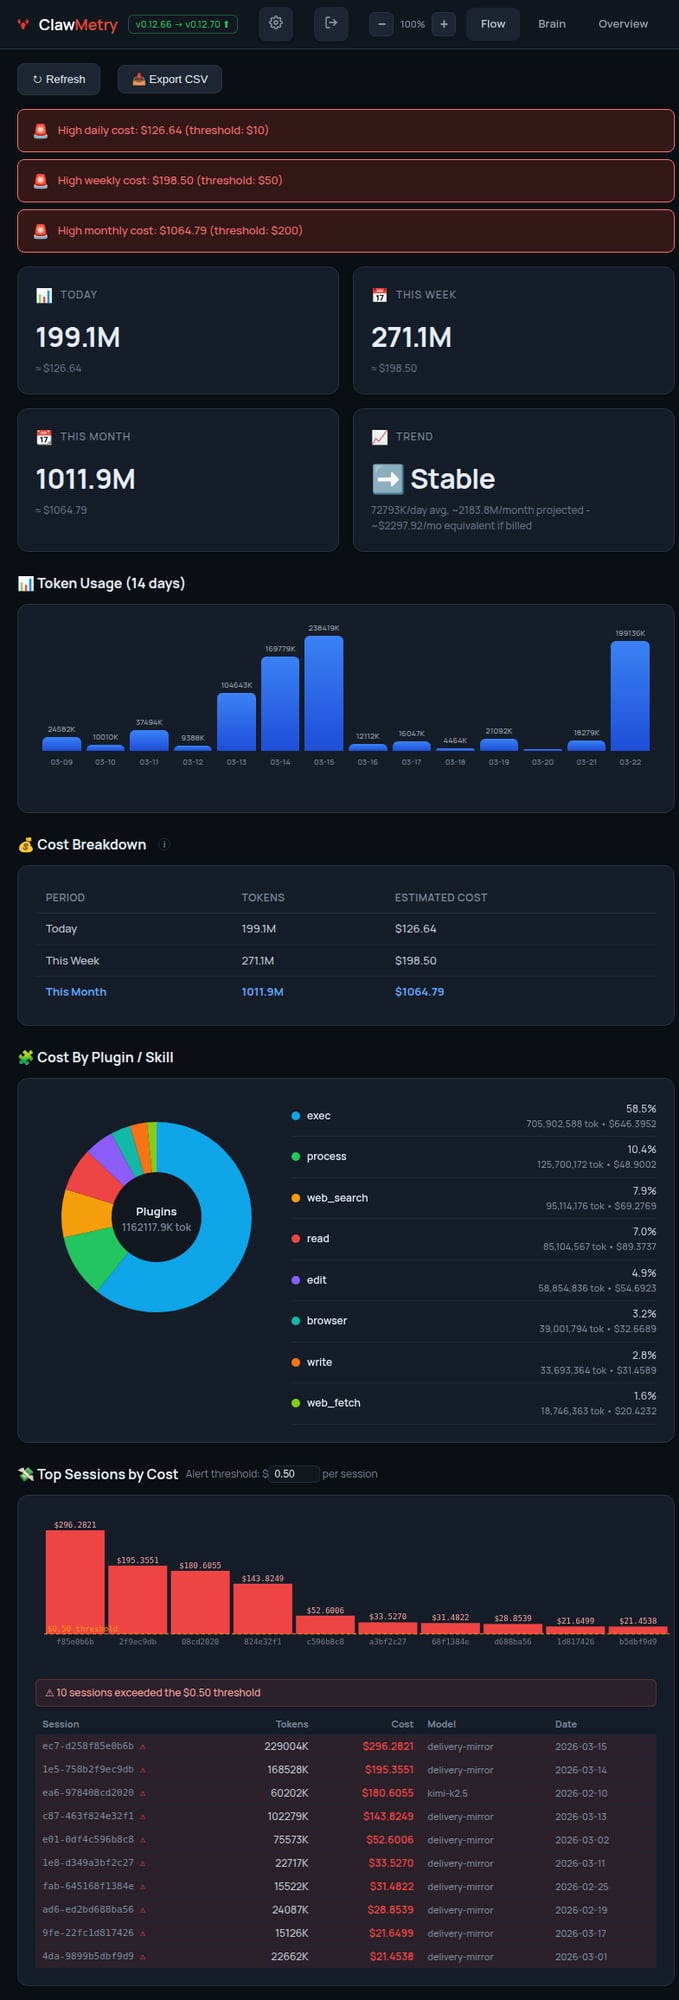
💰 Tokens — Cost breakdown by model & session
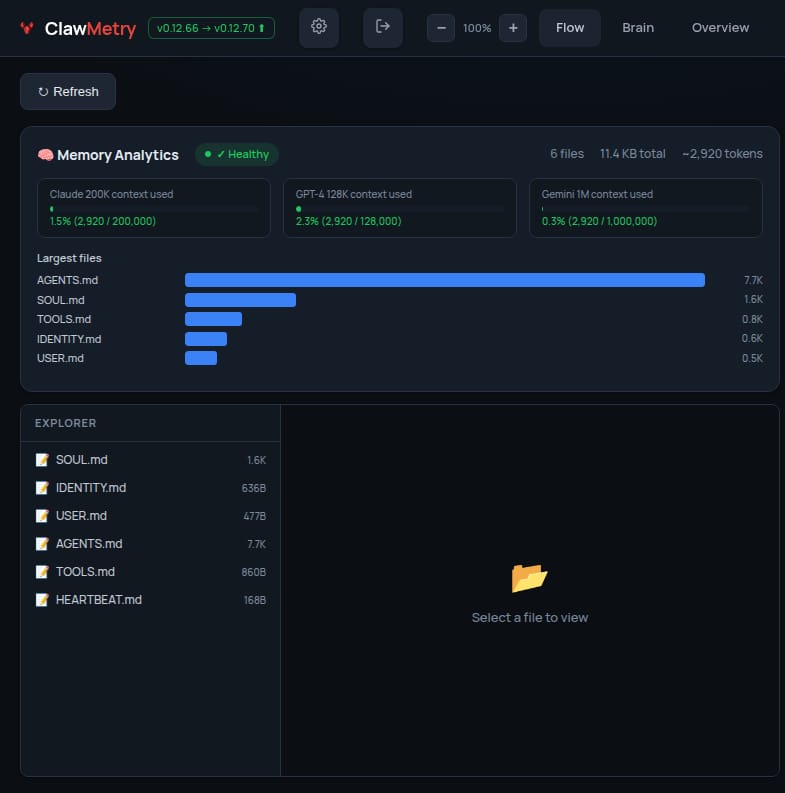
🧬 Memory — Workspace file browser
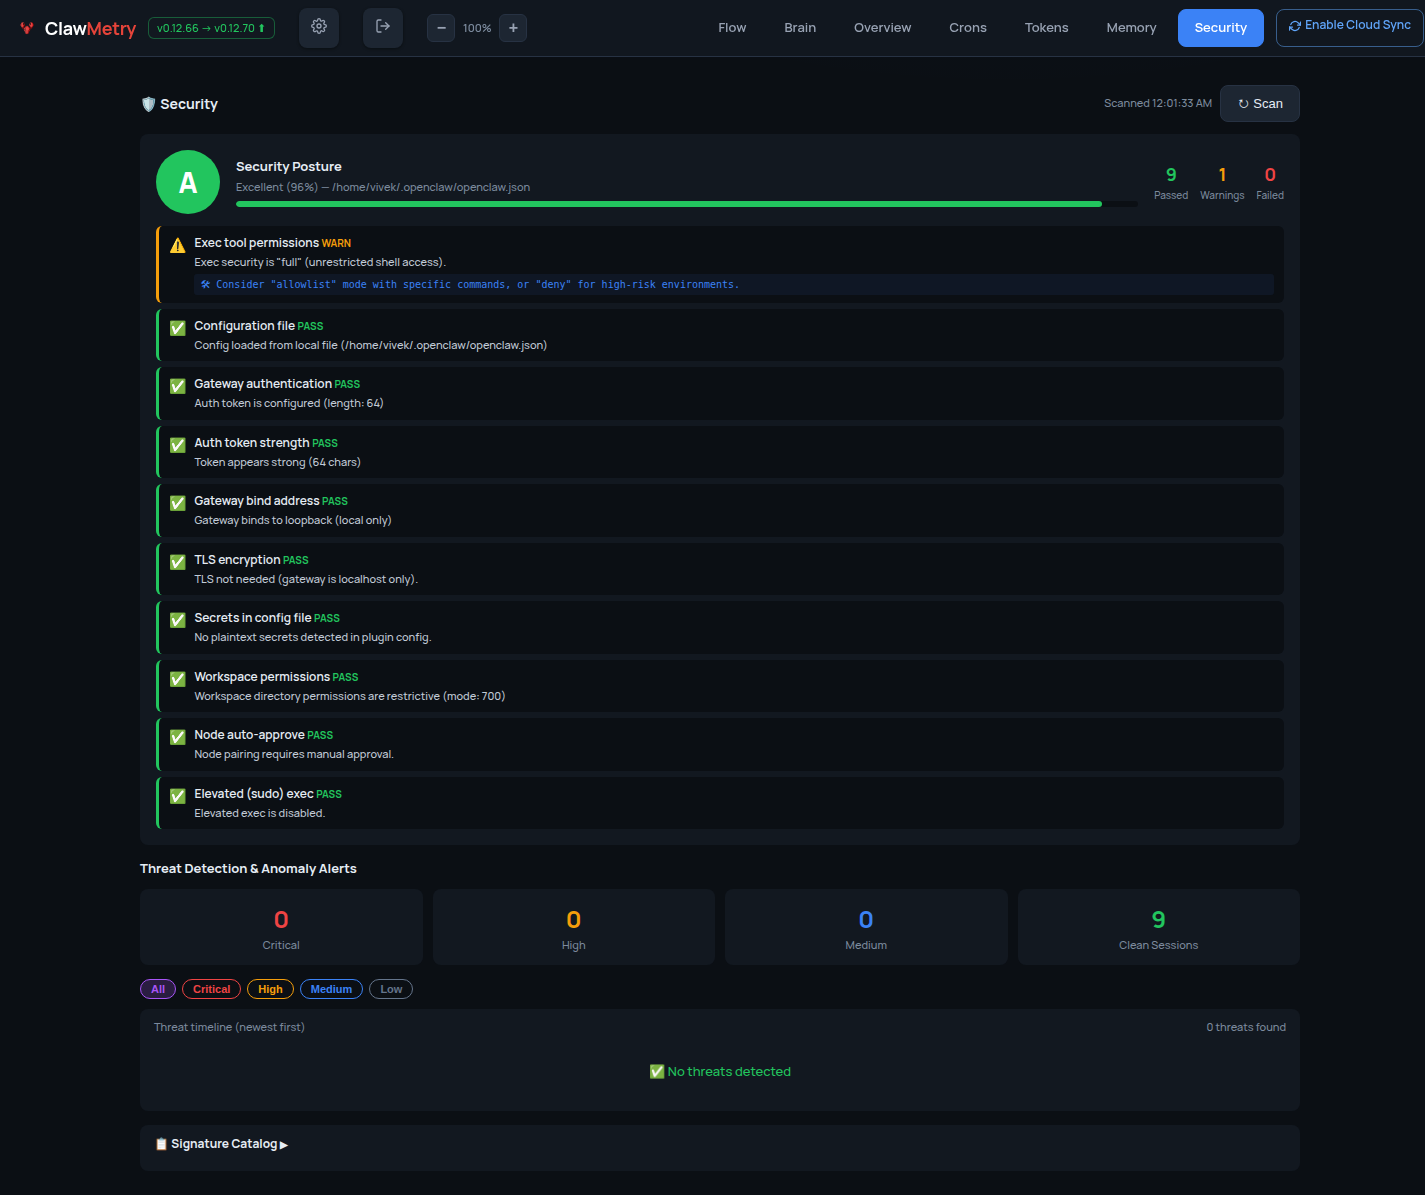
🔐 Security — Posture & audit log
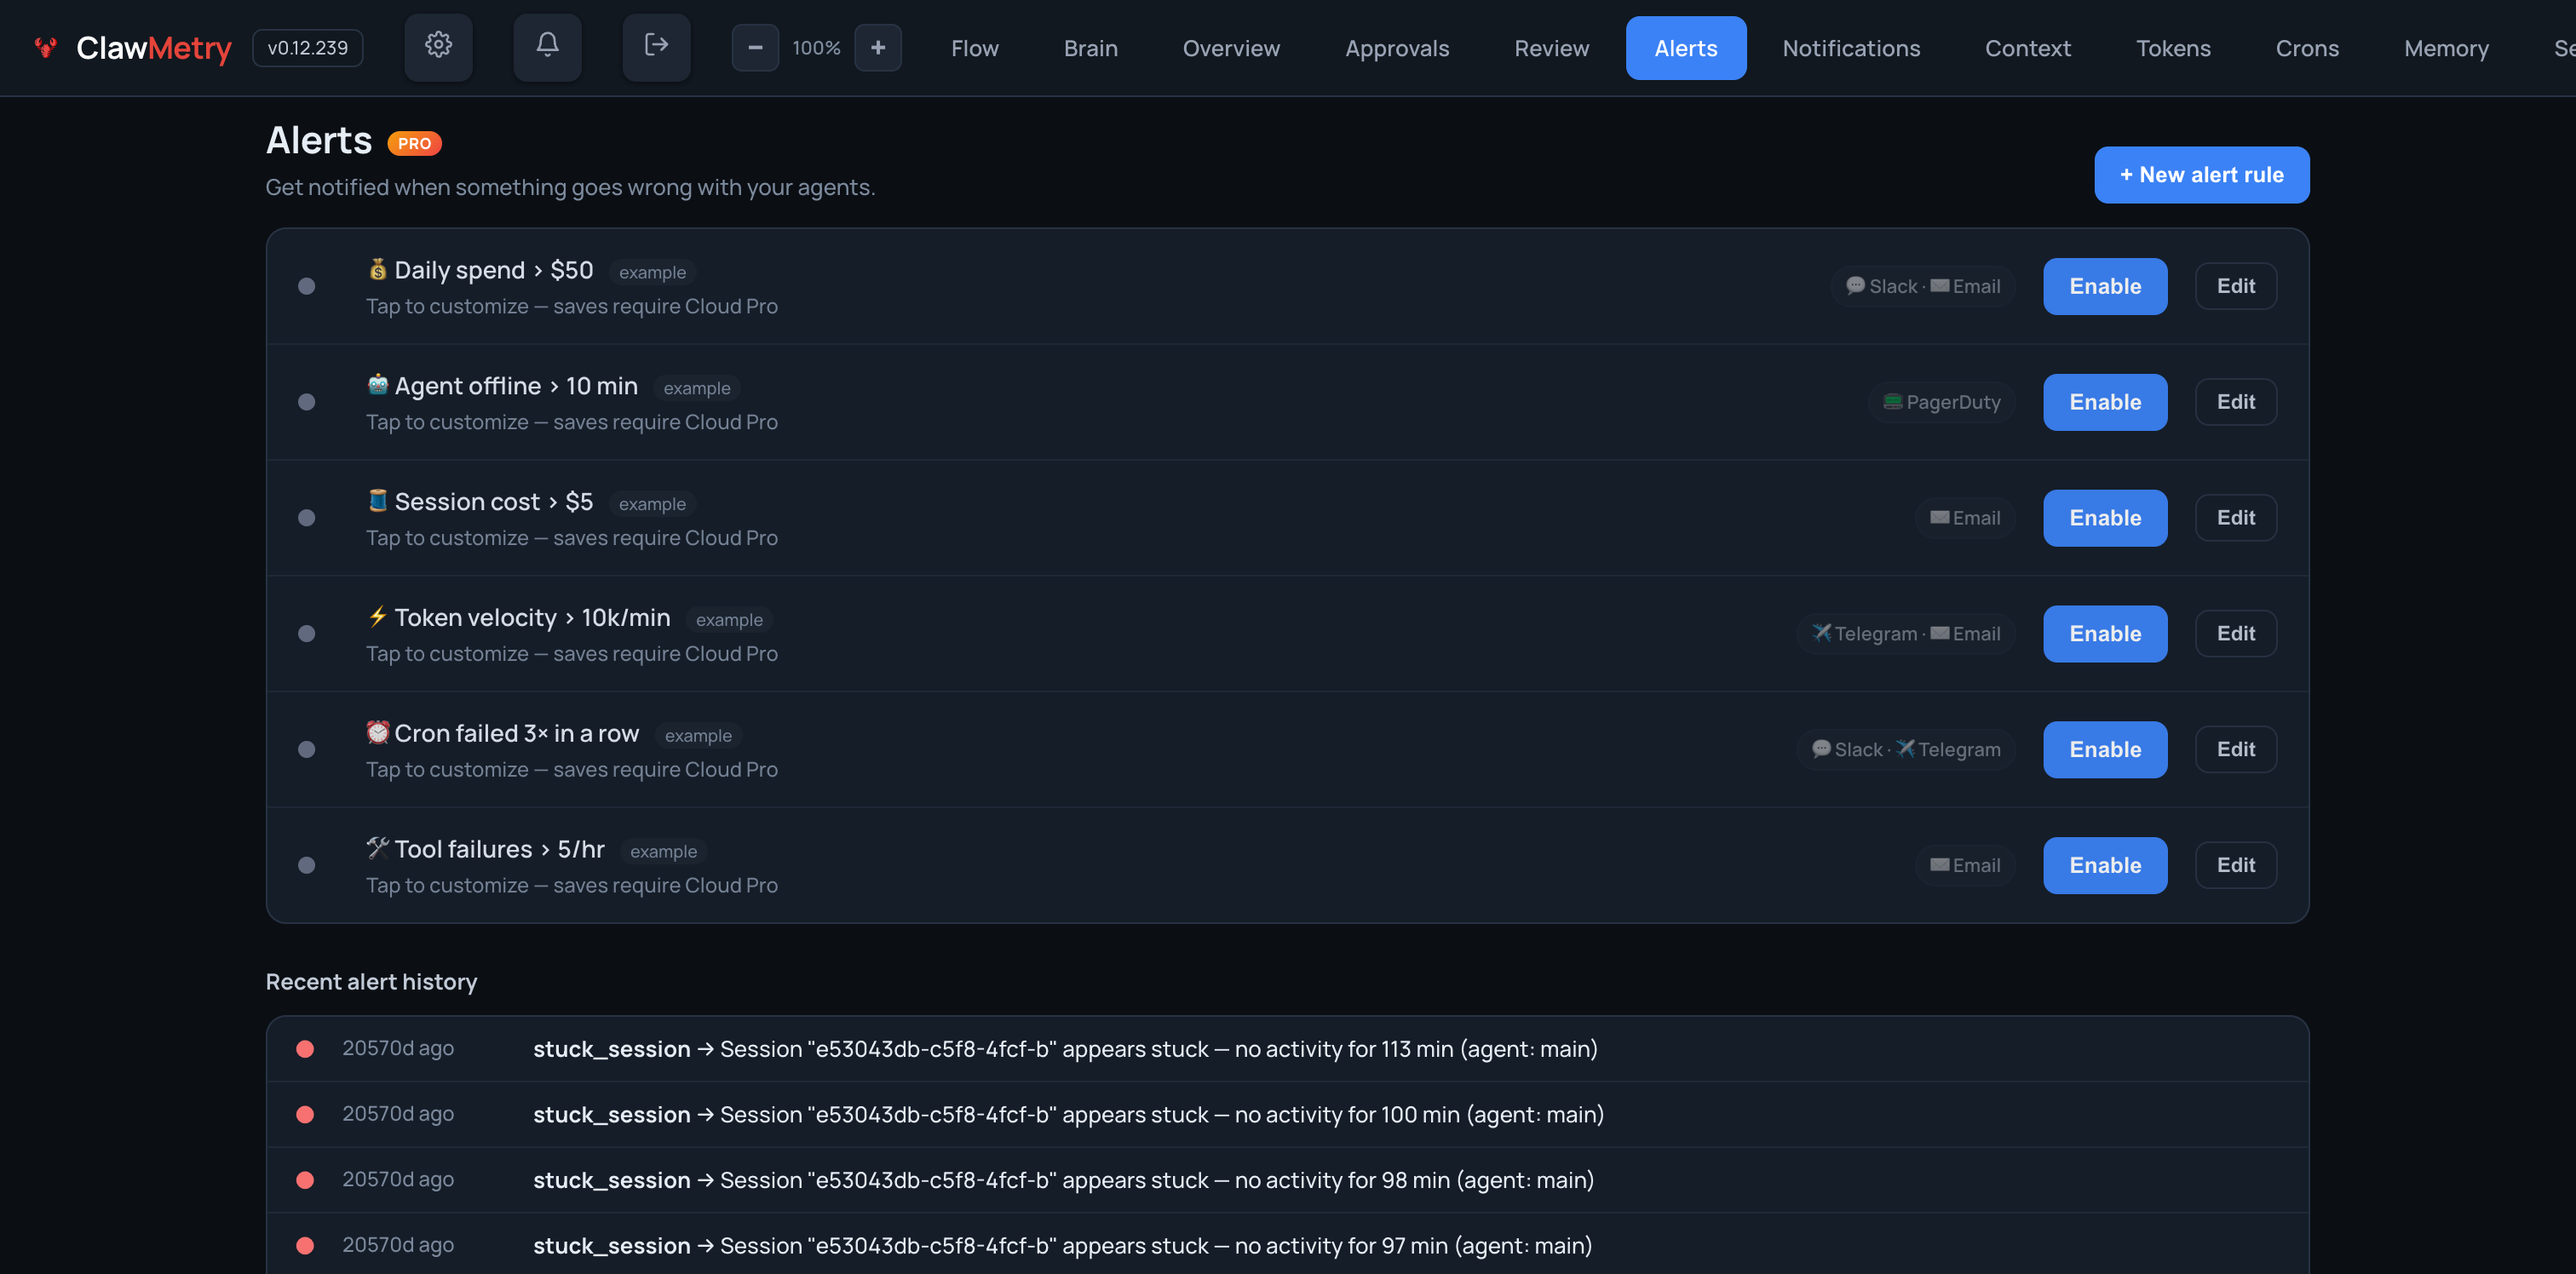
🚨 Alerts — Budget caps, error-rate triggers, webhooks to Slack / Discord / PagerDuty / Email
✋ Approvals — Gate risky tool calls behind manual sign-off; policy-backed protection rules
Install
One-liner (recommended):
curl -sSL https://raw.githubusercontent.com/vivekchand/clawmetry/main/install.sh | bash
pip:
pip install clawmetry
clawmetry
From source:
git clone https://github.com/vivekchand/clawmetry.git
cd clawmetry && pip install flask && python3 dashboard.py
v2 Frontend Development
The v2 React app lives in frontend/ and is served at /v2 when the Flask
server is started with v2 enabled.
Use two terminals while developing:
# Terminal 1: Flask API/server on :8900
CLAWMETRY_V2=1 python3 dashboard.py
# Terminal 2: Vite dev server on :5173
cd frontend
nvm use
npm ci
npm run dev
Open http://localhost:5173/v2/. Vite proxies /api requests to
http://localhost:8900, so the React app can talk to the local Flask server
without extra CORS setup.
To build the bundle that ships with the Python package:
cd frontend
npm run build
The production bundle is written to clawmetry/static/v2/dist/.
Runtime / Agent Compatibility
ClawMetry observes many AI-agent runtimes, not just OpenClaw. Each non-OpenClaw runtime ships a dedicated reader adapter that translates its native session format into ClawMetry's unified shapes; the daemon ingests them into the same DuckDB store + cloud snapshot, tagged with the runtime, and the Session replay tab shows a runtime switcher when more than one is present. See docs/compatibility.md for the full matrix + a guide to adding runtimes, and docs/RUNTIME_FAMILY.md for the OpenClaw-family primer.
| Runtime / Agent | Status | Notes |
|---|---|---|
| OpenClaw | Native | Reference runtime, auto-detected |
| PicoClaw | Beta adapter | Flat providers.Message JSONL (~/.picoclaw/workspace/sessions). Transcripts, model, tool calls. |
| NanoClaw | Beta adapter | Per-session SQLite (data/v2-sessions). Transcripts + message counts. |
| Hermes | Beta adapter | SQLite ~/.hermes/state.db. Transcripts, model, tokens/cost. |
| Claude Code | Beta adapter | JSONL ~/.claude/projects/.../<id>.jsonl. Transcripts, model, tool calls + thinking, token usage. |
| Codex | Beta adapter | Rollout JSONL ~/.codex/sessions/.... Transcripts, model, tool calls, token usage. |
| Cursor | Beta adapter | SQLite state.vscdb. Chat/composer transcripts, model. |
| Aider | Beta adapter | .aider.chat.history.md per project. Transcripts, model, token counts. |
| Goose | Beta adapter | SQLite ~/.local/share/goose. Transcripts, model, tool calls, token totals. |
| opencode | Beta adapter | SQLite ~/.local/share/opencode. Transcripts, model, tool calls, tokens + cost. |
| Qwen Code | Beta adapter | JSONL ~/.qwen/projects/.../chats. Transcripts, model, tool calls, token usage. |
"Beta adapter" means ClawMetry ships a reader for that runtime's real on-disk format, each built + verified against a real install on a real machine (see tests/fixtures/runtimes/<rt>/). Adapters are read-only; each is honest about what its runtime actually stores (e.g. PicoClaw/NanoClaw/Cursor don't write token cost to disk). When several runtimes run on one node, the runtime switcher scopes the sessions view to one for a clean deep-dive.
OpenTelemetry — vendor-neutral, send your traces anywhere
ClawMetry speaks OpenTelemetry in both directions, using the GenAI semantic conventions, so your agent traces are never locked into one tool.
Export every session — LLM calls, tools, sub-agents, tokens, cost — as OTLP/HTTP GenAI spans to any collector (Datadog, Grafana, Honeycomb, or your own OTel Collector):
clawmetry --otel-export http://localhost:4318/v1/traces
# equivalently:
CLAWMETRY_OTEL_EXPORT_ENDPOINT=http://localhost:4318/v1/traces clawmetry
Auth headers and poll interval are optional env vars:
CLAWMETRY_OTEL_EXPORT_HEADERS='{"X-API-Key":"…"}'   # extra HTTP headers
CLAWMETRY_OTEL_EXPORT_INTERVAL=60                    # seconds (default 60)
Ingest — the built-in OTLP receiver accepts traces and metrics from anything else at /v1/traces and /v1/metrics (pip install clawmetry[otel] for protobuf ingest).
You get the zero-config, local-first ClawMetry dashboard and your data in whatever backend your team already runs — no lock-in, no second agent to install.
Configuration
Most people don't need any config. ClawMetry auto-detects your workspace, logs, sessions, and crons.
If you do need to customize:
clawmetry --port 9000              # Custom port (default: 8900)
clawmetry --host 127.0.0.1         # Bind to localhost only
clawmetry --workspace ~/mybot      # Custom workspace path
clawmetry --name "Alice"           # Your name in Flow visualization
All options: clawmetry --help
Supported Channels
ClawMetry shows live activity for every OpenClaw channel you have configured. Only channels that are actually set up in your openclaw.json appear in the Flow diagram — unconfigured ones are automatically hidden.
Click any channel node in the Flow to see a live chat bubble view with incoming/outgoing message counts.
| Channel | Status | Live Popup | Notes |
|---|---|---|---|
| 📱 Telegram | ✅ Full | ✅ | Messages, stats, 10s refresh |
| 💬 iMessage | ✅ Full | ✅ | Reads ~/Library/Messages/chat.db directly |
| ✅ Full | ✅ | Via WhatsApp Web (Baileys) | |
| 🔵 Signal | ✅ Full | ✅ | Via signal-cli |
| 🟣 Discord | ✅ Full | ✅ | Guild + channel detection |
| 🟪 Slack | ✅ Full | ✅ | Workspace + channel detection |
| 🌐 Webchat | ✅ Full | ✅ | Built-in web UI sessions |
| 📡 IRC | ✅ Full | ✅ | Terminal-style bubble UI |
| 🍏 BlueBubbles | ✅ Full | ✅ | iMessage via BlueBubbles REST API |
| 🔵 Google Chat | ✅ Full | ✅ | Via Chat API webhooks |
| 🟣 MS Teams | ✅ Full | ✅ | Via Teams bot plugin |
| 🔷 Mattermost | ✅ Full | ✅ | Self-hosted team chat |
| 🟩 Matrix | ✅ Full | ✅ | Decentralized, E2EE support |
| 🟢 LINE | ✅ Full | ✅ | LINE Messaging API |
| ⚡ Nostr | ✅ Full | ✅ | Decentralized NIP-04 DMs |
| 🟣 Twitch | ✅ Full | ✅ | Chat via IRC connection |
| 🔷 Feishu/Lark | ✅ Full | ✅ | WebSocket event subscription |
| 🔵 Zalo | ✅ Full | ✅ | Zalo Bot API |
Auto-detection: ClawMetry reads your
~/.openclaw/openclaw.jsonand only renders the channels you've actually configured. No manual setup required.
Docker Deployment
Want to run ClawMetry in a container? No problem! 🐳
Quick start with Docker:
# Build the image
docker build -t clawmetry .

# Run with default settings
docker run -p 8900:8900 clawmetry

# Or with your OpenClaw workspace mounted
docker run -p 8900:8900 \
  -v ~/.openclaw:/root/.openclaw \
  -v /tmp/moltbot:/tmp/moltbot \
  clawmetry
Docker Compose example:
version: '3.8'
services:
  clawmetry:
    build: .
    ports:
      - "8900:8900"
    volumes:
      - ~/.openclaw:/root/.openclaw:ro
      - /tmp/moltbot:/tmp/moltbot:ro
    restart: unless-stopped
Note: When running in Docker, make sure to mount your OpenClaw workspace and log directories so ClawMetry can auto-detect your setup.
Requirements
- Python 3.8+
- Flask (installed automatically via pip)
- OpenClaw running on the same machine (or mounted volumes for Docker)
- Linux or macOS
NemoClaw / OpenShell Support
ClawMetry automatically detects NemoClaw — NVIDIA's enterprise security wrapper for OpenClaw that runs agents inside sandboxed OpenShell containers.
No extra configuration is needed in most cases. The sync daemon auto-discovers session files whether they live in ~/.openclaw/ on the host or inside an OpenShell container.
How it works
ClawMetry detects NemoClaw in two ways:
- Binary detection — checks for the
nemoclawCLI and runsnemoclaw statusto get sandbox info - Container detection — scans running Docker containers for
openshell,nemoclaw, orghcr.io/nvidia/images, then reads sessions via volume mounts ordocker cp
Session files synced from NemoClaw containers are tagged with runtime=nemoclaw and container_id metadata in the cloud dashboard, so you can tell them apart from standard OpenClaw sessions at a glance.
Recommended setup: sync daemon on the HOST
For the best experience, run ClawMetry's sync daemon on the host machine (not inside the sandbox). This avoids NemoClaw network policy restrictions.
# On the host (outside the sandbox)
pip install clawmetry
clawmetry connect
clawmetry sync
The sync daemon will automatically find sessions inside any running OpenShell containers.
Optional: explicit sandbox name
If auto-detection doesn't work, point ClawMetry at the right sandbox:
export NEMOCLAW_SANDBOX=my-sandbox-name
clawmetry sync
Running inside the sandbox (advanced)
If you must run the sync daemon inside the OpenShell sandbox, add this egress rule to your NemoClaw network policy so it can reach the ClawMetry ingest API:
# nemoclaw-policy.yaml
network:
  egress:
    - host: ingest.clawmetry.com
      port: 443
      protocol: https
Apply with:
nemoclaw policy apply --file nemoclaw-policy.yaml
Ports and endpoints
| Endpoint | Port | Protocol | Required |
|---|---|---|---|
ingest.clawmetry.com |
443 | HTTPS | Yes (sync daemon → cloud) |
localhost:8900 |
8900 | HTTP | Yes (local dashboard UI) |
Docker socket (/var/run/docker.sock) |
— | Unix socket | For container session discovery |
The sync daemon only makes outbound HTTPS calls to ingest.clawmetry.com. No inbound ports are required.
Cloud Deployment
See the Cloud Testing Guide for SSH tunnels, reverse proxy, and Docker.
Testing
This project is tested with BrowserStack.

Telemetry
ClawMetry sends a single anonymous "first run" ping to
https://app.clawmetry.com/api/install the first time you run the
clawmetry CLI on a new machine. We use this to count installs (the
only marketing metric we have for an OSS project) and to learn which
agent frameworks our users have installed.
Exactly one POST per install, containing:
| Field | Example | Why |
|---|---|---|
install_id |
random UUID stored at ~/.clawmetry/install_id |
dedup; not linked to your email or api_key |
version |
0.12.167 |
what versions are in the wild |
os / os_version |
Darwin / 25.3.0 |
platform support priorities |
python |
3.11.15 |
Python version support matrix |
agent |
openclaw / nemoclaw / hermes / none |
which agents we should integrate with next |
is_ci / ci_provider |
true / github_actions |
separate human installs from CI noise |
What we do NOT send: IP (cloud derives the country code server-side
from the request, then discards the IP), hostname, username, workspace
path, file contents, your api_key, your email, anything PII or
workspace-specific. The wire payload is auditable in
clawmetry/telemetry.py.
Opt out (any one of these disables it permanently):
export CLAWMETRY_NO_TELEMETRY=1                # per-shell
export DO_NOT_TRACK=1                          # W3C cross-tool standard
touch ~/.clawmetry/notelemetry                 # persistent file marker
A network failure here never blocks clawmetry from running — the
ping is fire-and-forget on a daemon thread with a 3 s timeout.
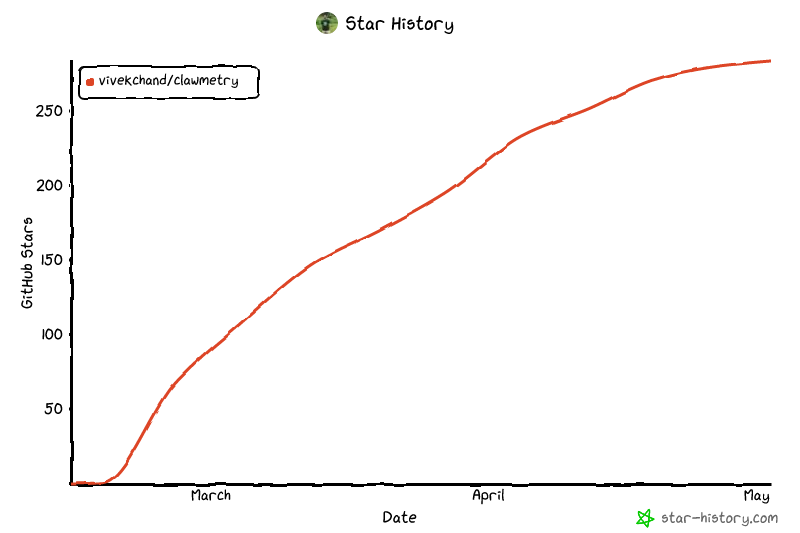
Star History
License
MIT
🦞 See your agent think
Built by @vivekchand · clawmetry.com · Part of the OpenClaw ecosystem
Release history Release notifications | RSS feed


Download files
Download the file for your platform. If you're not sure which to choose, learn more about installing packages.
Source Distribution
Built Distribution
Filter files by name, interpreter, ABI, and platform.
If you're not sure about the file name format, learn more about wheel file names.
Copy a direct link to the current filters
File details
Details for the file clawmetry-0.12.324.tar.gz.
File metadata
- Download URL: clawmetry-0.12.324.tar.gz
- Upload date:
- Size: 2.2 MB
- Tags: Source
- Uploaded using Trusted Publishing? No
- Uploaded via: twine/6.2.0 CPython/3.11.15
File hashes
| Algorithm | Hash digest | |
|---|---|---|
| SHA256 |
d46d39f71ecc01a73ccac68d45e7d2e51c593876c7a8395a45e5f462ccd25931
|
|
| MD5 |
9dd42ec603820f784fa672b25866cd3a
|
|
| BLAKE2b-256 |
769e61cfdb35619fdd4d07029118014d64ba2de89478f075a4a421cd77173f7d
|
File details
Details for the file clawmetry-0.12.324-py3-none-any.whl.
File metadata
- Download URL: clawmetry-0.12.324-py3-none-any.whl
- Upload date:
- Size: 2.4 MB
- Tags: Python 3
- Uploaded using Trusted Publishing? No
- Uploaded via: twine/6.2.0 CPython/3.11.15
File hashes
| Algorithm | Hash digest | |
|---|---|---|
| SHA256 |
8e1d0de5d2fd63b9dfc2d6a79925f4d40c289008f023ca582e9b3adcebfd3297
|
|
| MD5 |
fc596fe611a490b7c948680339839c06
|
|
| BLAKE2b-256 |
6ddeb350b9a4b851cab2d35b19e3bdc07e5bb455355f6b9a2bd59e62c623440c
|






