A Python library to generate beautiful, clean charts in premium visual styles

Project description
Clean Charts Library
A Python library to generate line charts in clean, premium visual styles, including right-aligned axes, custom year boundaries, distinct line colors, and dynamic scaling for mini canvas resolutions.
The library automatically identifies date/time columns and any number of value series to plot them dynamically, with overlap-avoiding label placement, and allows custom color interpolation, date label frequencies, titles, and subtitles.
Installation
pip install .
Quick Start
You can run the script without any parameters to recreate the chart from the reference image:
from clean_charts import plot_time_series

# Generates the default landscape image (1000x500)
plot_time_series(
    output_path="chart_landscape.png",
    aspect_ratio="landscape",
    title="Europe",
    subtitle="Sales of Chinese-made cars, % of total"
)

# Generates a 500x500 square visualization
plot_time_series(
    output_path="chart_500.png",
    width=500,
    height=500,
    title="Europe",
    subtitle="Sales of Chinese-made cars, % of total"
)

# Generates a chart with a custom color gradient (from Indigo to Coral)
plot_time_series(
    output_path="chart_gradient.png",
    start_color="#4b0082",
    end_color="#ff7f50",
    title="EV Market Split",
    subtitle="Gradient Theme Demonstration"
)
Custom Data Input and X-Axis Frequencies
You can supply your own pandas DataFrame with any date/time column and value columns. The library dynamically identifies them and configures the X-axis label frequency:
import pandas as pd
from clean_charts import plot_time_series

# Day-frequency dataset example
daily_data = pd.DataFrame({
    "Day": pd.date_range("2026-05-01", periods=10, freq="D"),
    "Users": [120, 150, 190, 240, 220, 250, 270, 310, 340, 320],
    "Signups": [15, 22, 35, 40, 28, 30, 32, 45, 52, 48]
})

plot_time_series(
    data=daily_data,
    output_path="daily_chart.png",
    title="Server Statistics",
    subtitle="10-Day Signups growth",
    label_frequency="day", # Supported: "year", "quarter", "month", "week", "day", "hour", "minute", "second"
    start_color="#006400",
    end_color="#ffd700"
)
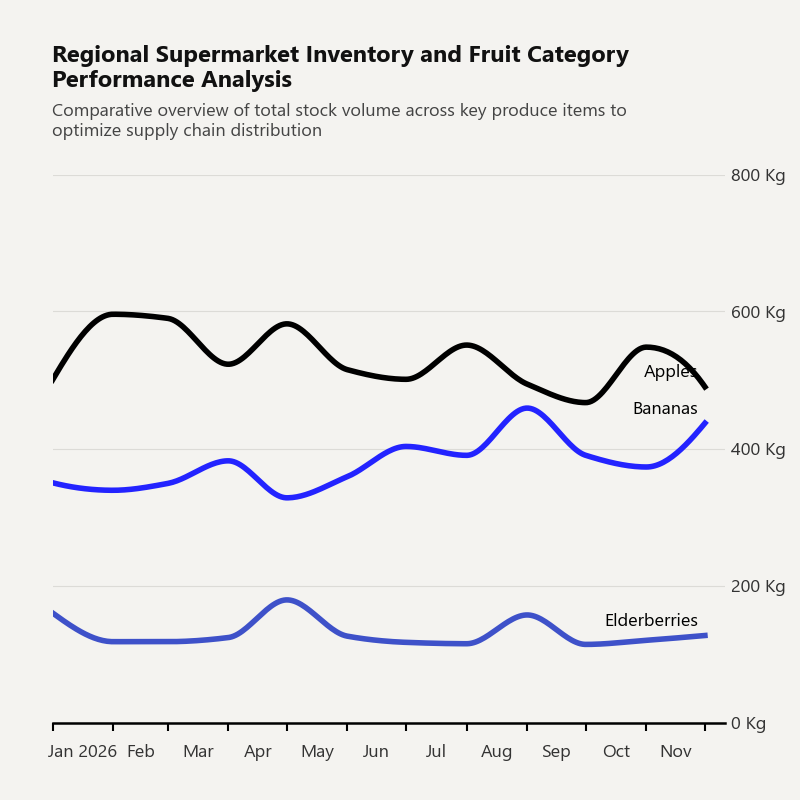
Example of Line Chart:
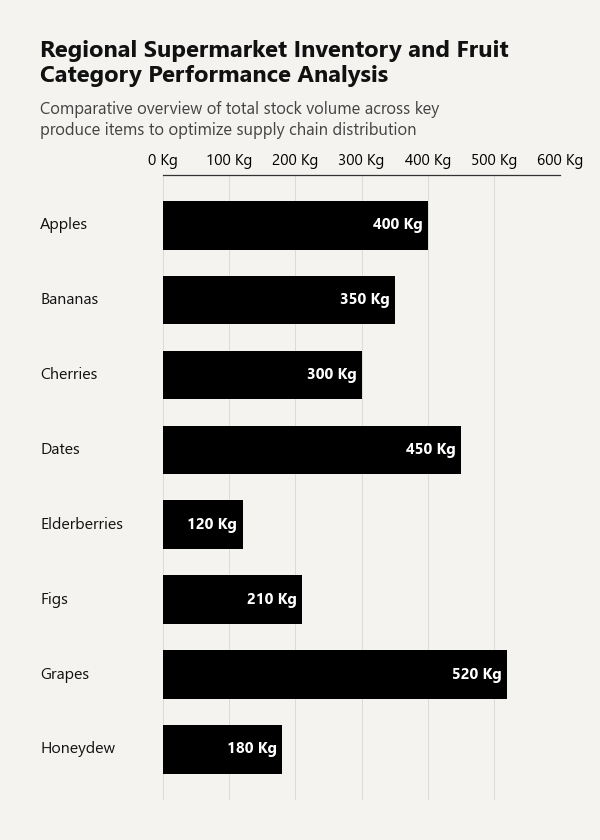
Horizontal Bar Chart
You can supply your own pandas DataFrame with category and value columns.
import pandas as pd
from clean_charts import plot_barh_chart

df = pd.DataFrame({
    'Category': ['Apples', 'Bananas', 'Cherries', 'Dates', 'Elderberries', 'Figs', 'Grapes', 'Honeydew'],
    'Sales': [400, 350, 300, 450, 120, 210, 520, 180]
})

plot_barh_chart(
    data = df,
    output_path="chart.png",
    title="Regional Supermarket Inventory and Fruit Category Performance Analysis",
    subtitle="Comparative overview of total stock volume across key produce items to optimize supply chain distribution",
    value_suffix = ' Kg',
    color = '#000000'
)
Example of Barh Chart:
Release history Release notifications | RSS feed


Download files
Download the file for your platform. If you're not sure which to choose, learn more about installing packages.
Source Distribution
Built Distribution
Filter files by name, interpreter, ABI, and platform.
If you're not sure about the file name format, learn more about wheel file names.
Copy a direct link to the current filters
File details
Details for the file clean_charts-0.2.2.tar.gz.
File metadata
- Download URL: clean_charts-0.2.2.tar.gz
- Upload date:
- Size: 16.3 kB
- Tags: Source
- Uploaded using Trusted Publishing? No
- Uploaded via: twine/6.2.0 CPython/3.11.9
File hashes
| Algorithm | Hash digest | |
|---|---|---|
| SHA256 |
21817e2b9a91a8c108e66404e8843ab5de40a78c52c59e3cec11f3956d0146c0
|
|
| MD5 |
592114a5caf0b7247e3f7f8fca771dff
|
|
| BLAKE2b-256 |
7efde2fe3af575c70c3da356c859cb6a1d6df281b4969cb773053cb4349637b1
|
File details
Details for the file clean_charts-0.2.2-py3-none-any.whl.
File metadata
- Download URL: clean_charts-0.2.2-py3-none-any.whl
- Upload date:
- Size: 15.8 kB
- Tags: Python 3
- Uploaded using Trusted Publishing? No
- Uploaded via: twine/6.2.0 CPython/3.11.9
File hashes
| Algorithm | Hash digest | |
|---|---|---|
| SHA256 |
6383e8e8c366a469b0120292e7c9eb01e47770245489f0805d291d71e7d1329d
|
|
| MD5 |
c800ef9200496fe2a7eeea609fb97147
|
|
| BLAKE2b-256 |
23a97e20a00db68e5284454a8e4db16922149cf32cbb6cb5a935e6321faf34fc
|


