
cnsplots






Publication-Ready Scientific Plots for Cell, Nature, and Science Journals
Create visually stunning, journal-quality figures with minimal code. Built on matplotlib, fully compatible with seaborn, and optimized for Adobe Illustrator.
Documentation · Examples Gallery · Report Bug · Request Feature
Overview
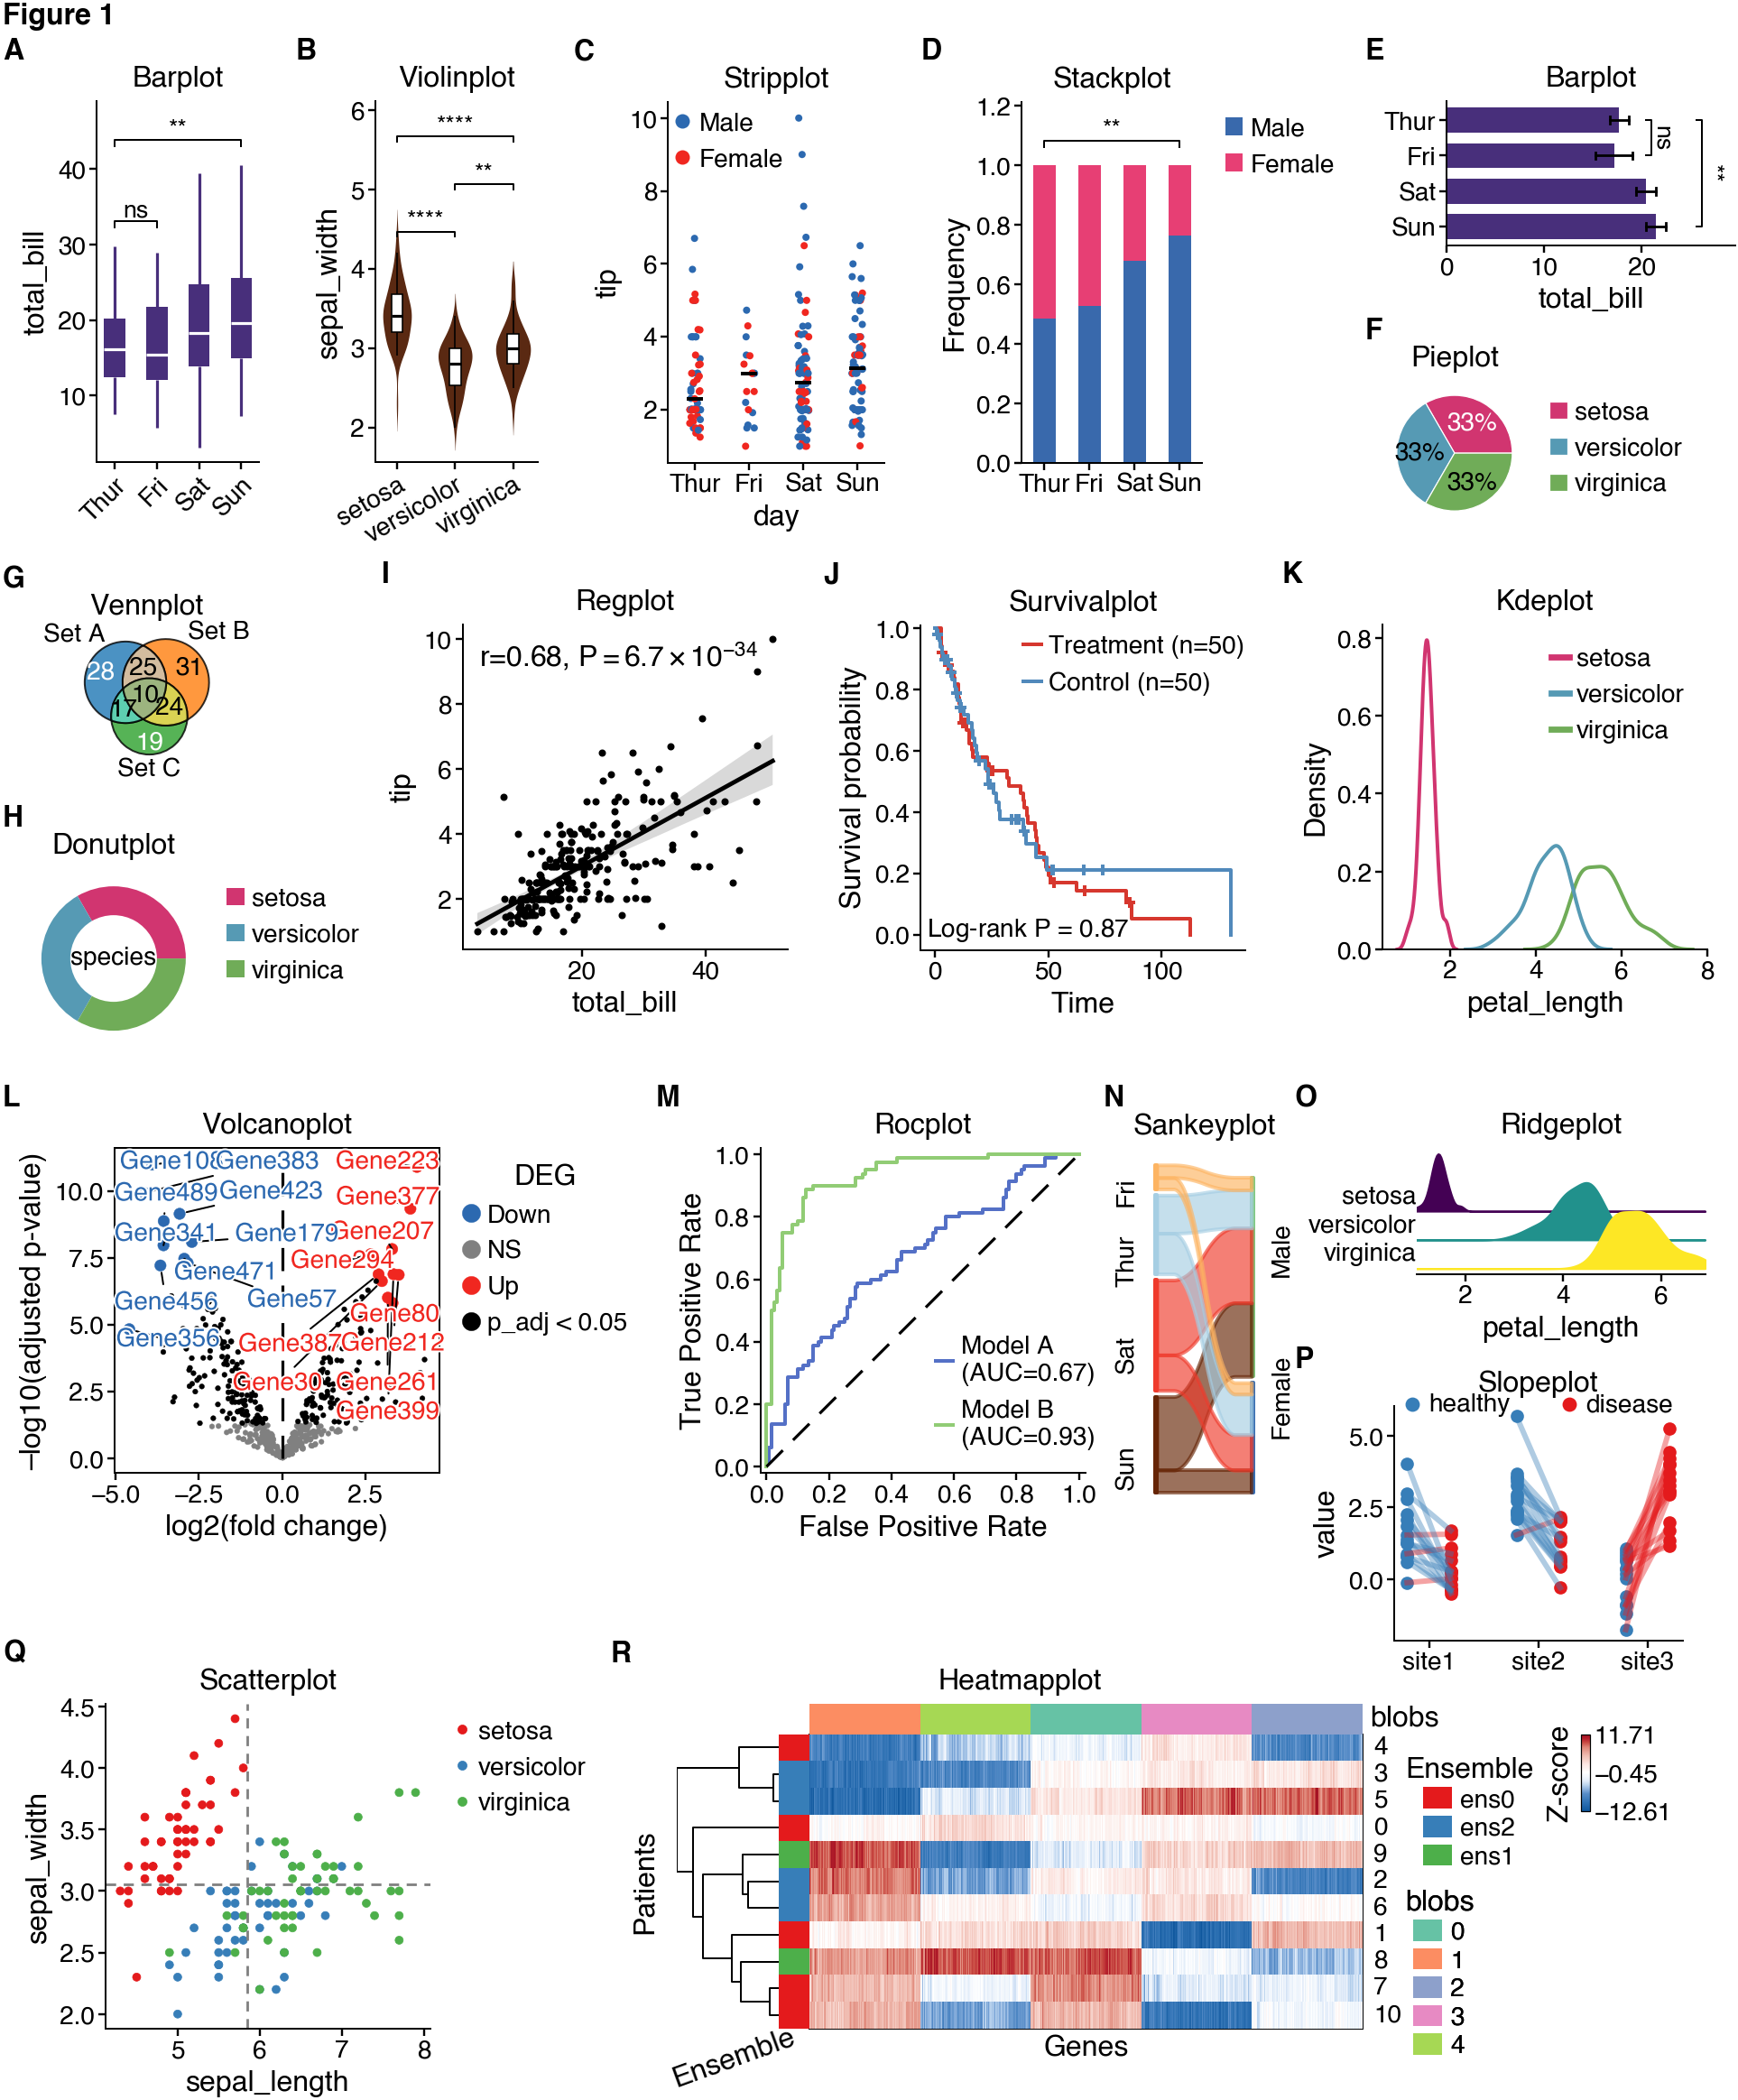
cnsplots is a Python visualization library designed specifically for creating publication-ready scientific figures. It takes care of the tedious styling details so you can focus on your science.
Why cnsplots?
- 🎨 Publication-Ready: Pre-configured styles matching Cell, Nature, and Science journal requirements
- 🎯 Simple API: Create complex multi-panel figures with just a few lines of code
- 📐 Precise Control: Specify dimensions in pixels, perfect for journal submission guidelines
- 🖋️ Adobe Illustrator Compatible: SVG exports with editable fonts (no text-to-path conversion)
- 📊 Statistical Integration: Built-in statistical tests and annotations
- 🔧 Highly Customizable: Full control over colors, fonts, and styling
- 🌈 Rich Color Palettes: Curated color schemes optimized for scientific visualization
- 🧩 Multi-Panel Support: Easy creation of complex figure layouts
Features
📊 25+ Plot Types
Basic Plots
- Box plots, violin plots, bar plots, strip plots
- Scatter plots, line plots, regression plots
- Histograms, KDE plots, ridge plots
Scientific Plots
- Survival plots (Kaplan-Meier)
- Cumulative incidence plots
- ROC curves and forest plots
- Volcano plots and GSEA plots
- Confusion matrices
Specialized Plots
- Heatmaps with hierarchical clustering
- Dot plots for enrichment
- Venn diagrams and UpSet plots
- Sankey diagrams
- Pie and donut charts
- QQ plots and slope plots
🎨 Beautiful Color Palettes
Multiple curated palettes including:
- Qualitative: Cell, Nature, Science, Ecotyper1-6, Set1-3, Tableau, Bold
- Sequential: Parula, gnuplot, custom gradients
- Diverging: BlueRed, BuRd_custom, OrBu_custom
📐 Multi-Panel Figures
Create complex layouts with automatic panel labeling (A, B, C...):
import cnsplots as cns

mp = cns.multipanel(max_width=540)

# Panel A
mp.panel("A", width=150, height=150)
cns.boxplot(data=df1, x="group", y="value")

# Panel B
mp.panel("B", width=150, height=150)
cns.scatterplot(data=df2, x="x", y="y")

# Continues...
Installation
From PyPI
pip install cnsplots
This installs every supported plotting and scientific integration. Imports remain lazy, so those backends are loaded only when their APIs are first used.
Agent Skill
Install the bundled cnsplots skill so Codex and Claude Code can build plots using the package's current workflow and API:
cnsplots skill install
By default this installs the skill for both agents at user scope. Target one agent or the current project when needed:
cnsplots skill install --agent codex
cnsplots skill install --agent claude --scope project
Use $cnsplots in Codex or /cnsplots in Claude Code to invoke it explicitly.
Pass --force to update an existing installation after upgrading cnsplots.
For Development
First install uv, then:
git clone https://github.com/faridrashidi/cnsplots
cd cnsplots
make install
This installs the package with its development and documentation dependencies.
Quick Start
Basic Usage
import cnsplots as cns

# Load example data
df = cns.datasets.load_dataset("tips")

# Create a figure (width, height in pixels)
cns.figure(width=100, height=150)

# Create a publication-ready boxplot
cns.boxplot(data=df, x="day", y="total_bill")

# Save as vector graphic
cns.savefig("figure.svg")
Statistical Comparisons
# Add statistical significance annotations
cns.figure(150, 150)
cns.boxplot(
    data=df,
    x="day",
    y="total_bill",
    pairs=[("Thur", "Fri"), ("Sat", "Sun")],  # Compare these pairs
    test="t-test_welch",
    p_adjust="holm",
)
# Prints: P-values were determined by two-sided Welch's t-test.
Custom Colors
# Use custom color palette
cns.figure(200, 150, color_cycle="Ecotyper1")
cns.violinplot(data=df, x="day", y="total_bill", hue="sex")
Examples Gallery
Explore our comprehensive examples gallery featuring:
- 📦 Basic statistical plots
- 🧬 Genomics and bioinformatics visualizations
- 📈 Time-series and survival analysis
- 🎯 Machine learning results (ROC, confusion matrices)
- 🔬 Multi-omics data visualization
- 🎨 Custom color schemes and styling
Documentation
Full documentation is available at cnsplots.farid.one
Key Concepts
Figure Dimensions
Specify sizes in pixels for precise control:
cns.figure(width=100, height=150) # Final canvas size is 100px × 150px
Color Palettes
Access curated color palettes:
# Qualitative palettes (for categorical data)
cns.figure(color_cycle="Ecotyper1")  # Default, optimized for journals
cns.figure(color_cycle="Cell")  # Custom Cell-inspired journal palette
cns.figure(color_cycle="Nature")  # Nature-inspired journal palette
cns.figure(color_cycle="Science")  # Science-inspired journal palette
cns.figure(color_cycle="Set1")  # ColorBrewer Set1

# Sequential palettes (for continuous data)
cns.figure(color_map="parula")  # MATLAB-style
cns.figure(color_map="gnuplot")  # Default sequential

# Get individual colors
red = cns.RED
blue = cns.BLUE
Statistical Tests
Many plot functions include built-in statistical testing:
# Boxplot with Mann-Whitney U test and Holm correction
cns.boxplot(
    data=df,
    x="group",
    y="value",
    pairs="all",
    test="Mann-Whitney",
    p_adjust="holm",
)

# Barplot with Mann-Whitney U test and false-discovery-rate correction
cns.barplot(
    data=df,
    x="group",
    y="value",
    pairs=[("A", "B"), ("A", "C")],
    test="Mann-Whitney",
    p_adjust="fdr_bh",
)

# Stackplot with an explicit chi-squared test and Bonferroni correction
cns.stackplot(
    data=df,
    x="group",
    stack="category",
    pairs="all",
    test="chi-squared",
    p_adjust="bonferroni",
)
Export for Publication
# SVG for vector graphics (recommended)
cns.savefig("figure.svg")

# High-resolution PNG
cns.savefig("figure.png")

# PDF with editable text
cns.savefig("figure.pdf")
For Illustrator-optimized SVG post-processing, install MuPDF's mutool.
Without it, cns.savefig("figure.svg") falls back to a standard matplotlib SVG
and emits a warning instead of failing.
Requirements
- Python ≥ 3.10
- Core: matplotlib, numpy, pandas, seaborn
- Included integrations: lifelines, gseapy, scanpy, and other plotting backends
- Optional external tool: MuPDF's
mutoolfor enhanced SVG post-processing
See pyproject.toml for complete dependency list.
Contributing
Contributions are welcome! Please feel free to submit a Pull Request. For major changes, please open an issue first to discuss what you would like to change.
Citation
If you use cnsplots in your research, please cite:
@software{cnsplots,
  author = {Rashidi, Farid},
  title = {cnsplots: Publication-Ready Scientific Plots},
  year = {2026},
  url = {https://github.com/faridrashidi/cnsplots}
}
License
This project is licensed under the BSD 3-Clause License - see the LICENSE.md file for details.
Acknowledgments
Built with:
- matplotlib - Core plotting library
- seaborn - Statistical visualizations
- lifelines - Survival analysis
- PyComplexHeatmap - Complex heatmaps
- UpSetPlot - Set intersections
Inspired by the visualization standards of Cell, Nature, and Science journals.
Support
Related Projects
- matplotlib - The foundation of Python plotting
- seaborn - Statistical data visualization
- plotnine - Grammar of graphics for Python
- altair - Declarative visualization
Made with ❤️ for the scientific community
1 maintainer

Metadata
1 maintainer
Release files for cnsplots 0.7.0
For a detailed explanation of source distributions (sdists) and built distributions (wheels), please see the package formats documentation.
Source distribution (sdist)
| File | Size | Uploaded | |
|---|---|---|---|
| cnsplots-0.7.0.tar.gz | 699.0 kB | Details |
Built distribution (wheel)
| File | Interpreter | ABI | Platform | Reset |
|---|---|---|---|---|
| cnsplots-0.7.0-py3-none-any.whl | Python 3 | none | any | Details |
Total release size: 1.4 MB
Release files / cnsplots-0.7.0.tar.gz
| Download URL | cnsplots-0.7.0.tar.gz |
|---|---|
| Size | 699.0 kB |
| Tags | Source |
|
SHA-256 checksum How to use checksums |
cc7cc636abaa2ab5217385f169c47a3f64de5733b29ebe04ac2d936a1c70a576
|
|
BLAKE2b-256 checksum How to use checksums |
f1af2a680b98b038d2d716ee46a3e4ca70f372da183493170ac4b1e07cdb80f7
|
| Upload date | |
|
Uploaded using Trusted Publishing? What is trusted publishing? |
Yes |
| Uploaded via |
twine/7.0.0 CPython/3.13.14
|
Provenance
Provenance describes where a file came from. On PyPI, provenance is shared via attestations, which provide a verifiable record of the build or publishing details. View details, limitations and caveats.


PyPI Publish Attestation
PyPI verified that this artifact, at this checksum, originated from the publisher listed below.
Signed by GitHub Actions, verified by PyPI on Aug 28, 2026.
Transparency logRelease files / cnsplots-0.7.0-py3-none-any.whl
| Download URL | cnsplots-0.7.0-py3-none-any.whl |
|---|---|
| Size | 705.7 kB |
| Tags | Python 3 |
|
SHA-256 checksum How to use checksums |
8dae3c9f13ede29512d3e04fdebeee3dd34ffdf5ab71d2f91f115bf165c4fd7f
|
|
BLAKE2b-256 checksum How to use checksums |
f13a06a7add32e957c742d869a558783ffd9de170c9e640deda29374b672b451
|
| Upload date | |
|
Uploaded using Trusted Publishing? What is trusted publishing? |
Yes |
| Uploaded via |
twine/7.0.0 CPython/3.13.14
|
Provenance
Provenance describes where a file came from. On PyPI, provenance is shared via attestations, which provide a verifiable record of the build or publishing details. View details, limitations and caveats.
PyPI Publish Attestation
PyPI verified that this artifact, at this checksum, originated from the publisher listed below.
Signed by GitHub Actions, verified by PyPI on Aug 28, 2026.
Transparency log













