Reusable React-based UI for Dash apps that computes and plots a Kaplan-Meier curve entirely using raw event and time-to-event data passed from Dash app. It eliminates analysis libraries, making it lightweight and frontend-driven.

Project description
DashKaplanMeier Dash Component
Dash component built with React to render Kaplan–Meier survival curves with enhanced interactivity and styling options. This component is ideal for visualizing survival analysis data directly within Dash applications.
Features
- Plot Kaplan–Meier survival curves from preprocessed data.
- Support for multiple curves with different group labels.
- Interactive tooltips and hover effects.
- Customizable colors and dimensions.
- Fully integrated with Dash callback system.
Installation
pip install dash-kaplan-meier
Install requirements
pip install dash
pip install lifelines
Usage
Here’s how to use the DashKaplanMeier component in your Dash app:
import dash
from dash import html, Dash
import dash_kaplan_meier as dkm
from dash_kaplan_meier.survival_stats import compute_survival_stats

# Example data
time        = [your time values list here]
event       = [your event values list here]
group       = [you rgroup values list here]

# Compute statistics
stats       = compute_survival_stats(time ,event, group)

# Dash app
app         = Dash()

# Dash app layout with DashKaplanMeier component
app.layout = html.Div([
    dkm.DashKaplanMeier(
        id              = 'km-example',
        time            = time,
        event           = event,
        group           = group,
        showCIs         = True,
        colors          = ['blue', 'green', 'red'],
        showStatistics  = True,
        logrankP        = stats["logrank_p"],
        coxP            = stats["cox_p"],
        hazardRatio     = stats["hazard_ratio"],
        layout          ={  'title': 'Kaplan-Meier Survival Curve Example',
                            "xaxis": {"title": {"text": "Time (months)"}},
                            "yaxis": {"title": {"text": "Survival Probability"}}},
        title           = "Kaplan-Meier curves",
        config          = {'responsive': True}
    )
])

if __name__ == '__main__':
    app.run(debug=True)
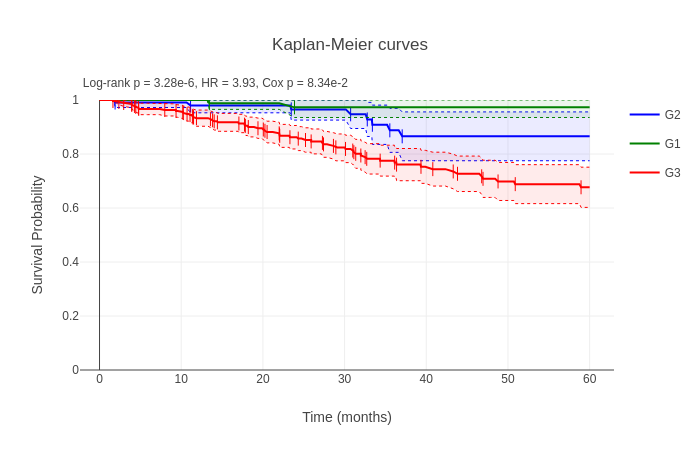
Plot Example
Contributing
See CONTRIBUTING.md
License
MIT License. See LICENSE file for details.


Download files
Download the file for your platform. If you're not sure which to choose, learn more about installing packages.
Source Distribution
File details
Details for the file dash_kaplan_meier-0.1.1.tar.gz.
File metadata
- Download URL: dash_kaplan_meier-0.1.1.tar.gz
- Upload date:
- Size: 1.4 MB
- Tags: Source
- Uploaded using Trusted Publishing? No
- Uploaded via: twine/6.1.0 CPython/3.10.12
File hashes
| Algorithm | Hash digest | |
|---|---|---|
| SHA256 |
2d4ee7a8fcf3a597b937f0922358b049833213acdf29de3556753e126d8f04e6
|
|
| MD5 |
21022560f4d8253cc313d9e9d0692a09
|
|
| BLAKE2b-256 |
9484e434f09039538049d9fa22b63ac71e5eabcf7806d64c67405da83578deb8
|


