
Data Clock Visualisation Library





Introduction
This library allows the user to create data clock graphs, using the matplotlib Python library.
Data clocks visually summarise temporal data in two dimensions, revealing seasonal or cyclical patterns and trends over time. A data clock is a circular chart that divides a larger unit of time into rings and subdivides it by a smaller unit of time into wedges, creating a set of temporal bins.
These temporal bins are symbolised using graduated colors that correspond to a count or aggregated value taking place in each time period.
The table below details the currently supported chart modes and the corresponding rings and wedges:
| Mode | Rings | Wedges | Description |
|---|---|---|---|
| YEAR_MONTH | Years | Months | Years / January - December. |
| YEAR_WEEK | Years | Weeks | Calendar years / weeks 1 - 52. |
| WEEK_DAY | Weeks | Days of the week | ISO weeks / Monday - Sunday. |
| DOW_HOUR | Days of the week | Hour of day | Monday - Sunday / 24 hours. |
| DAY_HOUR | Days | Hour of day | Days 1 - 366 / 24 hours. |
The full documentation can be viewed on the project GitHub Page.
Example charts
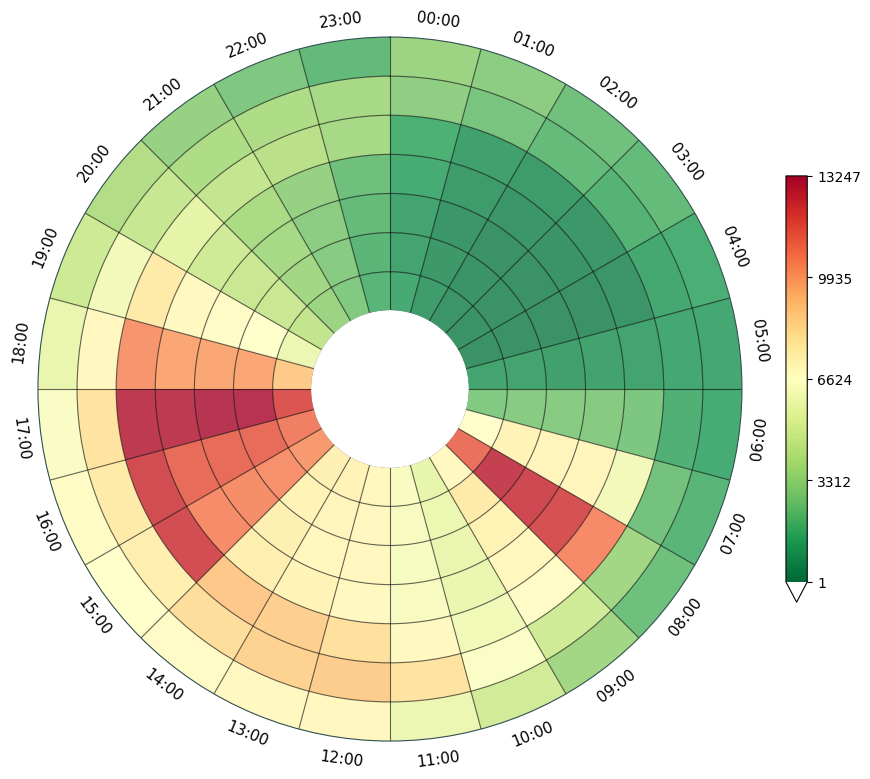
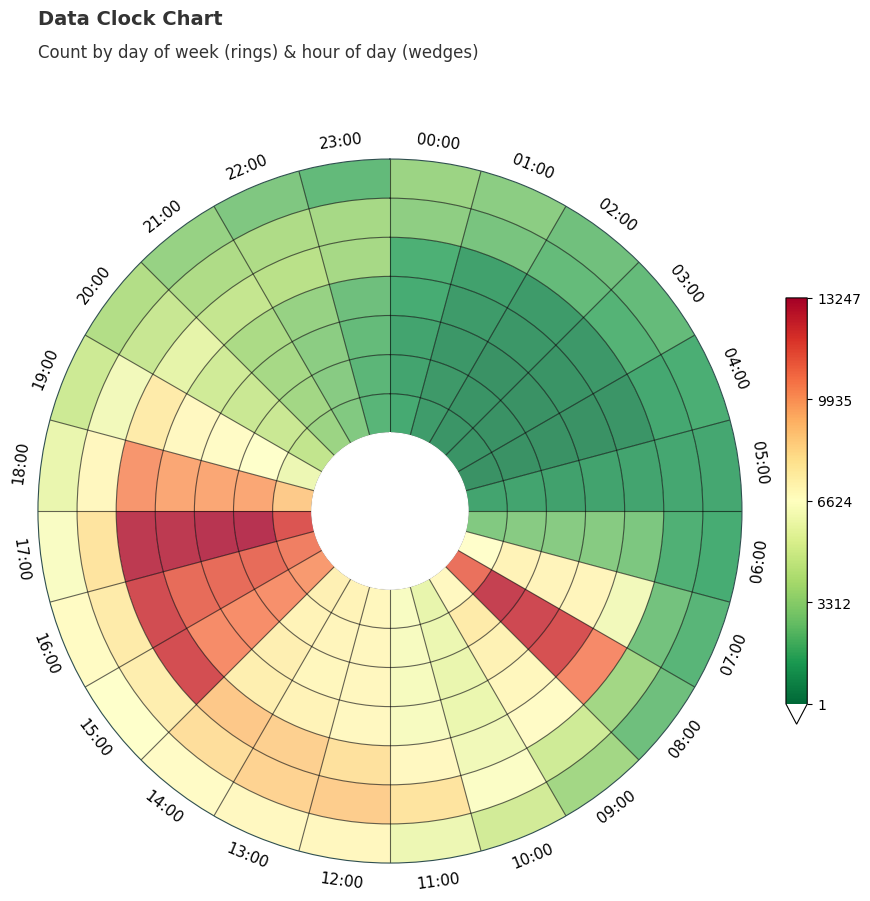
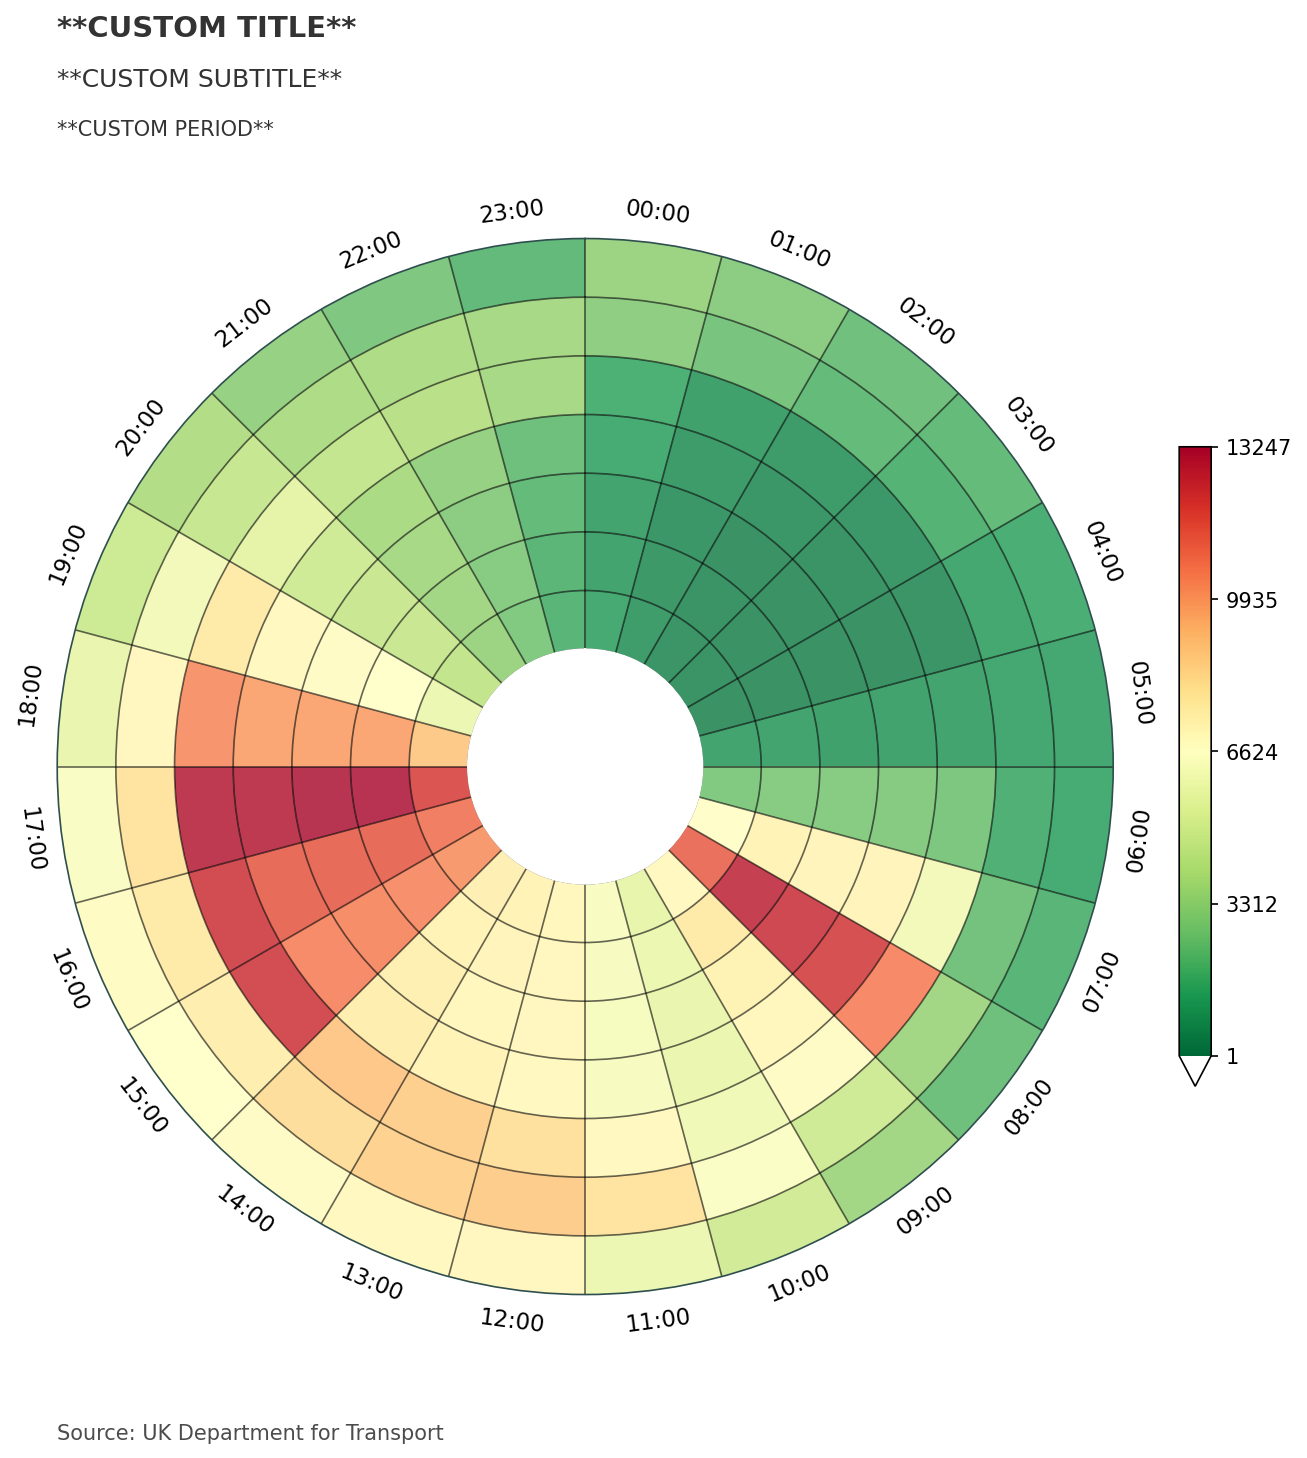
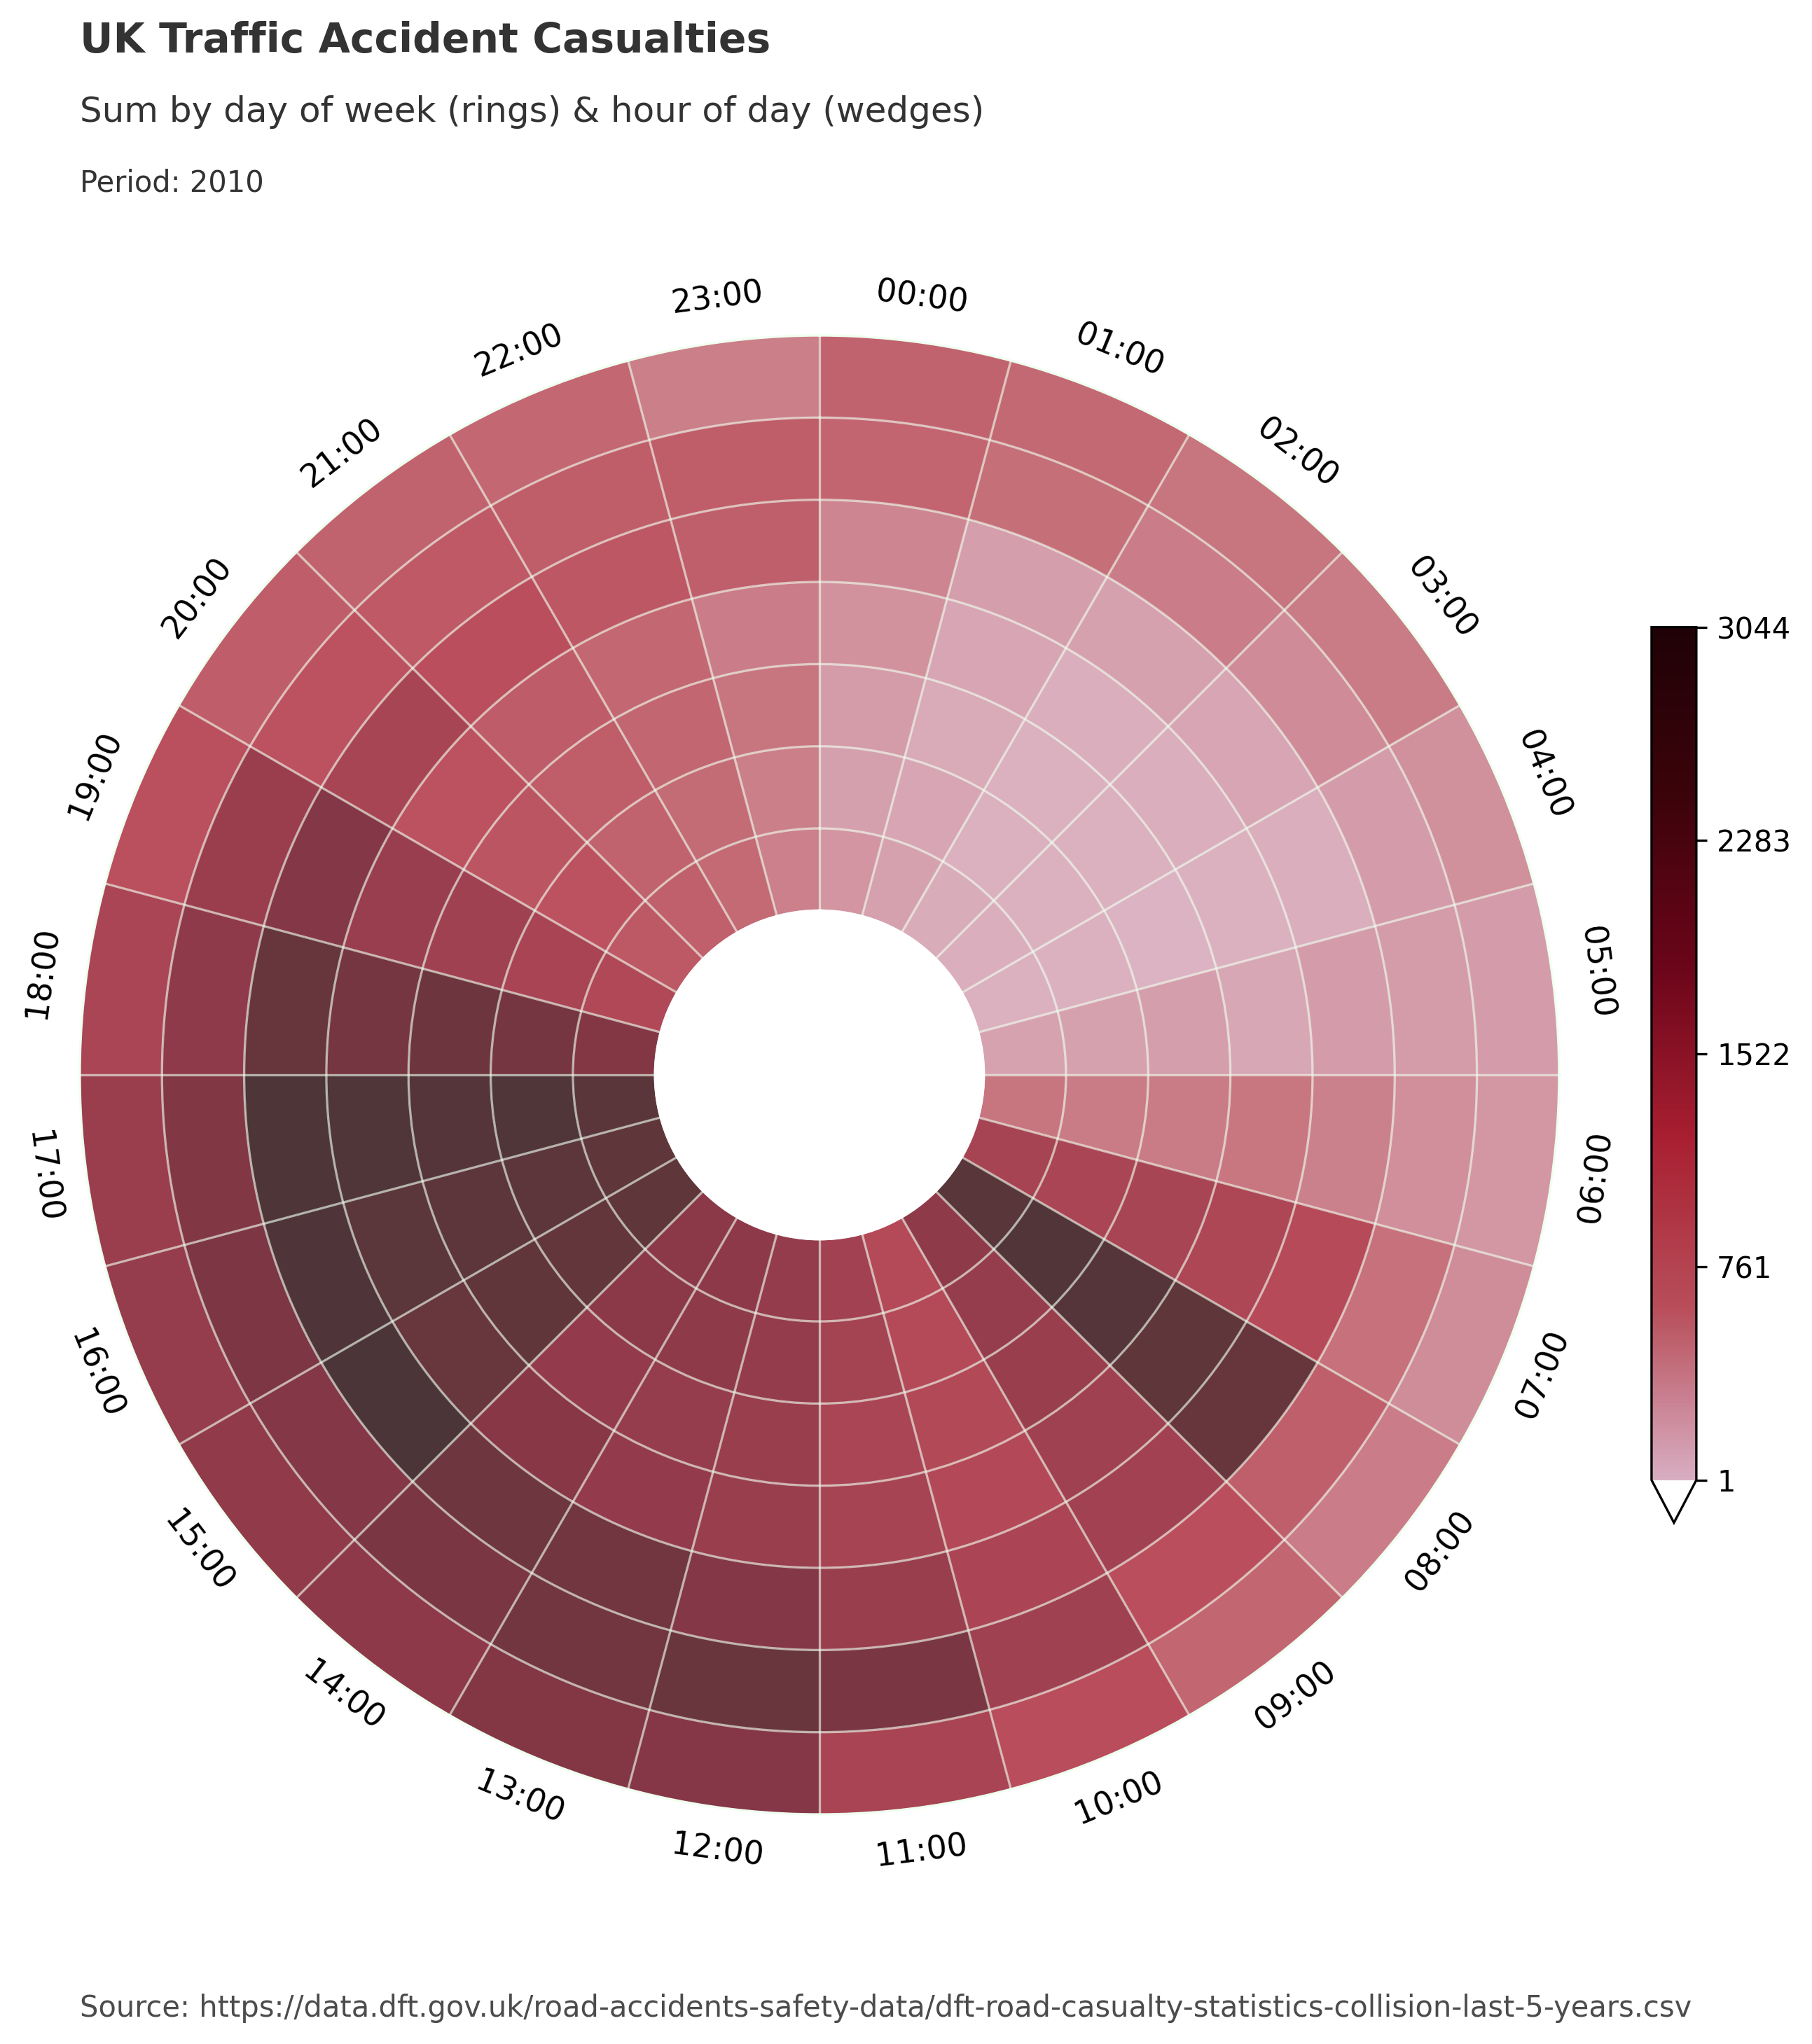
Chart examples have been generated using UK Department for Transport data 2010 - 2015.
import pandas as pd
from dataclocklib.charts import dataclock

data = pd.read_parquet(
    "https://raw.githubusercontent.com/andyrids/dataclocklib/main/tests/data/traffic_data.parquet.gzip"
)

chart_data, fig, ax = dataclock(
    data=data,
    date_column="Date_Time",
    mode="DOW_HOUR",
    spine_color="darkslategrey",
    grid_color="black",
    default_text=False,
)
import pandas as pd
from dataclocklib.charts import dataclock

data = pd.read_parquet(
    "https://raw.githubusercontent.com/andyrids/dataclocklib/main/tests/data/traffic_data.parquet.gzip"
)

chart_data, fig, ax = dataclock(
    data=data,
    date_column="Date_Time",
    mode="DOW_HOUR",
    spine_color="darkslategrey",
    grid_color="black",
    default_text=True,
)
import pandas as pd
from dataclocklib.charts import dataclock

data = pd.read_parquet(
    "https://raw.githubusercontent.com/andyrids/dataclocklib/main/tests/data/traffic_data.parquet.gzip"
)

chart_data, fig, ax = dataclock(
    data=data,
    date_column="Date_Time",
    mode="DOW_HOUR",
    default_text=True,
    spine_color="darkslategrey",
    grid_color="black",
    chart_title="**CUSTOM TITLE**",
    chart_subtitle="**CUSTOM SUBTITLE**",
    chart_period="**CUSTOM PERIOD**",
    chart_source="Source: UK Department for Transport",
    dpi=150,
)
import pandas as pd
from dataclocklib.charts import dataclock

data = pd.read_parquet(
    "https://raw.githubusercontent.com/andyrids/dataclocklib/main/tests/data/traffic_data.parquet.gzip"
)

chart_data, fig, ax = dataclock(
    data=data.query("Date_Time.dt.year.eq(2010)"),
    date_column="Date_Time",
    agg_column="Number_of_Casualties",
    agg="sum",
    mode="DOW_HOUR",
    cmap_name="X26",
    cmap_reverse=True,
    spine_color="honeydew",
    grid_color="honeydew",
    default_text=True,
    chart_title="UK Traffic Accident Casualties",
    chart_subtitle=None,
    chart_period="Period: 2010",
    chart_source="Source: https://data.dft.gov.uk/road-accidents-safety-data/dft-road-casualty-statistics-collision-last-5-years.csv",
    dpi=300,
)
Installation
You can install using pip:
python -m pip install dataclocklib
To install from GitHub use:
python -m pip install git+https://github.com/andyrids/dataclocklib.git
Development Installation
Astral uv is used as the Python package manager. To install uv see the installation guide @ uv documentation.
Clone the repository:
git clone git@github.com:andyrids/dataclocklib.git
cd dataclocklib
Sync the dependencies, including the dev dependency group and optional dependencies with uv:
uv sync --all-extras
Activate the virtual environment:
. .venv/bin/activate
Common development tasks are just recipes (run just to list them):
just setup      # uv sync --all-extras, install the prek git hooks, update .secrets.baseline
just coverage   # run the tests with a coverage report
Sphinx documentation
Build the HTML documentation into docs/build/html (warnings are treated as errors):
just docs
Serve it locally with live reload, or remove the build output:
just docs-serve
just docs-clean
1 maintainer

Release files for dataclocklib 0.3.0
For a detailed explanation of source distributions (sdists) and built distributions (wheels), please see the package formats documentation.
Source distribution (sdist)
| File | Size | Uploaded | |
|---|---|---|---|
| dataclocklib-0.3.0.tar.gz | 31.6 kB | Details |
Built distribution (wheel)
| File | Interpreter | ABI | Platform | Reset |
|---|---|---|---|---|
| dataclocklib-0.3.0-py3-none-any.whl | Python 3 | none | any | Details |
Total release size: 61.7 kB
Release files / dataclocklib-0.3.0.tar.gz
| Download URL | dataclocklib-0.3.0.tar.gz |
|---|---|
| Size | 31.6 kB |
| Tags | Source |
|
SHA-256 checksum How to use checksums |
29777cd3f7cf0f66ca418abd7ba3de29cdc89c728577044876708978c499c684
|
|
BLAKE2b-256 checksum How to use checksums |
5d617682257c170eeed9483c7af3b7404c3b943efcb3aa567445dd5d24dec2bf
|
| Upload date | |
|
Uploaded using Trusted Publishing? What is trusted publishing? |
Yes |
| Uploaded via |
twine/7.0.0 CPython/3.13.14
|
Provenance
Provenance describes where a file came from. On PyPI, provenance is shared via attestations, which provide a verifiable record of the build or publishing details. View details, limitations and caveats.


PyPI Publish Attestation
PyPI verified that this artifact, at this checksum, originated from the publisher listed below.
Signed by GitHub Actions, verified by PyPI on Sep 25, 2026.
Transparency logRelease files / dataclocklib-0.3.0-py3-none-any.whl
| Download URL | dataclocklib-0.3.0-py3-none-any.whl |
|---|---|
| Size | 30.1 kB |
| Tags | Python 3 |
|
SHA-256 checksum How to use checksums |
d676ecf16ca63011f3c820ee38e0bacb47fa5e85b7d9fe4b6bee5bf01bf4b7d9
|
|
BLAKE2b-256 checksum How to use checksums |
be35339cf3434dfea16e6274277dd14ae249c05879304d7694b10aac9a054685
|
| Upload date | |
|
Uploaded using Trusted Publishing? What is trusted publishing? |
Yes |
| Uploaded via |
twine/7.0.0 CPython/3.13.14
|
Provenance
Provenance describes where a file came from. On PyPI, provenance is shared via attestations, which provide a verifiable record of the build or publishing details. View details, limitations and caveats.
PyPI Publish Attestation
PyPI verified that this artifact, at this checksum, originated from the publisher listed below.
Signed by GitHub Actions, verified by PyPI on Sep 25, 2026.
Transparency log













