
disability-access-charts
Charts that check their own words.
Built for Curb Cut, an accessible platform for Nigerian disability data. Every chart ships with alt-text (the text alternative that WCAG 2.2 Success Criterion (SC) 1.1.1 asks for; W3C, 2023) built from its data, and the library then checks that text against the data: every number, and every comparison it recognises ("highest", "higher than", "twice", "ranked 3rd"). We call this the claim checker. With survey estimates, it tests whether the confidence intervals support the claim. The same checker gates any LLM rewording, and audit() runs it in CI on the library's own chart documents and, on a best-effort basis, on plain Plotly bar and scatter figures given their alt-text.
Status: 0.4 (alpha). English, plus Hausa, Yoruba, Igbo and Nigerian Pidgin (Naijá) drafted by an AI model and not reviewed by a native speaker (see "New in 0.4"). The library has not yet been evaluated with screen-reader users (see "Limitations" below).
New in 0.4: descriptions in Hausa, Yoruba, Igbo and Pidgin
- Four more language tables (
ha,yo,ig,pcm): the description templates, the findings sentences, the map's own sentences and each language's claim-checker vocabulary, with the same keys and placeholders as English. Numbers stay as digits with "." as the decimal point. The wording was drafted by an AI model (Claude) and has not been reviewed by a native speaker; say so wherever you show it. Details, choices and limits: the languages note. translations=onbar,grouped_bar,dotandchoropleth: aTranslationper language carries the strings you supply (title, source, category label, interval label, and any names to translate). The document gainsalt_text_translations: each language's description (and finding sentences, and a map's class sentence), from templates only, withorigin: "template"andreviewed: false. No language model is involved.- Each translation is audited by its own language's claim checker, and must have exactly the English description's numbers, in the same order; a template translation must equal what the templates give. A wrong number in a translation fails the audit.
- Schema 1.1 for chart documents and 1.2 for choropleths: only the optional
alt_text_translationsfield is new; documents without translations are unchanged apart from the version numbers.
New in 0.3: maps that are easier to read
- A clearer default map scheme.
choropleth(scheme="ylgnbu"), now the default: a yellow to green to blue scale chosen to stay distinguishable under simulated colour-vision deficiency (ColorBrewer's YlGnBu in the light theme (Harrower and Brewer, 2003), a matching dark palette that gets brighter with the value) with larger lightness steps than 0.2's greens.MAP_SCHEMESlists the schemes. - Cased boundaries. No one boundary colour stands out from both a pale yellow and a dark blue, so a theme can add a
halo: the page draws a wide halo stroke under a narrow edge stroke. The audit asks that the edge is 3:1 against the background and the halo, and that the edge or the halo is 3:1 against the background and every fill. - Map patterns ordered by ink weight, lowest class lightest: plain, dots, lines, crosshatch, solid (
MAP_PATTERNS; ordered subsets for fewer classes). Each class has its own ink, black or white, whichever contrasts more with its fill, audited at 3:1. Bars are unchanged. - A colour-vision check. Neighbouring fills are compared under simulated deuteranopia, protanopia and tritanopia (Machado et al., 2009) with the CIEDE2000 colour difference (Luo et al., 2001; Sharma et al., 2005): an error under 5, a warning under 10. These are design thresholds chosen for this library, not WCAG numbers and not derived from a perception study. The default scheme's closest pair is 10.3 (light) and 11.6 (dark). Pure Python, in
disability_access_charts.vision. - Legend-filter metadata. Each class lists its regions and the sentence a page announces when a legend button shows only that class ("Showing 6 states in 4% to under 6%: …"), checked against the data.
What changed from 0.2, precisely:
- Changed default:
choropleth()usesscheme="ylgnbu"(andMAP_THEMESis now its themes). For the 0.2 look, passscheme="green": the 0.2 greens, one boundary colour, the 0.2 pattern order and one ink per theme. Its audit now adds acolour-vision-targetwarning (the greens reach 7.5 and 8.2), socheck --strictfails on it. Custom themes too:choropleth(..., themes=...)withoutschemenow gets the 0.3 pattern style (ink-weight order with an ink per class, no singlepatterns.ink) and the new audit checks, so a custom set of fills can fail the newcolour-visionerror (or the casing rule, if a theme has a halo); passscheme="green"with yourthemes=to keep the 0.2 pattern order and one ink per theme. - Map documents use schema
"1.1":themesmay have ahalo,patternshassequenceand (outside the green scheme)class_inkin place ofink, classes haveregionsandannounce, and there arelegend,keyboard.legend_filterandmeta.scheme.legend_filter=Falseleaves the legend metadata out. - New audit checks: cased-boundary contrast,
colour-vision,colour-vision-target,legend-filter-matches-data, andpatterns-ink-rulefor maps. svg_pattern()takesink=Nonefor a tile with no ink. Bars, dot plots and everything else are unchanged apart from the version number.
See the maps note and the patterns note.
New in 0.2
- Statistical findings.
findings=Trueonbar(),grouped_bar()ordot()adds a block that compares the estimates in four families declared in advance (highest and lowest against the next, gaps between series, neighbours in the ranking, each estimate against an overall value), counts every comparison, and controls the false discovery rate (FDR) with the Benjamini-Hochberg procedure at q = 0.05 (Benjamini and Hochberg, 1995). It prints "N comparisons checked, K supported", hedges findings that involve an estimate flagged for review, and leaves out (and counts) those that involve a suppressed or unreliable one. The sentences go through the claim checker, and the audit recomputes the block from the data. It is descriptive, not causal: see the findings method. - Patterns. Five abstract tiles inspired by adire (dots and rings after oniko, checks, lines, crosshatch), drawn for this library; never nsibidi or Ukara signs.
grouped_bar()(new) gives each series its own colour and pattern, shown in the legend;bar(patterns=True)and every map class get one too. The audit checks that patterns and colours line up one to one and that the pattern ink is 3:1 against every fill in both themes. See the patterns note. - Maps are stable.
choropleth()is exported, with a pattern per class by default, so neighbouring classes differ by more than a shade. - Precision flags.
Series(..., precision=...)takes a flag per estimate (reliable,review,unreliable,suppressed), shown in the table and used by the findings.
What changed from 0.1, precisely:
choropleth()gives each class a pattern by default (patterns=Nonemeans "auto": on with five classes or fewer, off with more, when the audit warns that neighbouring classes differ by shade alone).patterns=Falsegives the 0.1 document;patterns=Truewith more than five classes raises.describe(chart_type="bar")with several series now describes grouped bars; in 0.1 it raised.- In the claim checker, a list of names with values separated by semicolons ("A, 1%; B, 2%; and C, 3%") is one clause, so each estimate in a list written that way (with "; and" before the last item) is checked (a two-item list without the "and", or a comma list, is only partly checked), and a hedged rank ("the second-highest estimate") no longer warns when the test cannot separate it from a neighbour.
Otherwise bar() and dot() with patterns and findings off (their default) give the same document as in 0.1, apart from the version number.
pip install disability-access-charts            # core: no dependencies
pip install "disability-access-charts[plotly]"  # adds Plotly Figure support
What it looks like
Every chart comes in a light and a dark theme, both contrast-checked:
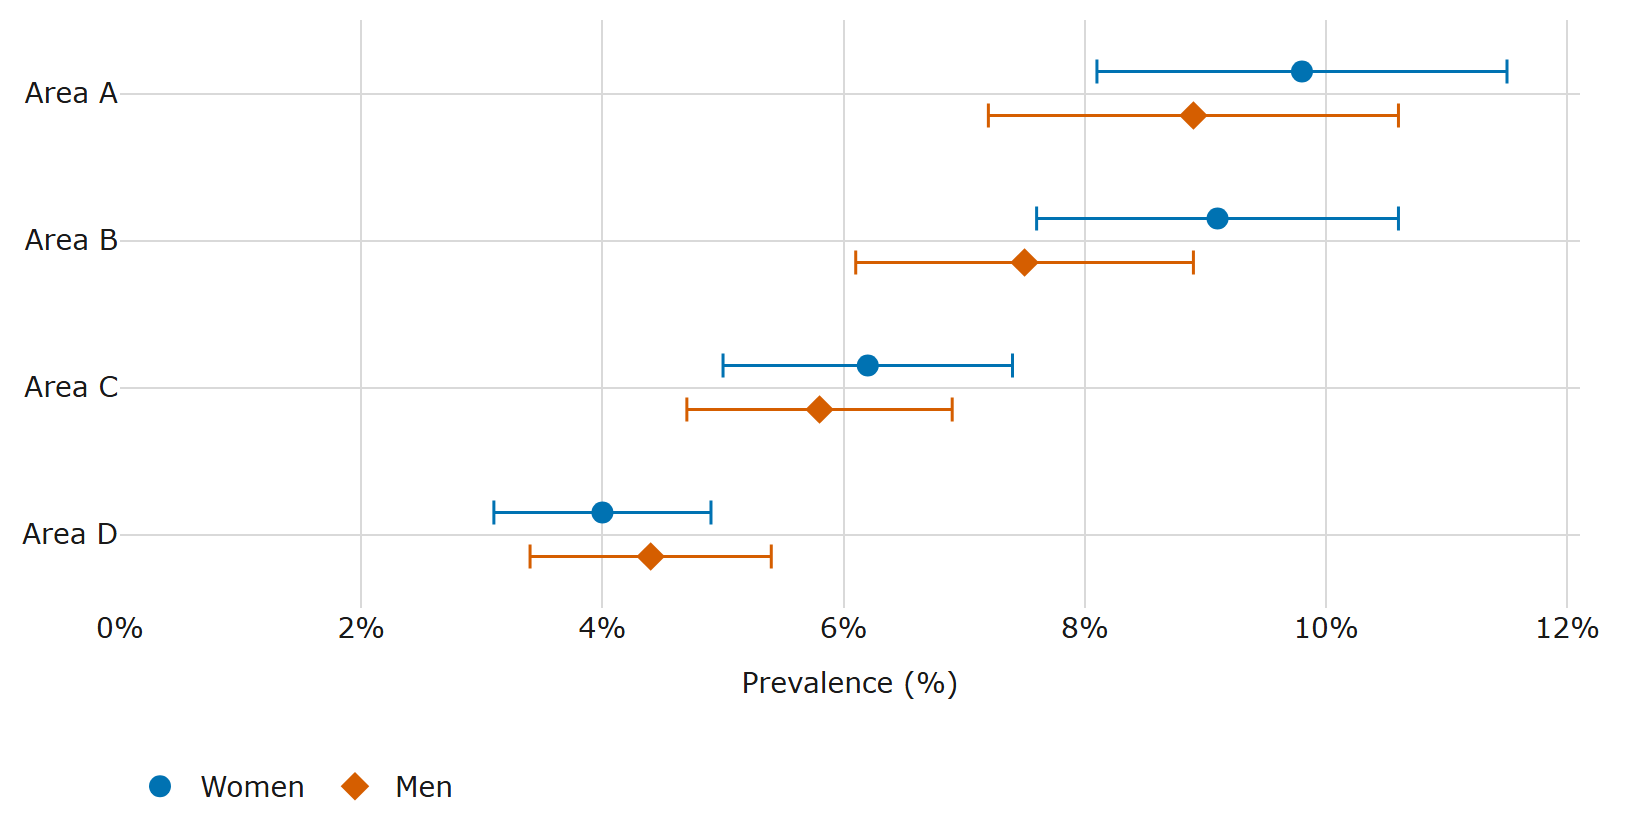
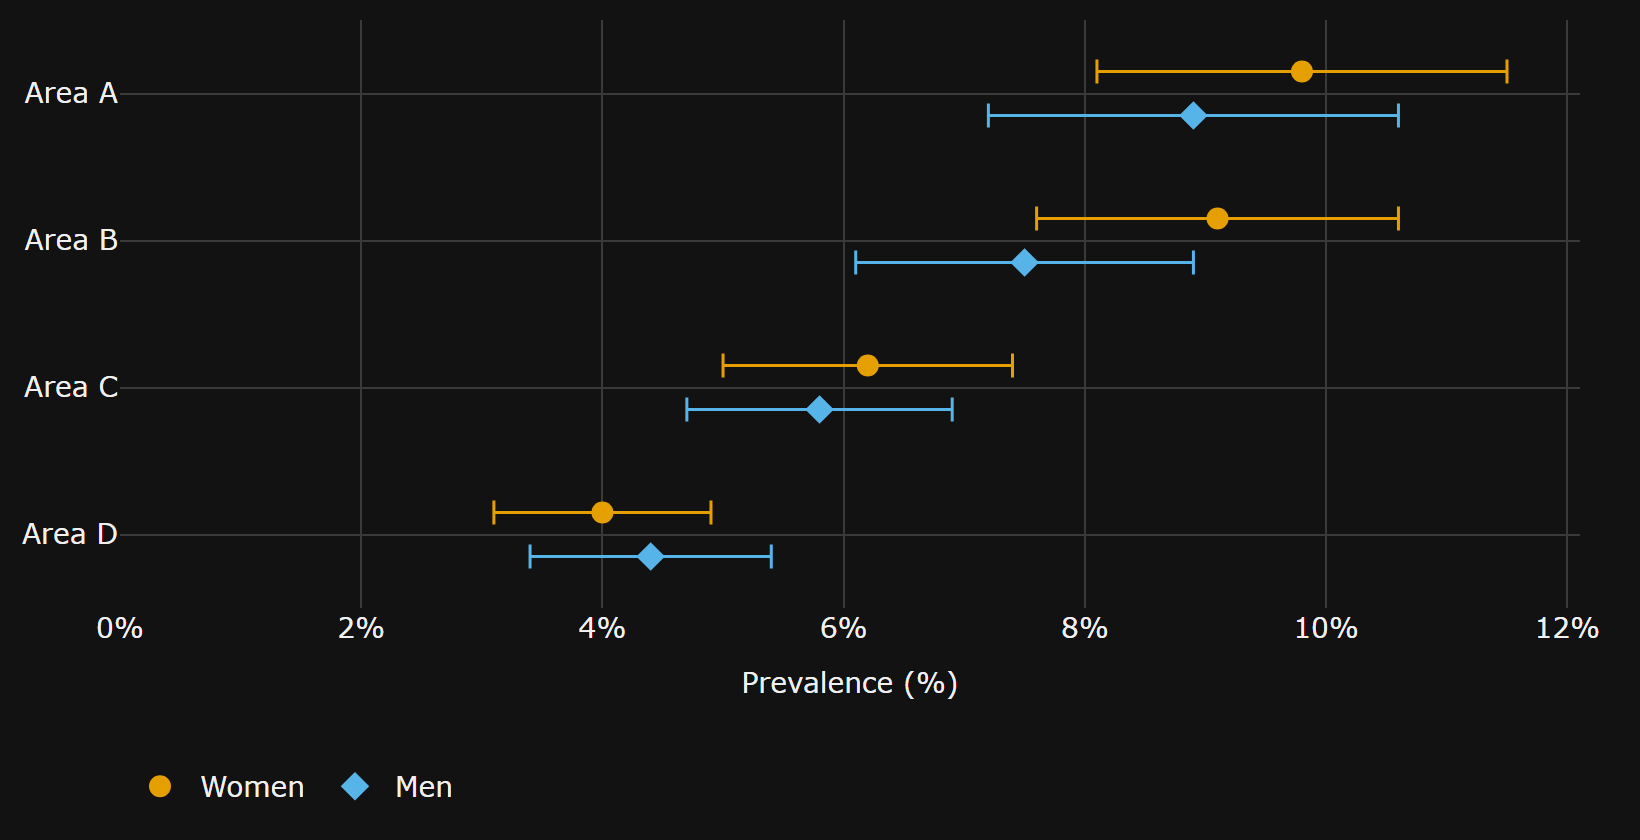
The description the library wrote for this chart (synthetic data), shortened here:
Women: highest estimate Area A, 9.8%, and the survey cannot show a difference from the next estimate, Area B, 9.1%; lowest estimate Area D, 4.0%, and the survey can show a difference from the next estimate, Area C, 6.2%. …
So "Area A is the highest" is never written, and if someone writes it, the checker rejects it:
from disability_access_charts import ChartData, Series, check_alt_text, dot

areas = ["Area A", "Area B", "Area D"]
women = Series(
    "Women",
    values=(9.8, 9.1, 4.0),
    lower=(8.1, 7.6, 3.1),  # 95% confidence interval
    upper=(11.5, 10.6, 4.9),
)

doc = dot(
    areas,
    [women],
    title="ILLUSTRATIVE ONLY: synthetic prevalence (not real data)",
    value_label="Prevalence (%)",
    category_label="Area",
    source="Synthetic",
    unit="percent",
)
data = ChartData.from_dict(doc["data"])

check_alt_text("Area A is higher than Area D.", data)  # [] : the difference is supported
check_alt_text("Area A is higher than Area B.", data)
# [Problem(..., kind='comparison', severity='error',
#   reason='the survey cannot show that Area A is higher than Area B: the difference 0.70
#           is not more than 2.27', suggestion='the survey cannot show a difference')]
What you get
bar(), grouped_bar(), dot() and choropleth() return one JSON document per chart, with no Plotly import needed:
| key | what it holds |
|---|---|
plotly |
a static Plotly.js spec: no hover-only data, no zoom or pan |
alt_text |
the description, built from the data, summary first |
table |
the same numbers as an accessible table |
data |
the numbers the checker reads (categories, series, intervals) |
themes |
light and dark colours, contrast-checked (WCAG 2.2 SC 1.4.3: text at least 4.5:1; SC 1.4.11: graphical objects at least 3:1) |
keyboard |
how a keyboard user reaches the data (the table) |
audit |
every check, each with a WCAG criterion and a severity |
meta |
generator, library version, source, alt-text language and origin |
findings |
with findings=True: the comparisons, their tests, the FDR result and the sentences |
patterns |
with patterns on: the tiles, each series' or class's tile, and the ink (each theme's, or since 0.3 each map class's) |
alt_text_translations |
with translations= (0.4): each language's description, origin, review status, inputs, finding sentences and (maps) class sentence |
Also: audit(fig) for a document or any Plotly figure, theme(fig, "dark"), to_html(doc) and to_csv(doc), figure(doc) for a Plotly Figure, and a CLI for CI:
disability-access-charts check charts/*.json            # exit 1 if any chart fails
disability-access-charts check --strict charts/*.json   # warnings fail too
What the checker checks
- Numbers: each must be a figure of the category it sits next to (value, interval bound or share), so "Kano, 11.9%" fails if 11.9% is Lagos's.
- Extremes: largest, highest, smallest, lowest.
- Comparisons: higher, lower, more, fewer than, including lists ("higher than Lagos and Abuja").
- Ratios: twice, half, N times, within 5%.
- Ranks: "ranked 2 of 37", "3rd", "the second-highest".
- "No difference" always fails: a survey can't show that two groups are equal.
With confidence intervals, "A is higher than B" passes only if the difference is larger than 1.96 times its standard error, worked out from the two intervals (a two-sided z-test at the 5% level). This assumes roughly symmetric intervals and independent groups, and applies no correction for multiple comparisons; it warns when groups may not be independent. "A is the highest" must be separated from every other group; otherwise write "A has the highest estimate".
What a pass means: no recognised claim was found false. It does not make a description true or complete.
Limits. Negated claims ("not higher"), words it doesn't know ("exceeds", "similar"), and numbers written as words get a warning, not a check. Differences written as numbers ("3 points higher"), comparisons with a stated number ("above 10%"), trends and causes are not understood. The full rules are in the claim checker reference.
LLM polish (optional)
polish_alt_text(doc, disclosure_checked=True) asks Gemini, then Groq, to reword the alt-text. A rewording is kept only if the checker finds no errors or warnings in it and it keeps every category, number, interval label and the source; otherwise the data-built text stays. It sends only the chart's aggregates, title and source. Pass only disclosure-checked public aggregates, never microdata. Results are cached in .disability_access_charts_cache/, and the tests never call the network.
More
- Languages: one table of templates and claim words per language (
_lang/en.py,ha.py,yo.py,ig.py,pcm.py;LANGUAGES). The four Nigerian-language tables are AI-drafted and unreviewed. Numbers stay as digits in every language, so the checker still works. eSpeak NG (which NVDA uses) has no voice for Hausa, Yoruba, Igbo or Pidgin, so these descriptions serve readers rather than listeners. - Maps:
choropleth()builds a shaded-map document in fixed classes, each with its own pattern (up to five classes, ordered by ink weight) on a scale chosen to stay distinguishable under simulated colour-vision deficiency, with cased boundaries, with the same alt-text checks, a table and an audit;audit()andcheckhandle it. The page draws the SVG from the document. How its colours and patterns meet WCAG is in the maps note. - Python: 3.10 or later. Tests and CI run on 3.12 only. Python 3.10 was checked by hand for the 0.2.0 release (installing the wheel and running the examples); it is not part of CI.
- Examples (in the source distribution and the repository's
examples/): JONAPWD's 2025 assumed figures by disability type (a WHO 15% benchmark applied to population, not survey estimates), a synthetic dot plot with intervals and findings, a synthetic patterned map written out as a standalone SVG page, and an audit of a plain Plotly figure. The installed package holds no data.
How it compares
In a search of PyPI, GitHub and the literature (2026-10-21) we found no other library that checks the comparative claims in a chart description against the chart's data. The closest work we found is AggChecker (Jo et al., 2019), a research system that checks natural-language claims about aggregates against a relational database rather than a chart.
- a11yviz has WCAG-tagged palettes, alt-text scaffolds and audits for plotnine, plotly and Quarto.
- maidr, the Python package of the MAIDR system (Seo et al., 2024), makes charts explorable by keyboard, with sound, braille and text descriptions.
- The Highcharts accessibility module (a JavaScript charting library, not Python) adds keyboard navigation and ARIA markup and exposes the title, axis titles, series names and an author-written description to screen readers; the page we checked does not describe generated summaries.
Use maidr for multimodal exploration. Use this library to catch numbers and comparisons in a description that contradict the data, and to report which differences in a chart survive a multiple-comparison correction. The two are complementary rather than alternatives. (The a11yviz and maidr descriptions were checked against their PyPI pages on 2026-10-29: a11yviz 0.1.8, maidr 1.28.1. The Highcharts description was checked against its accessibility-module documentation on 2026-11-04.) No benchmark comparison with these tools has been run.
Limitations
- No evaluation with screen-reader users yet. The generated wording follows a published interview study (Sharif et al., 2023), but the library's own output has not been tested with regular screen-reader users. The author is not a screen-reader user.
- Automated checks are partial. The audit checks the chart document (colours, alt-text, table, metadata). It cannot check how a page renders the document, how a screen reader announces it, or whether a description is useful; those need manual testing.
- The claim checker has known blind spots (listed above and in the claim checker reference); its false-negative rate on real descriptions has not been measured.
- Colour-vision thresholds are design choices, not validated against perception data (see the maps note).
References
Benjamini, Y. and Hochberg, Y. (1995). Controlling the false discovery rate: a practical and powerful approach to multiple testing. Journal of the Royal Statistical Society, Series B, 57(1), 289–300. https://doi.org/10.1111/j.2517-6161.1995.tb02031.x
Harrower, M. and Brewer, C. A. (2003). ColorBrewer.org: an online tool for selecting colour schemes for maps. The Cartographic Journal, 40(1), 27–37. https://doi.org/10.1179/000870403235002042
Jo, S., Trummer, I., Yu, W., Wang, X., Yu, C., Liu, D. and Mehta, N. (2019). AggChecker: a fact-checking system for text summaries of relational data sets. Proceedings of the VLDB Endowment, 12(12), 1938–1941. https://doi.org/10.14778/3352063.3352104
Luo, M. R., Cui, G. and Rigg, B. (2001). The development of the CIE 2000 colour-difference formula: CIEDE2000. Color Research and Application, 26(5), 340–350. https://doi.org/10.1002/col.1049
Machado, G. M., Oliveira, M. M. and Fernandes, L. A. F. (2009). A physiologically-based model for simulation of color vision deficiency. IEEE Transactions on Visualization and Computer Graphics, 15(6), 1291–1298. https://doi.org/10.1109/TVCG.2009.113
Seo, J., Xia, Y., Lee, B., McCurry, S. and Yam, Y. J. (2024). MAIDR: making statistical visualizations accessible with multimodal data representation. In Proceedings of the CHI Conference on Human Factors in Computing Systems. https://doi.org/10.1145/3613904.3642730
Sharif, A., Zhong, R. and Wang, Y. (2023). Conveying uncertainty in data visualizations to screen-reader users through non-visual means. In Proceedings of the 25th International ACM SIGACCESS Conference on Computers and Accessibility (ASSETS '23). https://doi.org/10.1145/3597638.3614502
Sharma, G., Wu, W. and Dalal, E. N. (2005). The CIEDE2000 color-difference formula: implementation notes, supplementary test data, and mathematical observations. Color Research and Application, 30(1), 21–30. https://doi.org/10.1002/col.20070
W3C (2023). Web Content Accessibility Guidelines (WCAG) 2.2. W3C Recommendation. https://www.w3.org/TR/WCAG22/
MIT licensed.
1 maintainer

Metadata
1 maintainer
Release files for disability-access-charts 0.4.0
For a detailed explanation of source distributions (sdists) and built distributions (wheels), please see the package formats documentation.
Source distribution (sdist)
| File | Size | Uploaded | Provenance | Actions |
|---|---|---|---|---|
| disability_access_charts-0.4.0.tar.gz | 220.7 kB | With provenance | Details for disability_access_charts-0.4.0.tar.gz |
Built distribution (wheel)
| File | Interpreter | ABI | Platform | Actions Reset |
|---|---|---|---|---|
| disability_access_charts-0.4.0-py3-none-any.whl | Python 3 | none | any | Details for disability_access_charts-0.4.0-py3-none-any.whl |
Total release size: 350.4 kB
Release files / disability_access_charts-0.4.0.tar.gz
| Download URL | disability_access_charts-0.4.0.tar.gz |
|---|---|
| Size | 220.7 kB |
| Tags | Source |
|
SHA-256 checksum How to use checksums |
c9f477425a124f0634962aa568b93336ee7bb17a365bacda784df018b2d84fce
|
|
BLAKE2b-256 checksum How to use checksums |
66836f1a875296d661ef70346df12c78a72939aaf5121b88f7466ff7b9e00b32
|
| Upload date | |
|
Uploaded using Trusted Publishing? What is trusted publishing? |
Yes |
| Uploaded via |
twine/7.0.0 CPython/3.13.16
|
Provenance
Provenance describes where a file came from. On PyPI, provenance is shared via attestations, which provide a verifiable record of the build or publishing details. View details, limitations and caveats.


PyPI Publish Attestation
PyPI verified that this artifact, at this checksum, originated from the publisher listed below.
Signed by GitHub Actions, verified by PyPI on Nov 6, 2026.
Transparency logRelease files / disability_access_charts-0.4.0-py3-none-any.whl
| Download URL | disability_access_charts-0.4.0-py3-none-any.whl |
|---|---|
| Size | 129.7 kB |
| Tags | Python 3 |
|
SHA-256 checksum How to use checksums |
f7d846e80ec3cf551fc57867e91aeedd3c6e6e729482708fdb2077206dd69808
|
|
BLAKE2b-256 checksum How to use checksums |
8542e78e241b03b49ed55cb71de0910fbf52ef52063c3be54582bdb13bcc8904
|
| Upload date | |
|
Uploaded using Trusted Publishing? What is trusted publishing? |
Yes |
| Uploaded via |
twine/7.0.0 CPython/3.13.16
|
Provenance
Provenance describes where a file came from. On PyPI, provenance is shared via attestations, which provide a verifiable record of the build or publishing details. View details, limitations and caveats.
PyPI Publish Attestation
PyPI verified that this artifact, at this checksum, originated from the publisher listed below.
Signed by GitHub Actions, verified by PyPI on Nov 6, 2026.
Transparency logSecurity for disability-access-charts 0.4.0
Provenance
Provenance describes where a file came from. On PyPI, provenance is shared via attestations, which provide a verifiable record of the build or publishing details. View details, limitations and caveats.
Full provenance
Both files in this release have been uploaded with provenance metadata.
Attestation for disability_access_charts-0.4.0.tar.gz
PyPI Publish Attestation
PyPI verified that this artifact, at this checksum, originated from the publisher listed below.
Signed by GitHub Actions, verified by PyPI on Nov 6, 2026.
Transparency logA note on package security
PyPI is a repository for distributing packages, not a service for auditing them. While third-party security researchers and our staff do their best to detect and remove malicious packages, PyPI cannot guarantee the quality, security or suitability of any given package.
To learn more about protecting yourself from malicious actors, visit our package security documentation.














