
disability-access-charts
Charts that check their own words.
Built for Curb Cut, an accessible platform for Nigerian disability data. Every chart ships with alt-text built from its data, and the library then checks that text against the data: every number, and every comparison it recognises ("highest", "higher than", "twice", "ranked 3rd"). With survey estimates, it tests whether the confidence intervals actually support the claim. The same checker gates any LLM rewording and runs on any Plotly figure in CI.
Status: 0.1 (alpha). English only, built so other languages can be added.
pip install disability-access-charts            # core: no dependencies
pip install "disability-access-charts[plotly]"  # adds Plotly Figure support
What it looks like
Every chart comes in a light and a dark theme, both contrast-checked:
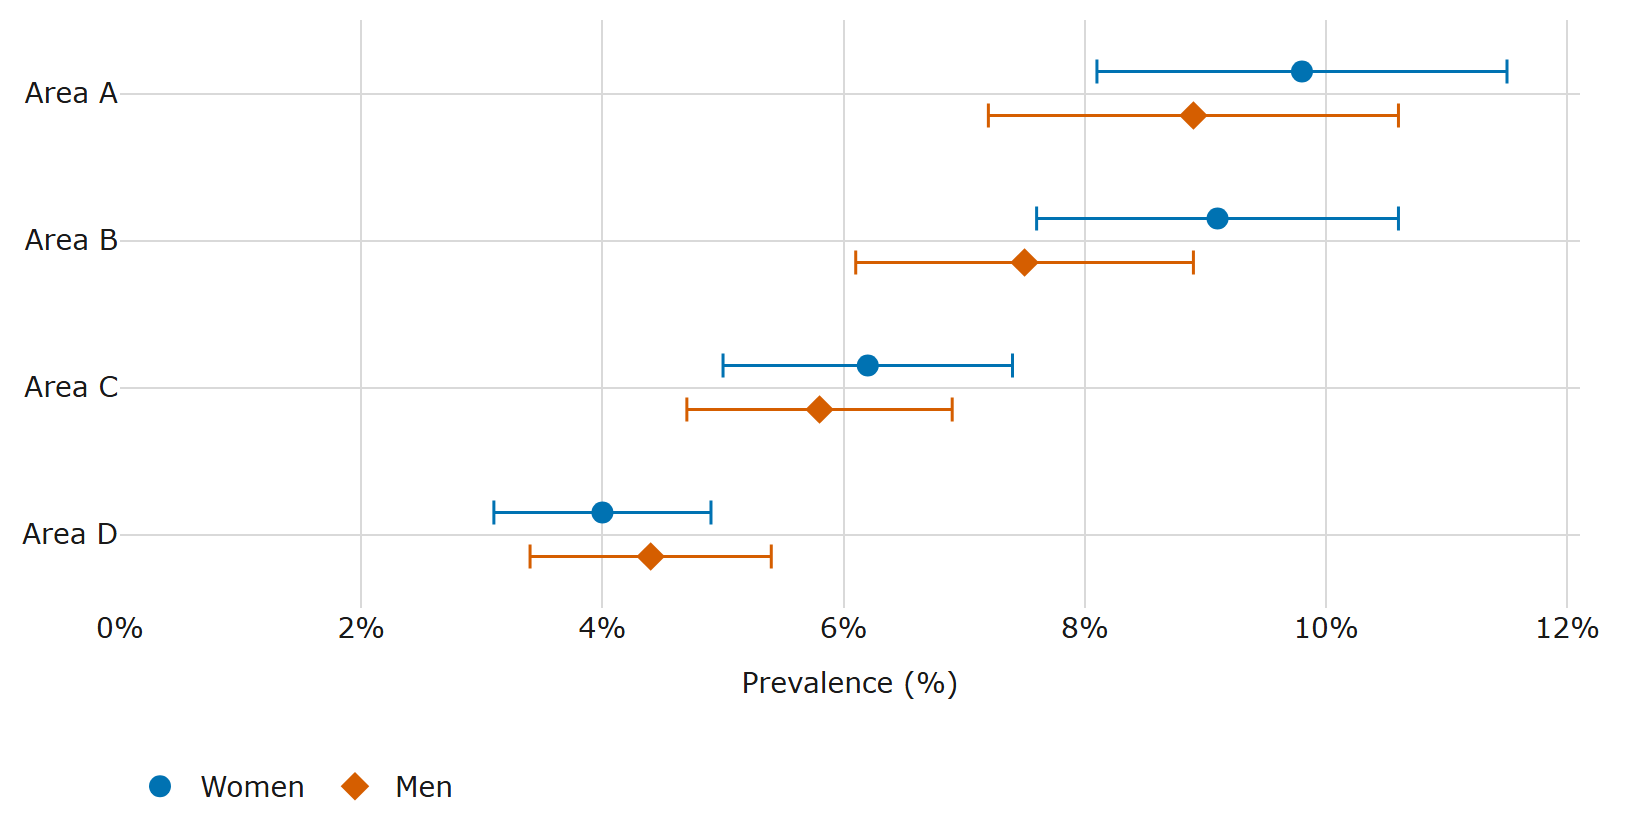
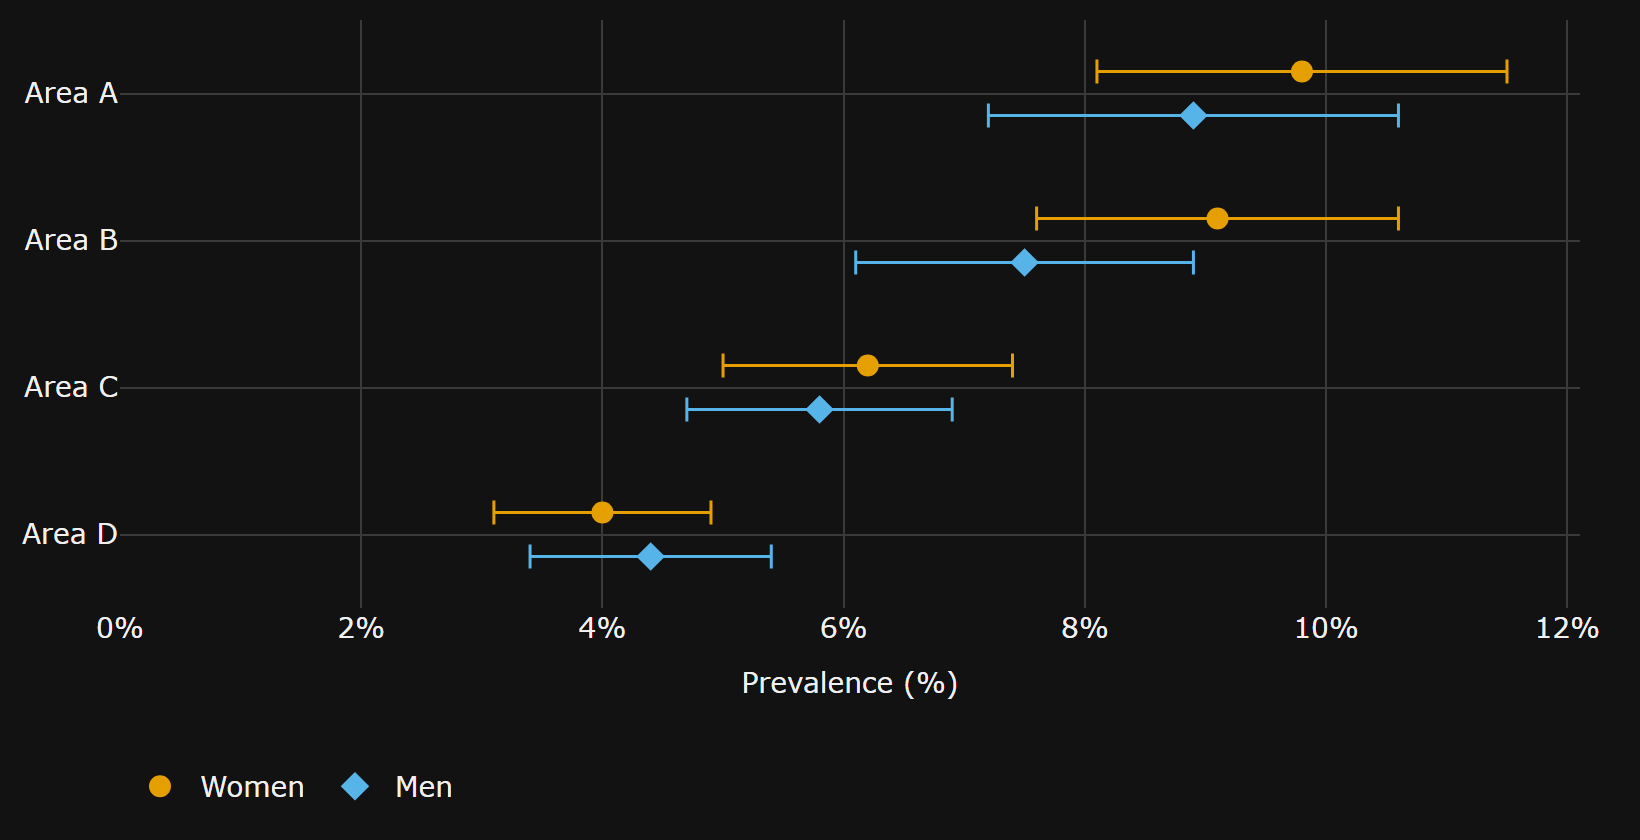
The description the library wrote for this chart (synthetic data), shortened here:
Women: highest estimate Area A, 9.8%, and the survey cannot show a difference from the next estimate, Area B, 9.1%; lowest estimate Area D, 4.0%, and the survey can show a difference from the next estimate, Area C, 6.2%. …
So "Area A is the highest" is never written, and if someone writes it, the checker rejects it:
from disability_access_charts import ChartData, Series, check_alt_text, dot

areas = ["Area A", "Area B", "Area D"]
women = Series(
    "Women",
    values=(9.8, 9.1, 4.0),
    lower=(8.1, 7.6, 3.1),  # 95% confidence interval
    upper=(11.5, 10.6, 4.9),
)

doc = dot(
    areas,
    [women],
    title="ILLUSTRATIVE ONLY: synthetic prevalence (not real data)",
    value_label="Prevalence (%)",
    category_label="Area",
    source="Synthetic",
    unit="percent",
)
data = ChartData.from_dict(doc["data"])

check_alt_text("Area A is higher than Area D.", data)  # [] : the difference is supported
check_alt_text("Area A is higher than Area B.", data)
# [Problem(..., kind='comparison', severity='error',
#   reason='the survey cannot show that Area A is higher than Area B: the difference 0.70
#           is not more than 2.27', suggestion='the survey cannot show a difference')]
What you get
bar() and dot() return one JSON document per chart, with no Plotly import needed:
| key | what it holds |
|---|---|
plotly |
a static Plotly.js spec: no hover-only data, no zoom or pan |
alt_text |
the description, built from the data, summary first |
table |
the same numbers as an accessible table |
data |
the numbers the checker reads (categories, series, intervals) |
themes |
light and dark colours, contrast-checked (WCAG 2.2 SC 1.4.3, 1.4.11) |
keyboard |
how a keyboard user reaches the data (the table) |
audit |
every check, each with a WCAG criterion and a severity |
meta |
generator, library version, source, alt-text language and origin |
Also: audit(fig) for a document or any Plotly figure, theme(fig, "dark"), to_html(doc) and to_csv(doc), figure(doc) for a Plotly Figure, and a CLI for CI:
disability-access-charts check charts/*.json            # exit 1 if any chart fails
disability-access-charts check --strict charts/*.json   # warnings fail too
What the checker checks
- Numbers: each must be a figure of the category it sits next to (value, interval bound or share), so "Kano, 11.9%" fails if 11.9% is Lagos's.
- Extremes: largest, highest, smallest, lowest.
- Comparisons: higher, lower, more, fewer than, including lists ("higher than Lagos and Abuja").
- Ratios: twice, half, N times, within 5%.
- Ranks: "ranked 2 of 37", "3rd", "the second-highest".
- "No difference" always fails: a survey can't show that two groups are equal.
With confidence intervals, "A is higher than B" passes only if the difference is larger than 1.96 times its standard error, worked out from the two intervals. This assumes roughly symmetric intervals and independent groups, and applies no correction for multiple comparisons; it warns when groups may not be independent. "A is the highest" must be separated from every other group; otherwise write "A has the highest estimate".
What a pass means: no recognised claim was found false. It does not make a description true or complete.
Limits. Negated claims ("not higher"), words it doesn't know ("exceeds", "similar"), and numbers written as words get a warning, not a check. Differences written as numbers ("3 points higher"), comparisons with a stated number ("above 10%"), trends and causes are not understood. The full rules are in the claim checker reference.
LLM polish (optional)
polish_alt_text(doc, disclosure_checked=True) asks Gemini, then Groq, to reword the alt-text. A rewording is kept only if the checker finds no errors or warnings in it and it keeps every category, number, interval label and the source; otherwise the data-built text stays. It sends only the chart's aggregates, title and source. Pass only disclosure-checked public aggregates, never microdata. Results are cached in .disability_access_charts_cache/, and the tests never call the network.
More
- Languages: one table of templates and claim words per language (
_lang/en.py); only English ships in 0.1. Numbers stay as digits in every language, so the checker still works. - Python: 3.10 or later. Tests and CI run on 3.12; 3.10 is checked by installing the wheel and running the examples.
- Examples (in the source distribution and the repository's
examples/): JONAPWD's 2025 assumed figures by disability type (a WHO 15% benchmark applied to population, not survey estimates), a synthetic dot plot with intervals, and an audit of a plain Plotly figure. The installed package holds no data.
How it compares
We found no other library that checks the comparative claims in a chart description against its data. The closest work we found is AggChecker (Jo et al., VLDB 2019), a research system that checks claims against a database rather than charts.
- a11yviz has WCAG-tagged palettes, alt-text scaffolds and audits for plotnine, plotly and Quarto.
- maidr makes charts explorable by keyboard, with sound, braille and text descriptions.
Use maidr for multimodal exploration. Use this library to catch numbers and comparisons in a description that contradict the data.
MIT licensed.
1 maintainer

Metadata
1 maintainer
Release files for disability-access-charts 0.1.0
For a detailed explanation of source distributions (sdists) and built distributions (wheels), please see the package formats documentation.
Source distribution (sdist)
| File | Size | Uploaded | Provenance | Actions |
|---|---|---|---|---|
| disability_access_charts-0.1.0.tar.gz | 120.2 kB | With provenance | Details for disability_access_charts-0.1.0.tar.gz |
Built distribution (wheel)
| File | Interpreter | ABI | Platform | Actions Reset |
|---|---|---|---|---|
| disability_access_charts-0.1.0-py3-none-any.whl | Python 3 | none | any | Details for disability_access_charts-0.1.0-py3-none-any.whl |
Total release size: 179.2 kB
Release files / disability_access_charts-0.1.0.tar.gz
| Download URL | disability_access_charts-0.1.0.tar.gz |
|---|---|
| Size | 120.2 kB |
| Tags | Source |
|
SHA-256 checksum How to use checksums |
29b8459519d68b9f423a77d04866d3ee60bb537ccea8d3413256317b9602e7af
|
|
BLAKE2b-256 checksum How to use checksums |
35bb16c7872cb6d54d37dd805a45d88bca4f345b42de8aa241e39bd76c0d9c89
|
| Upload date | |
|
Uploaded using Trusted Publishing? What is trusted publishing? |
Yes |
| Uploaded via |
twine/7.0.0 CPython/3.13.16
|
Provenance
Provenance describes where a file came from. On PyPI, provenance is shared via attestations, which provide a verifiable record of the build or publishing details. View details, limitations and caveats.


PyPI Publish Attestation
PyPI verified that this artifact, at this checksum, originated from the publisher listed below.
Signed by GitHub Actions, verified by PyPI on Oct 22, 2026.
Transparency logRelease files / disability_access_charts-0.1.0-py3-none-any.whl
| Download URL | disability_access_charts-0.1.0-py3-none-any.whl |
|---|---|
| Size | 59.0 kB |
| Tags | Python 3 |
|
SHA-256 checksum How to use checksums |
ab78868af30a5e333f4e2350043ee61bea1c0bc7d553e574452ce2847959f179
|
|
BLAKE2b-256 checksum How to use checksums |
de49648f7dabc2be882e44d29448fb803ff7053643658dac79f5b7cdad8433b3
|
| Upload date | |
|
Uploaded using Trusted Publishing? What is trusted publishing? |
Yes |
| Uploaded via |
twine/7.0.0 CPython/3.13.16
|
Provenance
Provenance describes where a file came from. On PyPI, provenance is shared via attestations, which provide a verifiable record of the build or publishing details. View details, limitations and caveats.
PyPI Publish Attestation
PyPI verified that this artifact, at this checksum, originated from the publisher listed below.
Signed by GitHub Actions, verified by PyPI on Oct 22, 2026.
Transparency logSecurity for disability-access-charts 0.1.0
Provenance
Provenance describes where a file came from. On PyPI, provenance is shared via attestations, which provide a verifiable record of the build or publishing details. View details, limitations and caveats.
Full provenance
Both files in this release have been uploaded with provenance metadata.
Attestation for disability_access_charts-0.1.0.tar.gz
PyPI Publish Attestation
PyPI verified that this artifact, at this checksum, originated from the publisher listed below.
Signed by GitHub Actions, verified by PyPI on Oct 22, 2026.
Transparency logA note on package security
PyPI is a repository for distributing packages, not a service for auditing them. While third-party security researchers and our staff do their best to detect and remove malicious packages, PyPI cannot guarantee the quality, security or suitability of any given package.
To learn more about protecting yourself from malicious actors, visit our package security documentation.














