
Distortions
The distortions package gives functions to compute and visualize the
distortions that are introduced by nonlinear dimensionality reduction
algorithms. It is designed to wrap arbitrary embedding methods and builds on the
distortion estimation routines from the megaman
package. The resulting visualizations can let
you interactively query properties that are not well preserved by the embedding.
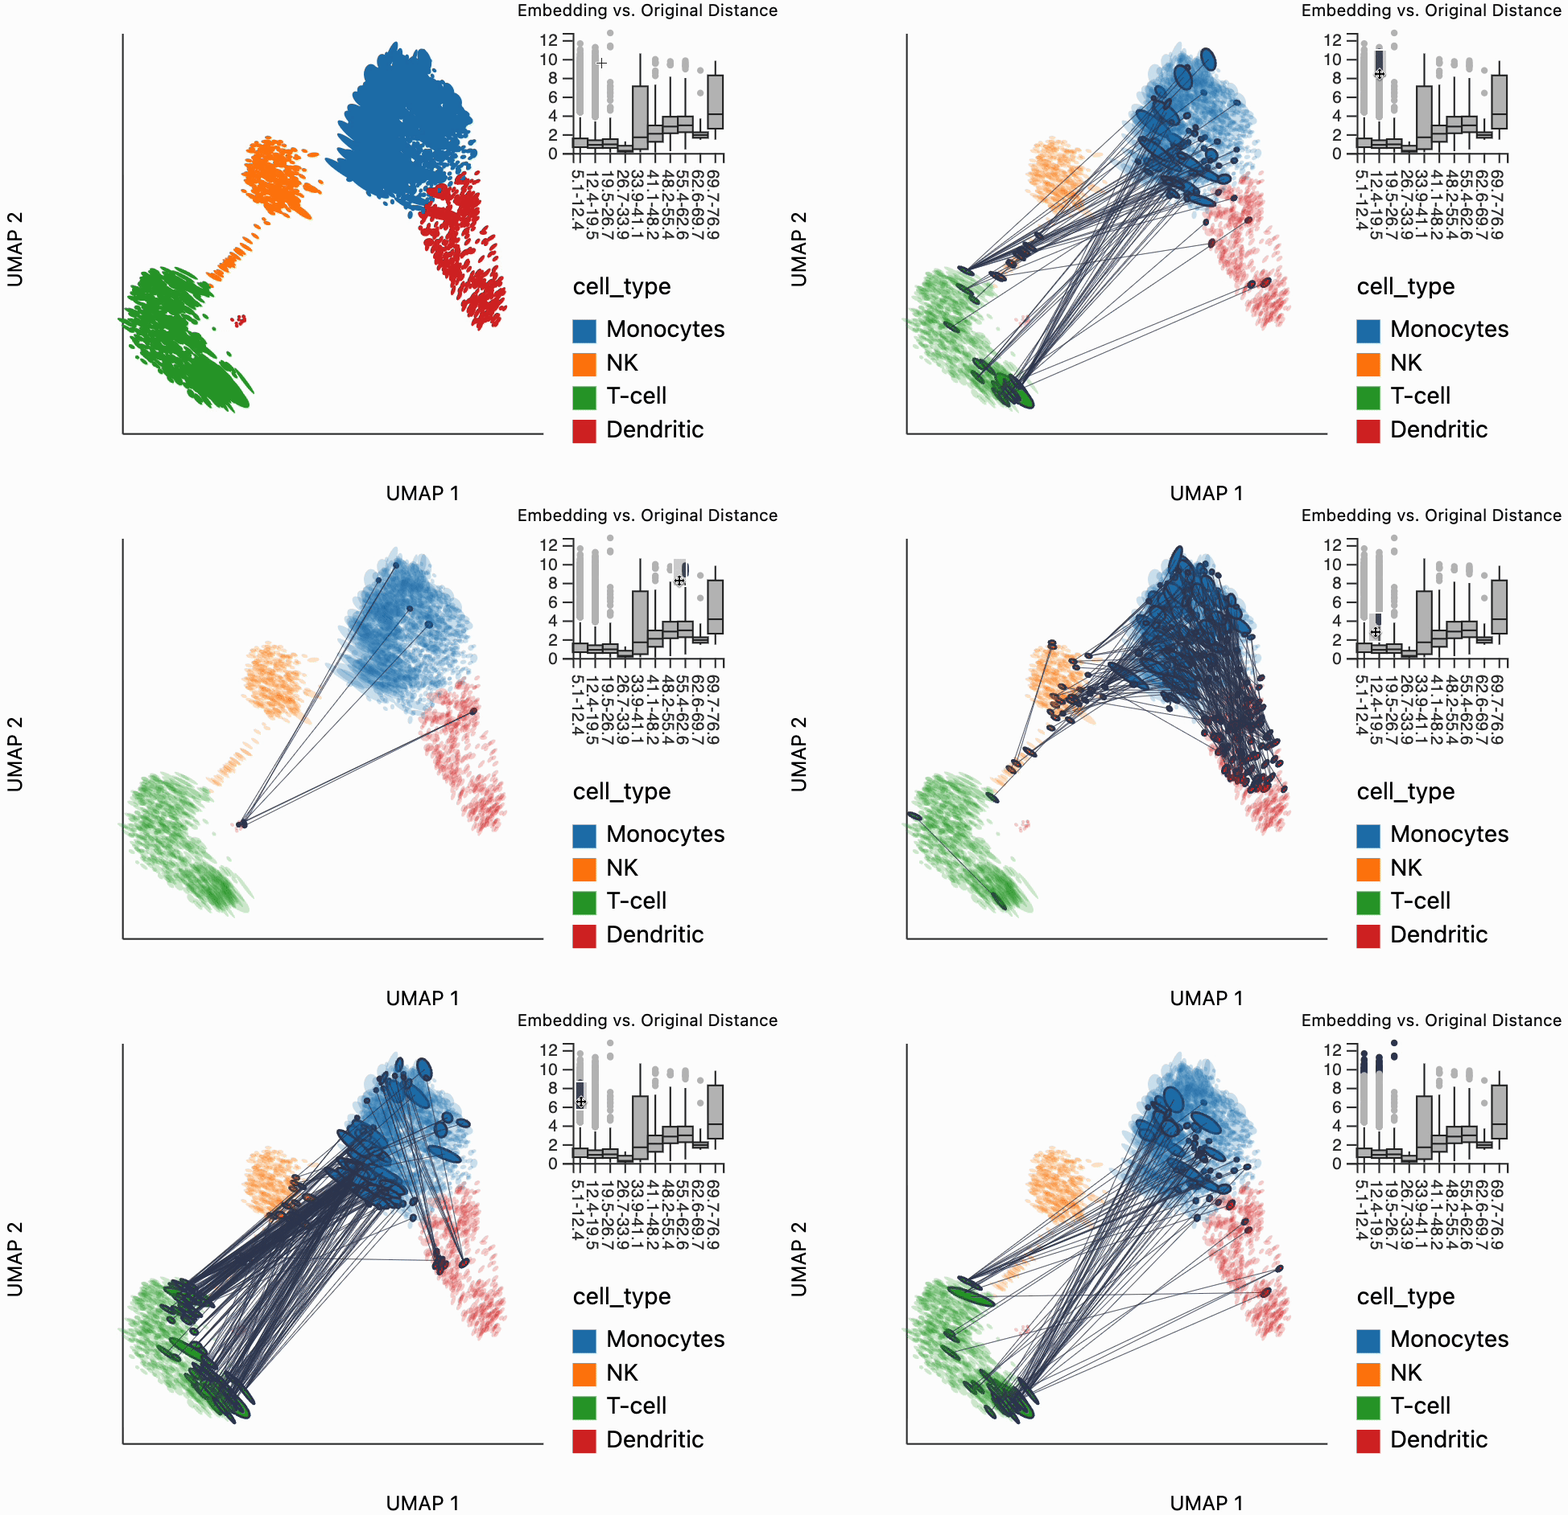
For example, the image below shows us selecting distances that are larger in the
embedding space compared to the original data space. This allows us to describe
the large-scale distortions induced by the embedding. For example, we can that
some of the T cells have many neighbors with monocytes (to run this yourself,
see the PBMC Atlas article).
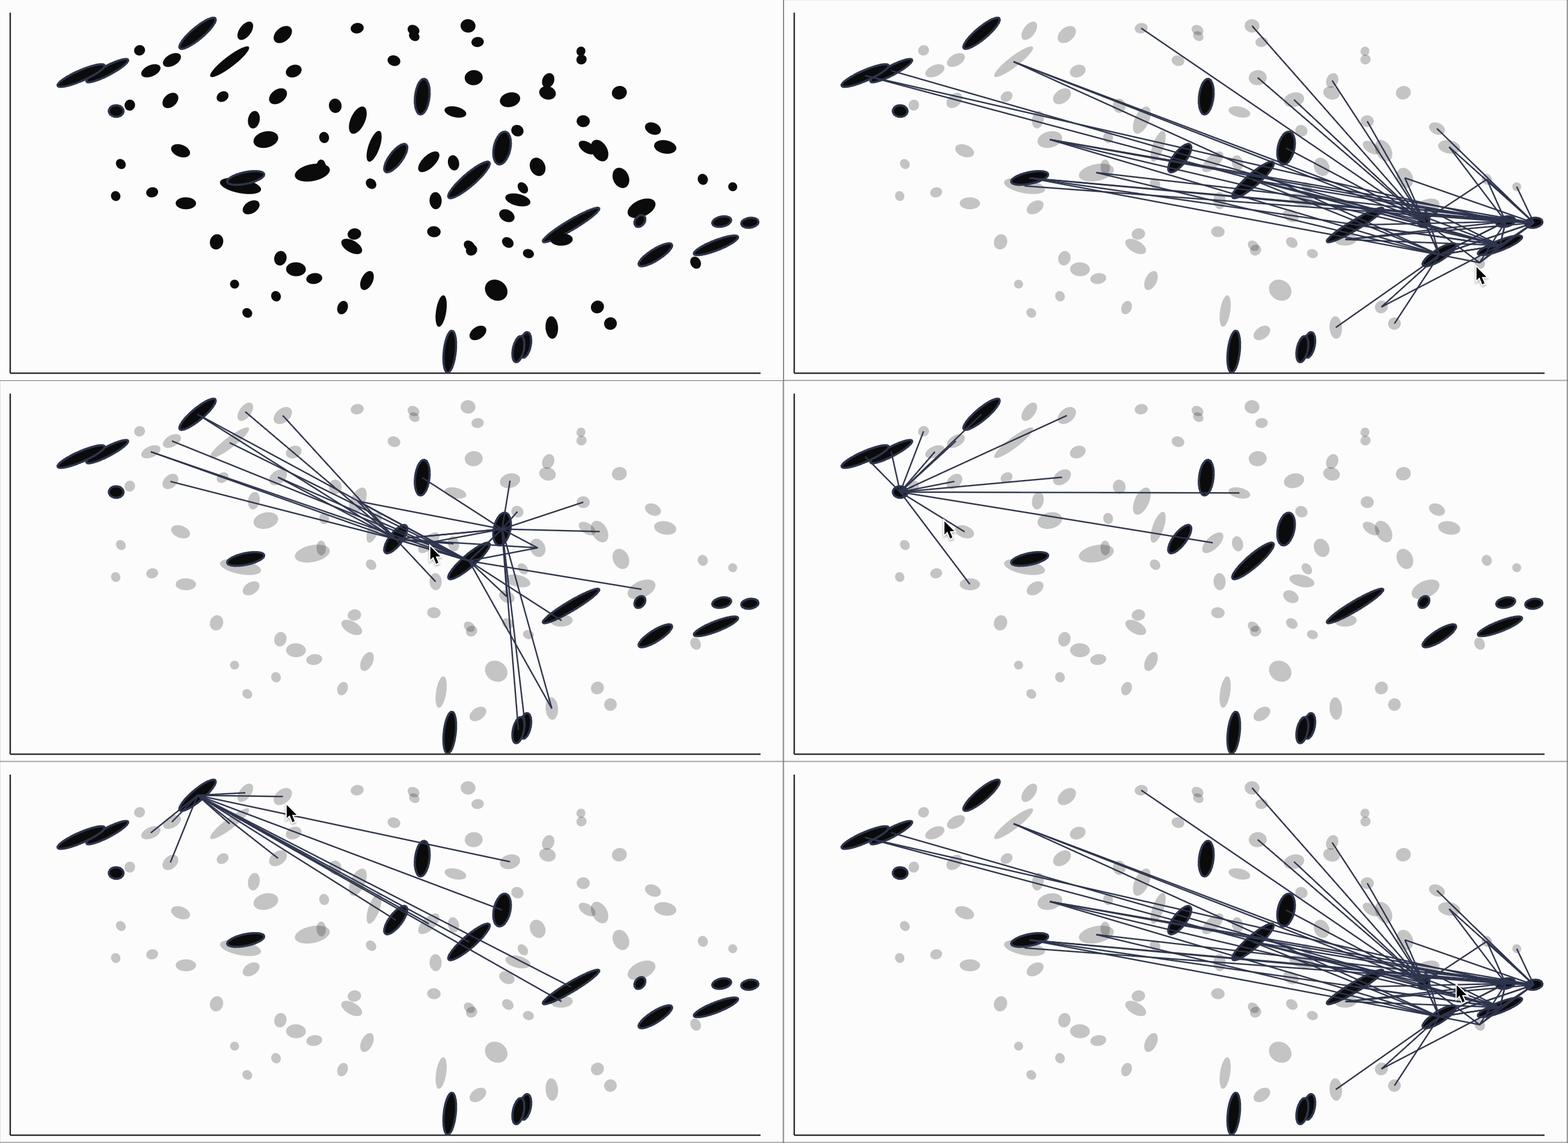
Alternatively, we can study how the embedding warps distances more locally. Each ellipse in the figure below represents the way in which distances in the original data manifold are warped. By hovering over different regions of the map, we invert the warping in the region surrounding the mouse. For example, this shows that the T cells near the top and bottom of the T cell cluster are in fact more distant from each othoer than the static embedding would suggest.

Quickstart
You can install the package using:
python -m pip install distortions
Here's a small example on a UMAP applied to a simulated AnnData object. First
we generate some random data and embeddings.
import anndata as ad
import scanpy as sc
import numpy as np

adata = ad.AnnData(np.random.poisson(2, size=(100, 5)))
sc.pp.neighbors(adata, n_neighbors=15)
sc.tl.umap(adata)
Next we estimate the local distortions and bind the relevant ellipse information
to our embeddings. The Geometry object comes from the megaman package and
gives ways of representing the intrinsic geometry of a manifold.
from distortions.geometry import Geometry, bind_metric, local_distortions, neighborhoods

geom = Geometry(affinity_kwds={"radius": 2}, adjacency_kwds={"n_neighbors": 15})
_, Hvv, Hs = local_distortions(adata.obsm["X_umap"], adata.X, geom)
embedding = bind_metric(adata.obsm["X_umap"], Hvv, Hs)
Now we can make the visualization.
from distortions.visualization import dplot

N = neighborhoods(adata, 1)
dplot(embedding)\
    .mapping(x="embedding_0", y="embedding_1")\
    .inter_edge_link(N=N)\
    .geom_ellipse()
At a high level, the main functions exported by this package are:
local_distortions: Estimate the local distortion associated with each sample.neighborhoods: Identify neighborhoods that have been fragmented by the embedding method. These are sets of points that had been close together in the original space but which are spread far apart in the embedding.dplot: Initialize a distortion plot object. Different encodings and interactions can be layered on top of this initial call.
Each dplot object has a few static (geom) and interactive (inter) layers
that we can then assemble to create a distortion plot.
geom_ellipse: Draw an ellipse layer that encodes the local distortion associated with each sample.geom_hair: Draw an line segment layer that encodes the local distortion associated with each sample. It's visually more compact thangeom_ellipse, at the cost of only showing the ratio between ellipse axes lengths.inter_isometry: Interactively isometrize from the region surrounding the mouse. This reduces the distortion around the mouse position, at the potential cost of increasing distortion globally.inter_edge_link: Highlight distorted neighborhoods. This expects the output ofneighborhoodsas input. Hovering over one distorted neighborhood reveals all the edges that it's made up of.inter_boxplot: Allow selection of outlying edges which have either much larger or smaller embedding distance relative to their original distance.
The full function reference can be found here. You can find more realistic examples applying the package in the articles listed at the side of this page.
Help
You can reach us by creating an Issue in the package repository or sending an email to ksankaran@wisc.edu. We appreciate your trying out the package and will try our best to reply promptly.
1 maintainer

Metadata
1 maintainer
Release files for distortions 0.0.5
For a detailed explanation of source distributions (sdists) and built distributions (wheels), please see the package formats documentation.
Source distribution (sdist)
| File | Size | Uploaded | |
|---|---|---|---|
| distortions-0.0.5.tar.gz | 2.7 MB | Details |
Built distribution (wheel)
| File | Interpreter | ABI | Platform | Reset |
|---|---|---|---|---|
| distortions-0.0.5-py3-none-any.whl | Python 3 | none | any | Details |
Total release size: 2.8 MB
Release files / distortions-0.0.5.tar.gz
| Download URL | distortions-0.0.5.tar.gz |
|---|---|
| Size | 2.7 MB |
| Tags | Source |
|
SHA-256 checksum How to use checksums |
12c03fab5243f92e3acdb7ce26aae89daf2b8b81da572b7191483f6572fe6f5b
|
|
BLAKE2b-256 checksum How to use checksums |
ef3ba70337e56bb25b4f6d64556b6efe1467ab4a70f11bb640210978c07c3b33
|
| Upload date | |
|
Uploaded using Trusted Publishing? What is trusted publishing? |
No |
| Uploaded via |
twine/6.1.0 CPython/3.12.2
|
Release files / distortions-0.0.5-py3-none-any.whl
| Download URL | distortions-0.0.5-py3-none-any.whl |
|---|---|
| Size | 113.1 kB |
| Tags | Python 3 |
|
SHA-256 checksum How to use checksums |
20a180109418f48e770371a2efffd3b6e61427459f120dcc2d9d5ab19f70d1d6
|
|
BLAKE2b-256 checksum How to use checksums |
5066a11c10fc1e457294d88a4a552247a043b523aac6858a73e86fcae0ad6e18
|
| Upload date | |
|
Uploaded using Trusted Publishing? What is trusted publishing? |
No |
| Uploaded via |
twine/6.1.0 CPython/3.12.2
|














