Django Chart.js and Hightchart ajax views


Project description
Django Chartjs lets you manage charts in your Django application.


This is compatible with Chart.js and Highcharts JS librairies.
Using a set of predefined Class Based Views you are able to get started after writing just your SQL query.
Authors: Rémy Hubscher and contributors
Licence: BSD
Compatibility: Django 1.5+, python2.7 up to python3.3
Project URL: https://github.com/novagile/django-chartjs
Getting Started
Install django-chartjs:
pip install django-chartjs
Add it to your INSTALLED_APPS settings:
INSTALLED_APPS = (
    '...',
    'chartjs',
)
Using it
A simple Line Chart example.
1. Create the HTML file
{% load staticfiles %}
<html>
<head>
<title>django-chartjs line chart demo</title>
<!--[if lte IE 8]>
<script src="{% static 'js/excanvas.js' %}"></script>
<![endif]-->
</head>
<body>
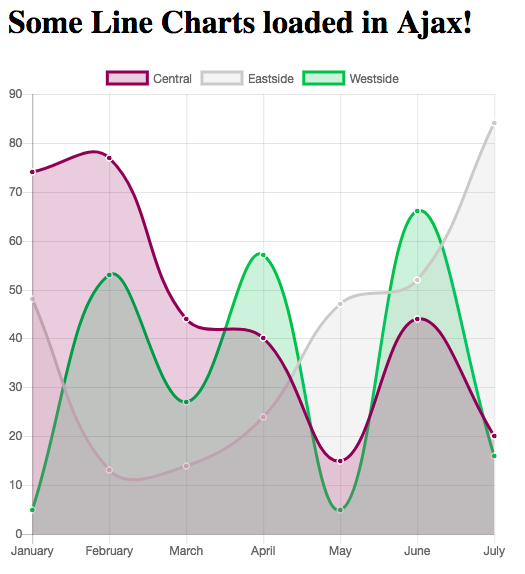
<h1>Some Line Charts loaded in Ajax!</h1>
<canvas id="myChart" width="500" height="400"></canvas>
<script type="text/javascript" src="http://code.jquery.com/jquery-1.10.0.min.js"></script>
<script type="text/javascript" src="{% static 'js/Chart.min.js' %}"></script>
<script type="text/javascript">
$.get('{% url "line_chart_json" %}', function(data) {
var ctx = $("#myChart").get(0).getContext("2d");
new Chart(ctx).Line(data);
});
</script>
</body>
</html>2. Create the view with labels and data definition
from random import randint
from django.views.generic import TemplateView
from chartjs.views.lines import BaseLineChartView


class LineChartJSONView(BaseLineChartView):
    def get_labels(self):
        """Return 7 labels."""
        return ["January", "February", "March", "April", "May", "June", "July"]

    def get_data(self):
        """Return 3 datasets to plot."""

        return [[75, 44, 92, 11, 44, 95, 35],
                [41, 92, 18, 3, 73, 87, 92],
                [87, 21, 94, 3, 90, 13, 65]]


line_chart = TemplateView.as_view(template_name='line_chart.html')
line_chart_json = LineChartJSONView.as_view()
3. Get a Chart.js Line Chart
It is that simple!
For other examples, don’t hesitate to look at the demo project.
Also, feel free to contribute your demo!
Release history Release notifications | RSS feed


Download files
Download the file for your platform. If you're not sure which to choose, learn more about installing packages.
Source Distribution
File details
Details for the file django-chartjs-1.1.tar.gz.
File metadata
- Download URL: django-chartjs-1.1.tar.gz
- Upload date:
- Size: 534.4 kB
- Tags: Source
- Uploaded using Trusted Publishing? No
File hashes
| Algorithm | Hash digest | |
|---|---|---|
| SHA256 |
ccb6333677d3fec9a00ed19afbb5f4b4b89b779a08bf90bba12eeab4a0e4b130
|
|
| MD5 |
370b995113e6c32df9c685db892c9312
|
|
| BLAKE2b-256 |
7f8c269f53d314b06c70bdc27ec530ea727c2ef9879954110e34934668094284
|


