
Django admin log viewer supporting MongoDB and SQL databases.
Verified details
These details have been verified by PyPIProject links
GitHub Statistics
Maintainers

Project description
django-log-panel

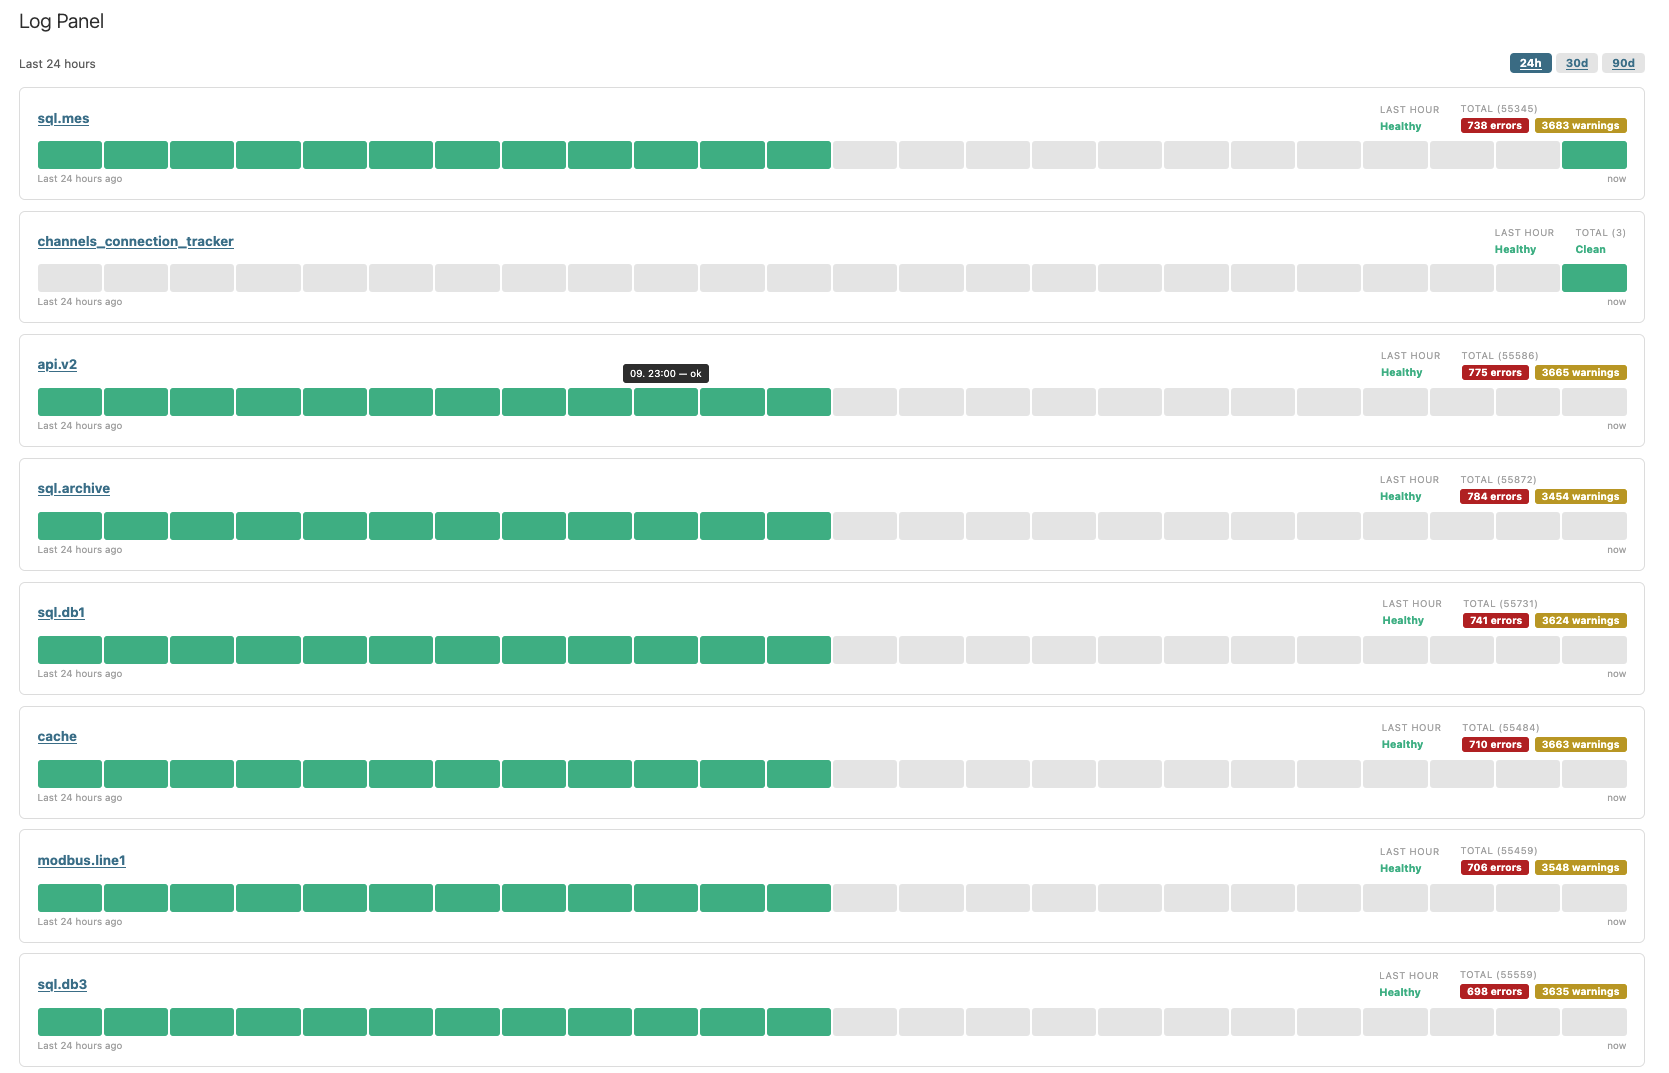
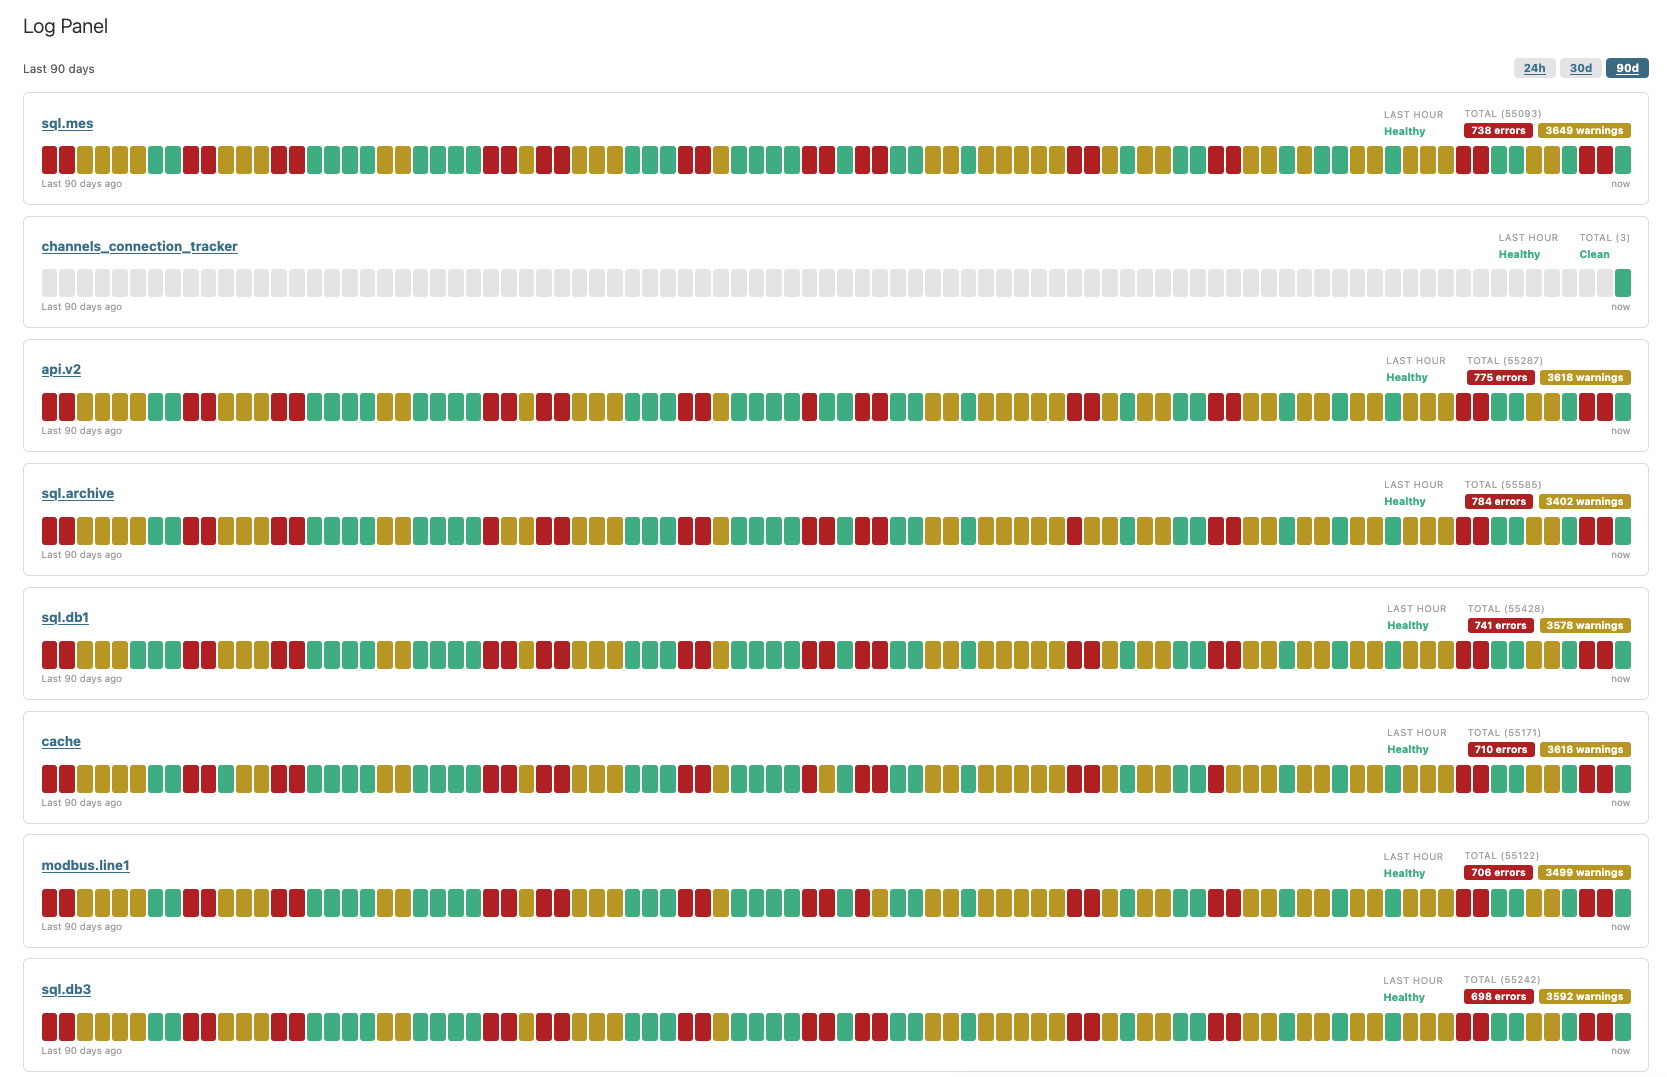
django-log-panel collects logs from any logger configured in Django's standard LOGGING setting and displays them on a dashboard inspired by a status page. Each logger gets its own health card showing error and warning counts, a color-coded activity timeline, and a drilldown into searchable, filterable log entries - all inside Django admin, with no separate service to run.
For alerting, it emits a Django signal when a logger crosses a configured threshold, leaving the response - email, Slack, webhook - entirely to the application.
Screenshots
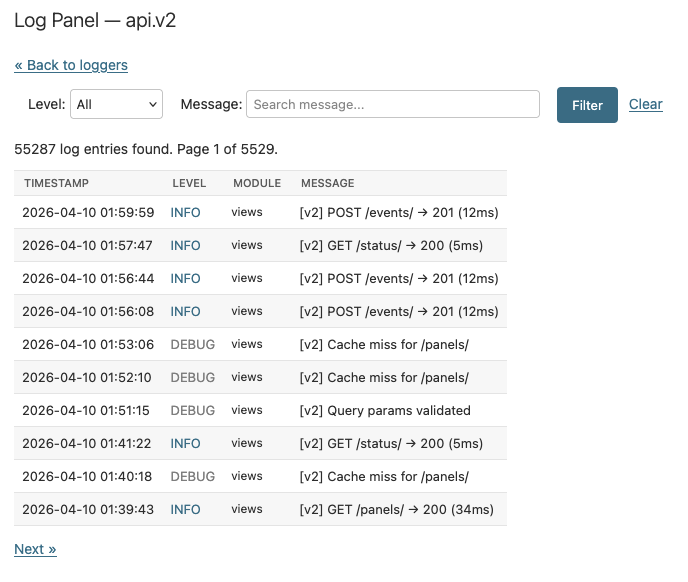
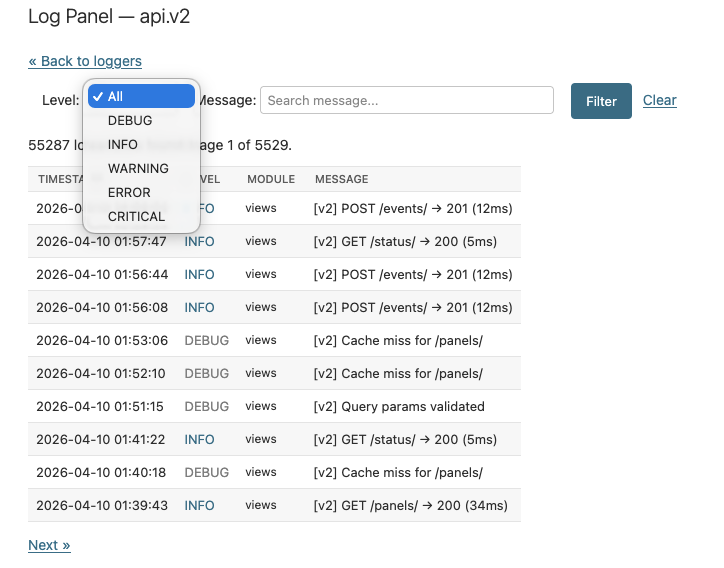
The dashboard shows one card per logger. Clicking a card opens a paginated table of log entries with level filtering and message search.
Supports two storage backends:
- MongoDB - write-heavy, append-only logging with automatic TTL-based retention.
- SQL - logs stored in any Django-supported relational database via the
Panelmodel.
Key Features
- Status-page dashboard in Django admin - a health card per logger showing total errors, warnings, and recent issues from the last hour, all without a separate service to run.
- Color-coded activity timeline - each card includes a visual timeline strip across configurable time ranges (e.g. last 24h, 30d, 90d).
- Searchable, filterable log table - click any card to open a paginated list of log entries with level filtering and free-text message search.
- Two storage backends - write logs to MongoDB (append-only, automatic TTL-based cleanup) or any Django-supported SQL database.
- Threshold alerting via Django signals - emits a signal when a logger crosses a configured per-level count within a rolling one-hour window, leaving the response entirely to the application.
- Customisable log level colors - configure hex colors for any log level badge, including custom Python log levels, which are automatically added to the filter dropdown.
- Configurable timeline ranges - define your own time range slots to match how you think about your traffic patterns.
- Configurable alert thresholds - set per-level count thresholds before the signal fires, or disable alerting for specific levels entirely.
- Configurable page title and table size - customise the panel heading and how many rows appear per page in the log detail view.
- Flexible access control - restrict the panel to specific users or groups via a permission callback, beyond the default Django staff check.
- High-volume buffering support - optionally wrap handlers with Python's built-in
MemoryHandlerfor batch writes on busy applications. - Configurable data retention - automatic TTL expiry for MongoDB; a management command with dry-run and batch options for SQL.
Requirements
- Python ≥ 3.12
- Django ≥ 5.2
pymongo == 4.16.0(only required for MongoDB backend)
Installation
# with uv
uv add django-log-panel

# with pip
pip install django-log-panel
For MongoDB support, install the optional extra:
# with uv
uv add "django-log-panel[mongodb]"

# with pip
pip install "django-log-panel[mongodb]"
Local Development
If you want to work on a local checkout, install uv from the official docs.
With uv
cd `Project directory`
uv venv --python=3.13
uv sync --group dev
uv run pytest
Linting & typing
cd `Project directory`
uv run ruff check
uv run ruff format
uv run ty check
Quick Start
1. Add to INSTALLED_APPS:
INSTALLED_APPS = [
    ...
    "log_panel",
]
2. Configure a backend (see MongoDB Setup or SQL Setup below).
3. Add a handler to Django LOGGING (see the relevant setup section).
4. Open Django admin and go to Application Logs, or navigate to:
/admin/log_panel/panel/
How Backend Resolution Works
The admin UI reads data through log_panel.conf.get_backend().
The backend is resolved in this order:
LOG_PANEL["BACKEND"]- if you explicitly provide a backend class path.- SQL backend - if
LOG_PANEL["DATABASE_ALIAS"]is set. - MongoDB backend - if
LOG_PANEL["CONNECTION_STRING"]is set. - No backend - admin shows an unconfigured state.
Note: LOG_PANEL controls how the admin reads logs. Django LOGGING handlers control where log records are written.
MongoDB Setup
Use this when you want cheap append-only logging with automatic TTL-based retention.
Settings
LOG_PANEL = {
    "CONNECTION_STRING": "mongodb://localhost:27017",
    "DB_NAME": "myapp_logs",
    "COLLECTION": "logs",
    "TTL_DAYS": 90,
}
Django LOGGING Configuration
LOGGING = {
    "version": 1,
    "disable_existing_loggers": False,
    "handlers": {
        "log_panel": {
            "class": "log_panel.handlers.MongoDBHandler",
        },
    },
    "root": {
        "handlers": ["log_panel"],
        "level": "INFO",
    },
}
Notes
- Formatters configured in
LOGGINGhave no effect onMongoDBHandler. The message is always stored as the raw log text; structured fields (level,timestamp,module, etc.) are captured directly from the log record. Exception tracebacks are appended automatically when present. MongoDBHandlercreates three indexes automatically on the first write:- A TTL index on
timestampfor automatic record expiry. - A compound index on
(timestamp, logger_name, level)to speed up timeline aggregations (covered index, no document fetch needed). - A compound index on
(logger_name, timestamp DESC)to speed up table-view queries filtered by logger.
- A TTL index on
- MongoDB cleanup runs asynchronously; no Django management command is needed.
LogsRouter.allow_migrate()returnsFalseforlog_panelin MongoDB-only mode, so no SQL migration is needed.- For large collections with long time ranges (e.g. 90 days over millions of records), set
LOG_PANEL["ALLOW_DISK_USE"] = Trueif aggregation queries hit MongoDB's 100 MB in-memory limit.
SQL Setup
Use this when logs must live in a relational database.
Database Configuration
Point LOG_PANEL["DATABASE_ALIAS"] at the database you want to use for log storage:
DATABASES["logs"] = {
    "ENGINE": "django.db.backends.postgresql",
    "NAME": "myapp_logs",
    "USER": "...",
    "PASSWORD": "...",
    "HOST": "...",
    "PORT": "...",
}

DATABASE_ROUTERS = [
    "log_panel.routers.LogsRouter",
]

LOG_PANEL = {
    "DATABASE_ALIAS": "logs",
    "TTL_DAYS": 90,
}
Django LOGGING Configuration
LOGGING = {
    "version": 1,
    "disable_existing_loggers": False,
    "handlers": {
        "log_panel": {
            "class": "log_panel.handlers.DatabaseHandler",
        },
    },
    "root": {
        "handlers": ["log_panel"],
        "level": "INFO",
    },
}
Notes
- Formatters configured in
LOGGINGhave no effect onDatabaseHandler. The message is always stored as the raw log text; structured fields (level,timestamp,module, etc.) are captured directly from the log record. Exception tracebacks are appended automatically when present.
Migration
LogsRouter prevents the migration from running on the wrong database, but Django's migrate command only targets default unless told otherwise. You still need to point it at your alias explicitly:
python manage.py migrate log_panel --database=logs
If your logging alias is default, the normal migration flow is sufficient.
Retention Cleanup
SQL storage does not have automatic TTL cleanup. Use the management command instead:
# Dry run - prints count without deleting
python manage.py delete_old_logs --dry-run

# Delete logs older than 30 days
python manage.py delete_old_logs --days 30

# Custom batch size (default: 1000)
python manage.py delete_old_logs --days 30 --batch-size 5000
See delete_old_logs for full option reference.
Writing Logs
Any Python logger writes into log_panel as long as your Django LOGGING configuration routes to MongoDBHandler or DatabaseHandler.
import logging

logger = logging.getLogger(__name__)

logger.info("Info log")
logger.warning("Warning log")
logger.error("Error log")
logger.critical("Critical log")
Named loggers work the same way:
import logging

sql_logger = logging.getLogger("myapp.sql")
sql_logger.debug("Manual SQL diagnostic message")
High-Volume Logging
By default, both handlers write each record immediately. This is safest - no records are lost on a crash - but one database write per log call can become a bottleneck on busy applications.
Python's standard library includes logging.handlers.MemoryHandler, which buffers records and flushes in two situations:
- The buffer reaches
capacity(number of records). - A record at or above
flushLevelis emitted - high-severity records are never held.
Example - SQL
LOGGING = {
    "handlers": {
        "log_panel_db": {
            "class": "log_panel.handlers.DatabaseHandler",
        },
        "log_panel": {
            "class": "logging.handlers.MemoryHandler",
            "capacity": 50,         # flush after 50 records
            "flushLevel": "ERROR",  # always flush immediately on ERROR or CRITICAL
            "target": "log_panel_db",
        },
    },
    "root": {
        "handlers": ["console", "log_panel"],
        "level": "INFO",
    },
}
Example - MongoDB
LOGGING = {
    "handlers": {
        "log_panel_mongo": {
            "class": "log_panel.handlers.MongoDBHandler",
        },
        "log_panel": {
            "class": "logging.handlers.MemoryHandler",
            "capacity": 100,
            "flushLevel": "ERROR",
            "target": "log_panel_mongo",
        },
    },
}
Trade-offs
| Setting | Effect |
|---|---|
Lower capacity |
Smaller exposure window; more frequent writes |
Higher capacity |
Better throughput; more records at risk on a hard crash |
flushLevel="ERROR" |
Errors always written immediately, regardless of buffer state |
flushLevel="CRITICAL" |
Only critical records bypass buffering |
MemoryHandler flushes on close(), which Django calls during a clean shutdown - normal process termination does not lose buffered records. Only an abrupt crash (OOM kill, power loss) can lose records that have not yet been flushed.
Threshold Alert Signals
django-log-panel emits a Django signal, log_panel.signals.log_threshold_reached, each time a logger crosses a configured count threshold. Connect any receiver to act on it - send an email, post to Slack, call a webhook, or anything else.
How it works
After each log record is written, the handler counts how many records at that level the same logger has emitted in the last rolling hour. When the count exactly matches the configured threshold, log_threshold_reached is dispatched with a ThresholdAlertEvent payload.
Thresholds are configured per log level via LOG_PANEL["THRESHOLDS"]. By default, WARNING, ERROR, and CRITICAL each have a threshold of 1 - the signal fires on the first occurrence of each. Set a level to None to disable it, or raise the value to require more occurrences before the signal fires:
LOG_PANEL = {
    "THRESHOLDS": {
        "CRITICAL": 1,   # fire on first critical
        "ERROR": 10,     # fire after 10 errors in the rolling hour
        "WARNING": None, # no signal for warnings
    }
}
ThresholdAlertEvent fields
| Field | Type | Description |
|---|---|---|
logger_name |
str |
Name of the logger that crossed the threshold |
threshold_level |
LogLevel |
The level that was configured (e.g.ERROR) |
record_level |
LogLevel |
The actual level of the triggering record (e.g.CRITICAL) |
threshold |
int |
The configured count that was reached |
matching_count |
int |
Actual count within the window (equals threshold) |
window_start |
datetime |
Start of the one-hour rolling window (UTC) |
window_end |
datetime |
End of the window - the timestamp of the triggering record (UTC) |
message |
str |
Formatted message of the triggering record |
module |
str |
Module where the record was emitted |
pathname |
str |
Full path of the source file |
line_number |
int |
Line number within the source file |
Connecting a receiver
Define a receiver function and import it during app startup:
# myapp/log_alerts.py
from django.dispatch import receiver

from log_panel.signals import ThresholdAlertEvent, log_threshold_reached


@receiver(log_threshold_reached)
def on_threshold_reached(sender, event: ThresholdAlertEvent, **kwargs):
    ...
Notes
- The signal uses
send_robust- exceptions in receivers are caught and do not affect log writing. - When
DatabaseHandlerorMongoDBHandleris wrapped inlogging.handlers.MemoryHandler, the signal fires when the buffered record is flushed into the real handler, not at the point of the originallogger.error(...)call.
Admin UI
The admin view is optimised for browsing logger health first and raw entries second.
- The landing page shows one card per logger.
- Each card shows total errors, total warnings, recent issues from the last hour, and a color-coded timeline strip.
- Available time ranges are configured through
LOG_PANEL["RANGES"](default: 24h, 30d, 90d). - Clicking a logger opens a paginated table view.
- The table view supports filtering by level and free-text search against the message body.
- Timestamps are displayed in Django's configured default timezone.
Admin URL: /admin/log_panel/panel/
LOG_PANEL Settings Reference
| Setting | Default | Description | Example |
|---|---|---|---|
BACKEND |
None |
Dotted path to a custom backend class. Overrides auto-detection. | "myapp.logging.MyBackend" |
CONNECTION_STRING |
None |
MongoDB connection string. | "mongodb://localhost:27017" |
DB_NAME |
"log_panel" |
MongoDB database name. | "myapp_logs" |
COLLECTION |
"logs" |
MongoDB collection name. | "app_logs" |
TTL_DAYS |
90 |
Retention window in days. | 30 |
SERVER_SELECTION_TIMEOUT_MS |
2000 |
Milliseconds before MongoDBConnectionError is raised. Applies to both MongoDBBackend and MongoDBHandler. |
5000 |
ALLOW_DISK_USE |
False |
Pass allowDiskUse=True to MongoDB aggregation pipelines. Enable this when queries on large collections (millions of records, long time ranges) exceed MongoDB's 100 MB in-memory aggregation limit. MongoDB-only. |
True |
DATABASE_ALIAS |
None |
Explicit SQL database alias for log storage. | "logs" |
TITLE |
"Panel Logs" |
Page title shown in the admin UI. | "Production Logs" |
PAGE_SIZE |
10 |
Rows per page in the detail table. | 25 |
RANGES |
{"24h": ..., "30d": ..., "90d": ...} |
Timeline range definitions for the logger cards. | See Custom RANGES |
THRESHOLDS |
{"WARNING": 1, "ERROR": 1, "CRITICAL": 1} |
Per-level alert thresholds. The log_threshold_reached signal fires when a level's count in the rolling one-hour window hits the configured value. Omit a level to keep its default; set a level to None to disable it. |
{"CRITICAL": 1, "ERROR": 5, "WARNING": None} |
LEVEL_COLORS |
See Log Level Colors | Hex colors for each log level in the admin table view. Merge with defaults - only override the levels you want to change. Custom level names are supported. | {"CRITICAL": "#9b00d3", "MY_AUDIT": "#0055aa"} |
PERMISSION_CALLBACK |
None |
Dotted path to a callable (request: HttpRequest) -> bool that controls who can view the panel. When not set, any active staff user may view it. |
"myapp.utils.superusers_only" |
Log Level Colors
The table view colors each log level badge using the LEVEL_COLORS setting. The defaults map Python's six standard levels:
| Level | Default color |
|---|---|
NOTSET |
#888 (gray) |
DEBUG |
#888 (gray) |
INFO |
#417690 (blue) |
WARNING |
#c0a000 (amber) |
ERROR |
#c47900 (orange) |
CRITICAL |
#ba2121 (red) |
Override individual levels or add entirely custom ones - you do not need to specify the full set:
LOG_PANEL = {
    "LEVEL_COLORS": {
        "CRITICAL": "#9b00d3",
        "MY_AUDIT": "#0055aa",
    },
}
Any level name with no entry in LEVEL_COLORS falls back to gray.
Custom log levels are supported. Register a custom level with Python's logging module, add it to LEVEL_COLORS, and it will automatically appear in the filter dropdown and receive its configured color in the table:
# Register the custom level
import logging
MY_AUDIT = 25
logging.addLevelName(MY_AUDIT, "MY_AUDIT")

# Configure the panel
LOG_PANEL = {
    "LEVEL_COLORS": {
        "MY_AUDIT": "#0055aa",
    },
}
Note: Python's logger.exception() method logs at ERROR level - records stored from it carry level = "ERROR", not "EXCEPTION".
Permissions
By default, any active staff user (is_staff=True) can view the log panel. Use PERMISSION_CALLBACK to restrict access to a specific subset of users:
LOG_PANEL = {
    "PERMISSION_CALLBACK": "myapp.utils.can_view_logs",
}
The callback receives the current HttpRequest and must return True to grant access:
def can_view_logs(request):
    return request.user.is_superuser
# Allow only users in a specific group
def can_view_logs(request):
    return request.user.groups.filter(name="log-viewers").exists()
Custom RANGES
Override the timeline ranges by providing RangeConfig instances or plain dicts:
from datetime import timedelta
from log_panel.types import RangeConfig, RangeUnit

LOG_PANEL = {
    "RANGES": {
        "1h": RangeConfig(
            delta=timedelta(hours=1),
            unit=RangeUnit.HOUR,
            slots=12,
            format="%H:%M",
            label="Last hour",
        ),
        "7d": RangeConfig(
            delta=timedelta(days=7),
            unit=RangeUnit.DAY,
            slots=7,
            format="%b %d",
            label="Last 7 days",
        ),
    },
}
delete_old_logs
Deletes Panel entries older than the configured TTL. Only relevant for the SQL backend - MongoDB uses its built-in TTL index.
python manage.py delete_old_logs [--days DAYS] [--batch-size BATCH_SIZE] [--dry-run]
| Option | Default | Description |
|---|---|---|
--days |
LOG_PANEL["TTL_DAYS"] |
Override the retention window for this run. |
--batch-size |
1000 |
Number of records to delete per batch. Deleting millions of rows in a single query locks the table and spikes I/O. Batching keeps each delete small so the database stays responsive. Increase for faster cleanup on idle systems, decrease if you see lock contention. |
--dry-run |
- | Print how many records would be deleted without deleting them. |
Support & Donate
If you found django-log-panel helpful, consider supporting its development.
Project details
Verified details
These details have been verified by PyPIProject links
GitHub Statistics
Maintainers
Release history Release notifications | RSS feed


Download files
Download the file for your platform. If you're not sure which to choose, learn more about installing packages.
Source Distribution
Built Distribution
Filter files by name, interpreter, ABI, and platform.
If you're not sure about the file name format, learn more about wheel file names.
Copy a direct link to the current filters
File details
Details for the file django_log_panel-0.1.7.tar.gz.
File metadata
- Download URL: django_log_panel-0.1.7.tar.gz
- Upload date:
- Size: 47.9 kB
- Tags: Source
- Uploaded using Trusted Publishing? Yes
- Uploaded via: twine/6.1.0 CPython/3.13.12
File hashes
| Algorithm | Hash digest | |
|---|---|---|
| SHA256 |
6ad2b3069e9188c38b9922f91f89099330ac217586d370313482909ec579671e
|
|
| MD5 |
aab5e44bfb95a1431eab8b97eeff8d27
|
|
| BLAKE2b-256 |
7eaa4970690174cd2cb29a995f2323032ccc009d71af0061c0719dc170820e71
|
Provenance
The following attestation bundles were made for django_log_panel-0.1.7.tar.gz:
Publisher:
release.yml on rreiter3/django-log-panel
-
Statement:
-
Statement type:
https://in-toto.io/Statement/v1 -
Predicate type:
https://docs.pypi.org/attestations/publish/v1 -
Subject name:
django_log_panel-0.1.7.tar.gz -
Subject digest:
6ad2b3069e9188c38b9922f91f89099330ac217586d370313482909ec579671e - Sigstore transparency entry: 1318478158
- Sigstore integration time:
-
Permalink:
rreiter3/django-log-panel@30865cb568e54f70bff774118902678f61966411 -
Branch / Tag:
refs/heads/main - Owner: https://github.com/rreiter3
-
Access:
public
-
Token Issuer:
https://token.actions.githubusercontent.com -
Runner Environment:
github-hosted -
Publication workflow:
release.yml@30865cb568e54f70bff774118902678f61966411 -
Trigger Event:
workflow_dispatch
-
Statement type:
File details
Details for the file django_log_panel-0.1.7-py3-none-any.whl.
File metadata
- Download URL: django_log_panel-0.1.7-py3-none-any.whl
- Upload date:
- Size: 42.6 kB
- Tags: Python 3
- Uploaded using Trusted Publishing? Yes
- Uploaded via: twine/6.1.0 CPython/3.13.12
File hashes
| Algorithm | Hash digest | |
|---|---|---|
| SHA256 |
91c11988b760b94513280d6554fd0a56ac37b268c0f4e47772aebd8865b64cbf
|
|
| MD5 |
e8359f986332b597ce6e9864c5b88afb
|
|
| BLAKE2b-256 |
cc69af6fafe02905f42203a59402c02d05e22ec845d0d902c8aa56b6a442e590
|
Provenance
The following attestation bundles were made for django_log_panel-0.1.7-py3-none-any.whl:
Publisher:
release.yml on rreiter3/django-log-panel
-
Statement:
-
Statement type:
https://in-toto.io/Statement/v1 -
Predicate type:
https://docs.pypi.org/attestations/publish/v1 -
Subject name:
django_log_panel-0.1.7-py3-none-any.whl -
Subject digest:
91c11988b760b94513280d6554fd0a56ac37b268c0f4e47772aebd8865b64cbf - Sigstore transparency entry: 1318478226
- Sigstore integration time:
-
Permalink:
rreiter3/django-log-panel@30865cb568e54f70bff774118902678f61966411 -
Branch / Tag:
refs/heads/main - Owner: https://github.com/rreiter3
-
Access:
public
-
Token Issuer:
https://token.actions.githubusercontent.com -
Runner Environment:
github-hosted -
Publication workflow:
release.yml@30865cb568e54f70bff774118902678f61966411 -
Trigger Event:
workflow_dispatch
-
Statement type:






