Django middleware that measures request time breakdown (total/db/app) and query count using execute_wrapper.

Project description


django-xbench
Lightweight Django middleware for APM-style request profiling
Measure DB vs App time and query count with near-zero configuration.
Why django-xbench?
- 🔍 DevTools visibility: See DB vs app/serialization time in Chrome DevTools via
Server-Timing. - 🚀 Zero-agent: No daemon, no SaaS — just one Django middleware.
- 🧩 Drop-in: Near-zero configuration (add middleware and go).
- 🔒 Privacy-first: Exposes timing + query counts only (no query contents stored).
Goal: make performance bottlenecks “visible” (DB vs app/serialization) without heavyweight APM.
Here's how django-xbench exposes request timing breakdown using the Server-Timing header:
Adds Server-Timing and X-Bench-Queries headers and optionally logs per-request metrics.
Features
- ✅ Measures total request time and DB time (via
connection.execute_wrapper) - ✅ Calculates app time (= total - db)
- ✅ Counts DB queries
- ✅ Adds response headers:
Server-Timing: xbench-total;dur=..., xbench-db;dur=..., xbench-app;dur=...X-Bench-Queries: <int>
- ✅ Optional logging:
[XBENCH] GET /path | xbench_total=...ms xbench_db=...ms xbench_app=...ms q=...
- ✅ Slow endpoint aggregation (in-memory, per process) + simple dashboard (experimental)
- ✅ Tested with
pytest+pytest-django
Installation
pip install django-xbench
For local development (this repository):
pip install -e ".[dev]"
Quickstart
- Add middleware in your
settings.py:
MIDDLEWARE = [
    # Recommended: place near the top to approximate end-to-end server time
    # (includes other middleware overhead).
    "django_xbench.middleware.XBenchMiddleware",

    # ... other middleware ...
]
- Run your server and hit any endpoint:
In your project:
python manage.py runserver
curl -I http://127.0.0.1:8000/<your-endpoint>/
In this repo (demo):
# macOS / Linux
export DJANGO_SECRET_KEY="dev"
python -m examples.manage runserver --noreload
curl -I http://127.0.0.1:8000/db-heavy/
# Windows PowerShell
$env:DJANGO_SECRET_KEY="dev"
python -m examples.manage runserver --noreload
curl -I http://127.0.0.1:8000/db-heavy/
You should see headers similar to:
Server-Timing: xbench-total;dur=12.345, xbench-db;dur=1.234, xbench-app;dur=11.111
X-Bench-Queries: 3
Output
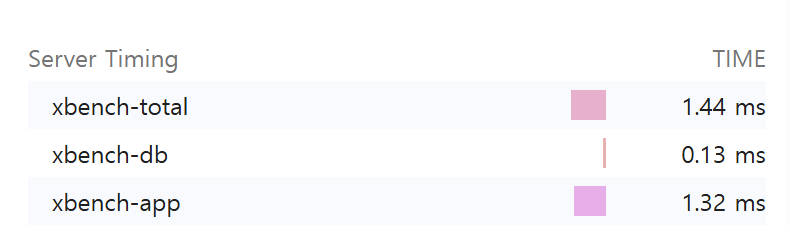
Server-Timing
Example:
Server-Timing: xbench-total;dur=52.300, xbench-db;dur=14.100, xbench-app;dur=38.200
xbench-total: whole request durationxbench-db: total DB time measured by wrapperxbench-app:max(0, total - db)(serialization/template/python time etc.)
You can inspect this in Chrome DevTools → Network → Timing
(or any browser that supports the Server-Timing spec).
Query count header
X-Bench-Queries: 5
Configuration
django-xbench supports two configuration styles.
Preferred: XBENCH dict
Use a single XBENCH dictionary to keep settings compact and grouped:
XBENCH = {
    "ENABLED": True,       # default: True
    "LOG": False,          # default: False
    "LOG_LEVEL": "info",   # "info" or "debug"
    "SLOW_AGG": False,     # default: False
}
Legacy (still supported)
Older flat settings are still supported:
XBENCH_ENABLED = True
XBENCH_LOG_ENABLED = True
XBENCH_LOG_LEVEL = "debug"
XBENCH_SLOW_AGG_ENABLED = True
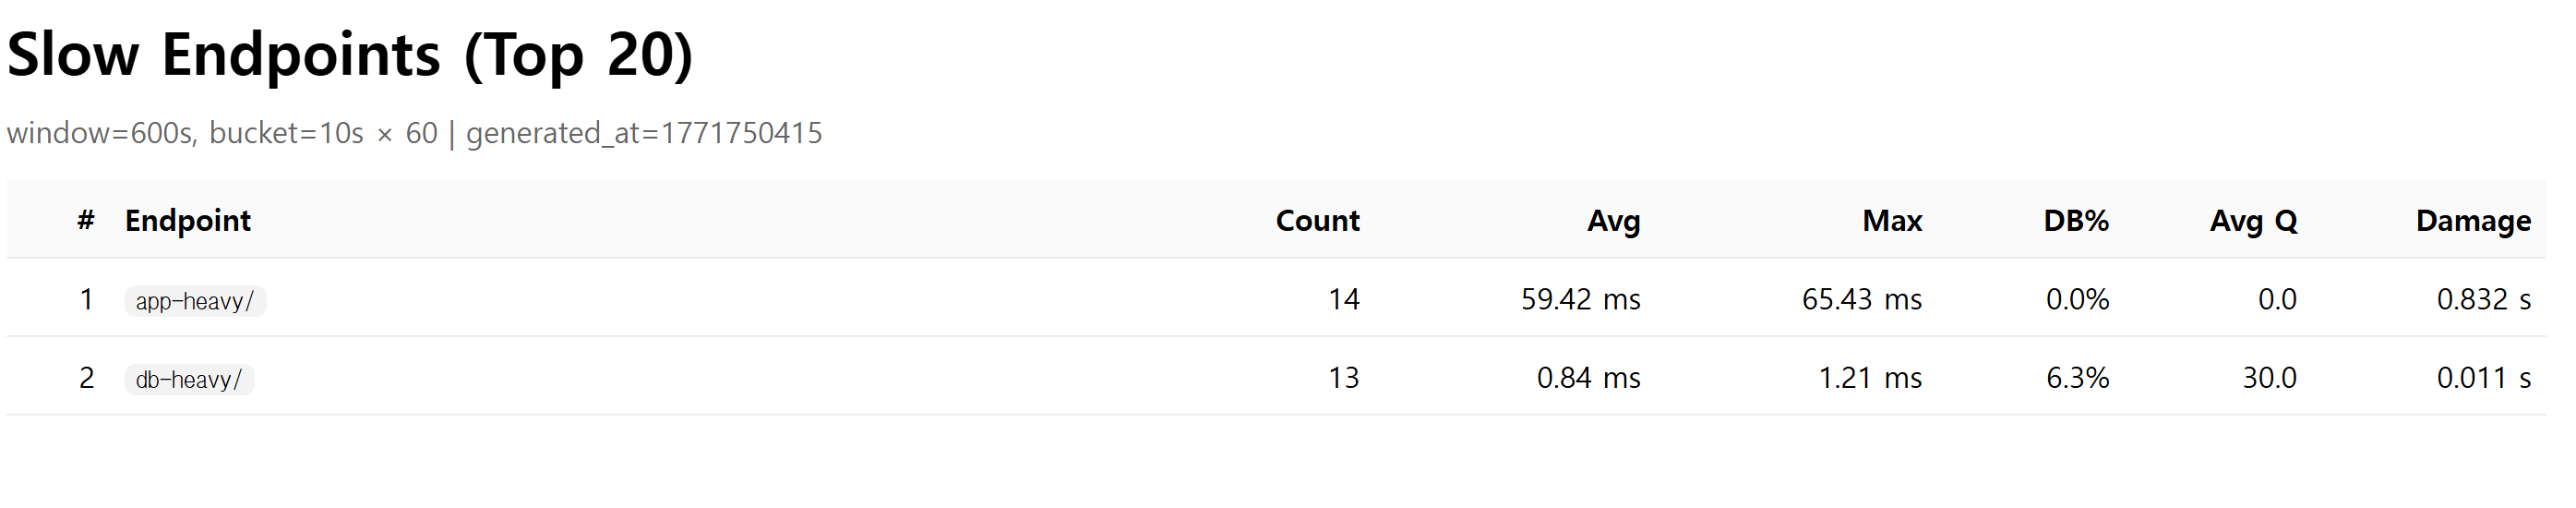
Slow endpoint dashboard (experimental)
This feature keeps an in-memory rolling window of endpoint timings (per process) and shows the slowest endpoints by "damage" (total accumulated latency).
Enable aggregation
XBENCH = {"SLOW_AGG": True}
Expose developer endpoints (do not expose publicly)
In your project's urls.py:
from django.urls import include, path

urlpatterns = [
    # ... your urls ...
    path("__xbench__/", include("django_xbench.slowagg.urls")),
]
Endpoints
- JSON snapshot:
GET /__xbench__/slow/?n=20 - HTML dashboard:
GET /__xbench__/slow/ui/?n=20
Notes
- Aggregation is in-memory per process. If you run multiple workers/processes, each one has its own rolling window.
- Intended for debugging / internal visibility, not as a full distributed APM.
- DB%: db_total / total
- Avg Q: average DB queries per request
- Damage: total accumulated latency in the window (sum of durations)
No data yet?
The dashboard only shows data after requests occur.
If you see "No data yet":
- Make sure
SLOW_AGGis enabled - Hit some endpoints (e.g.
/db-heavy/) - Refresh the dashboard
If using Django runserver with auto-reload, aggregation resets on reload.
Advanced tuning (optional)
XBENCH = {
    "SLOW_AGG": True,
    "SLOW_BUCKET_SECONDS": 10,   # bucket size in seconds
    "SLOW_BUCKET_COUNT": 60,     # number of buckets (window = bucket_seconds * bucket_count)
    "SLOW_ENDPOINT_CAP": 200,    # max unique endpoints per bucket (overflow goes to "__other__")
}
Development
Run tests
pytest
Note: this repo includes a bundled
examples/Django project used bypytest-django. In CI, we setPYTHONPATH=examplesto ensureexamples.config.settingscan be imported reliably.
If you want to see logs while testing:
pytest -s
Demo project (bundled)
This repository includes an examples/ Django project for manual testing.
Run it from the repository root:
# macOS / Linux
export DJANGO_SECRET_KEY="dev"
python -m examples.manage runserver --noreload
# Windows PowerShell
$env:DJANGO_SECRET_KEY="dev"
python -m examples.manage runserver --noreload
Try a few endpoints:
curl -I http://127.0.0.1:8000/db-heavy/
curl -I http://127.0.0.1:8000/app-heavy/
curl -I http://127.0.0.1:8000/admin/login/
Compatibility
- Python: 3.9+
- Django: 3.2+ (tested on 5.2)
Roadmap
- DRF serialization time breakdown (view/serializer timing)
- More robust
Server-Timingmerging (preserve existing metrics) - Docs: real-world examples (N+1 detection demo endpoints)
- Slow endpoint dashboard: auto-refresh UI and better filtering
Contributing
Issues and PRs are welcome.
If you propose new metrics, please include:
- minimal reproducible example
- tests
- documentation update
License
MIT


Download files
Download the file for your platform. If you're not sure which to choose, learn more about installing packages.
Source Distribution
Built Distribution
Filter files by name, interpreter, ABI, and platform.
If you're not sure about the file name format, learn more about wheel file names.
Copy a direct link to the current filters
File details
Details for the file django_xbench-0.1.6.tar.gz.
File metadata
- Download URL: django_xbench-0.1.6.tar.gz
- Upload date:
- Size: 15.9 kB
- Tags: Source
- Uploaded using Trusted Publishing? No
- Uploaded via: twine/6.2.0 CPython/3.10.0
File hashes
| Algorithm | Hash digest | |
|---|---|---|
| SHA256 |
66ecabbc6ad6dd18a9ae535284f0c8c14c07b473863367215cec9e6ae33403de
|
|
| MD5 |
566732999878b561567c4a1c0655f0ba
|
|
| BLAKE2b-256 |
0ae0d3e3a0e4959f3df025bd9e2a380d5cbffe7f515fd96b3540769a5f0df3fb
|
File details
Details for the file django_xbench-0.1.6-py3-none-any.whl.
File metadata
- Download URL: django_xbench-0.1.6-py3-none-any.whl
- Upload date:
- Size: 15.6 kB
- Tags: Python 3
- Uploaded using Trusted Publishing? No
- Uploaded via: twine/6.2.0 CPython/3.10.0
File hashes
| Algorithm | Hash digest | |
|---|---|---|
| SHA256 |
fa05cf573c5cb51ac33a4257b2c2b417d64f626339662bbfa311d22a260258b7
|
|
| MD5 |
97cce4891c62c1f153fa1bfd59233a1e
|
|
| BLAKE2b-256 |
806024fb1bb1d7ec6c0c9c0d0de876bee9eb65032dcbb4b723e78c20c8b854e1
|


