Plot features from DNA sequences (e.g. Genbank) with Python

Project description
Dna Features Viewer is a Python library to (wait for it…) visualize DNA features, e.g. from GenBank or Gff files, using the plotting library Matplotlib:

Dna Features Viewer is fairly minimal (<200 lines of code) but can display sequences with lots of overlapping features and long labels, without getting too messy. The plots can be output to many different formats (PNG, JPEG, SVG, PDF).
License
Dna Features Viewer is an open-source software originally written at the Edinburgh Genome Foundry by Zulko and released under the MIT licence. Everyone is welcome to contribute !
Installation
Dna Features Viewer can be installed by unzipping the source code in one directory and using this command:
sudo python setup.py installPIP install is coming soon !
Examples of use
Defining the features by hand
In this first example we define features “by hand”:
from dna_features_viewer import GraphicFeature, GraphicRecord
features=[
    GraphicFeature(start=0, end=20, strand=+1, color="#ffd700",
                   label="Small feature"),
    GraphicFeature(start=20, end=500, strand=+1, color="#ffcccc",
                   label="Gene 1 with a very long name"),
    GraphicFeature(start=400, end=700, strand=-1, color="#cffccc",
                   label="Gene 2"),
    GraphicFeature(start=600, end=900, strand=+1, color="#ccccff",
                   label="Gene 3")
]
record = GraphicRecord(sequence_length=1000, features=features)
record.plot(fig_width=5)
Reading the features from a GenBank file
DnaFeaturesViewer plays nice with BioPython. As a result it is super easy to plot the content of a GenBank file:
from dna_features_viewer import GraphicRecord
from Bio import SeqIO
with open("./plasmid.gb", "r") as f:
    record = SeqIO.read(f, "genbank")
graphic_record = GraphicRecord.from_biopython_record(record)
graphic_record.plot(fig_width=10)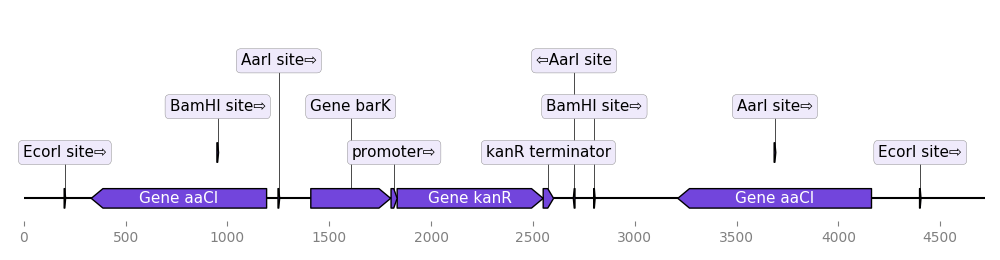
Displaying the features along with other plots
As it uses Matplotlib, Dna Features Viewer can display the features on top of other sequences statistics, such as the local GC content:
import matplotlib.pyplot as plt
from dna_features_viewer import GraphicRecord
from Bio import SeqIO
import numpy as np

figure_width = 10
fig, (ax1, ax2) = plt.subplots(2,1, figsize=(figure_width,5), sharex=True)

# Parse the genbank file, plot annotations
with open("./plasmid.gb", "r") as f:
    record = SeqIO.read(f, "genbank")
graphic_record = GraphicRecord.from_biopython_record(record)
_, max_y = graphic_record.plot(ax=ax1m , with_ruler=False)

# Plot the local GC content
def plot_local_gc_content(record, window_size, ax):
    gc_content = lambda s: 1.0*len([c for c in s if c in "GC"]) / len(s)
    yy = [gc_content(record.seq[i:i+window_size])
          for i in range(len(record.seq)-window_size)]
    xx = np.arange(len(record.seq)-window_size)+25
    ax.fill_between(xx, yy, alpha=0.3)
plot_local_gc_content(record, window_size=50, ax=ax2)

# Resize the figure
fig.set_size_inches(figure_width, 2 + 0.4*(max_y+2))
Dna Features Viewer is pretty minimal in terms of features but easily extensible since it uses Matplotlib as a backend.
Bonus
As a bonus, here is what to expect when you feed it with a pathologically annotated Genbank file:

Release history Release notifications | RSS feed


Download files
Download the file for your platform. If you're not sure which to choose, learn more about installing packages.
Source Distribution
Built Distribution
Filter files by name, interpreter, ABI, and platform.
If you're not sure about the file name format, learn more about wheel file names.
Copy a direct link to the current filters
File details
Details for the file dna_features_viewer-0.1.0.tar.gz.
File metadata
- Download URL: dna_features_viewer-0.1.0.tar.gz
- Upload date:
- Size: 12.2 kB
- Tags: Source
- Uploaded using Trusted Publishing? No
File hashes
| Algorithm | Hash digest | |
|---|---|---|
| SHA256 |
3ea5d7ee7d076d18ebb06d6e92bc21ebe82cdcd967f5618bfb16495ede54e8cf
|
|
| MD5 |
21c433397760ddba567848ec80c7788f
|
|
| BLAKE2b-256 |
bc9d25ce78d8d640696f8cb3e4293dfc28b05edd5df138a9225450f8a590e1df
|
File details
Details for the file dna_features_viewer-0.1.0-py2-none-any.whl.
File metadata
- Download URL: dna_features_viewer-0.1.0-py2-none-any.whl
- Upload date:
- Size: 10.3 kB
- Tags: Python 2
- Uploaded using Trusted Publishing? No
File hashes
| Algorithm | Hash digest | |
|---|---|---|
| SHA256 |
fb224f5d124a6b49f1ba8c9157f3bdd0422d56fafee28bf07c9160fec6c392ab
|
|
| MD5 |
396330c5efbed98d4da041ff964a1bf7
|
|
| BLAKE2b-256 |
581488e7f69632d2365ad0afd663dcbf50bd5a000323197289858623a7af0b9b
|


