Clean draw of rectangle and polygon contours

Project description
Drawline
Say goodbye to endless searching and trial-and-error with image overlays! Drawline makes it effortless to overlay polyggon contours, rectangles and even auto-handles label colors, font size and line thickness. With the option to override, Drawline takes the hassle out of image drawing customization
Install
pip install drawline
Screenshots
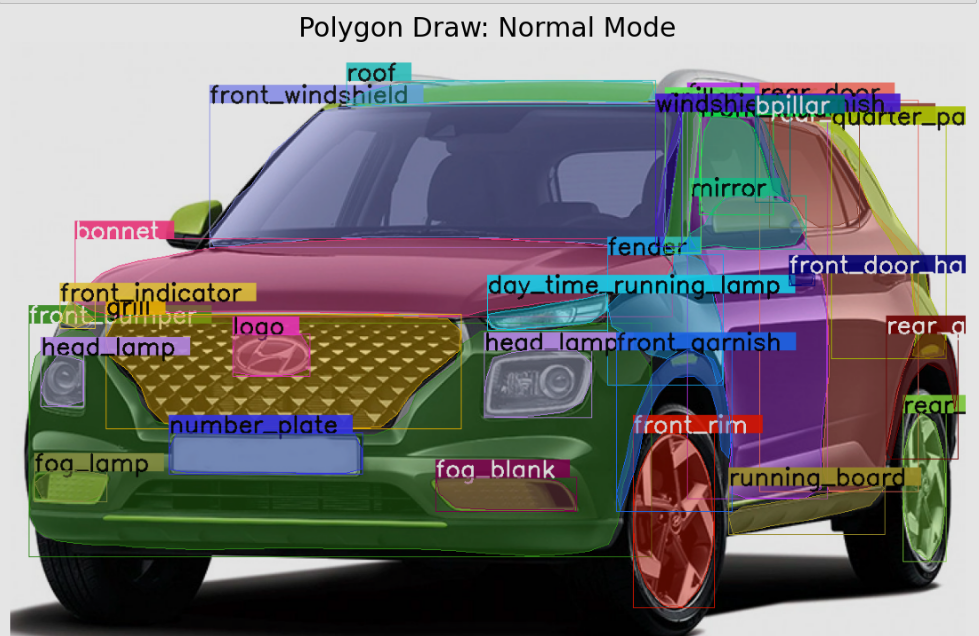
- Polygon draw (Normal mode): Good to use when there are less number of polygons to draw.
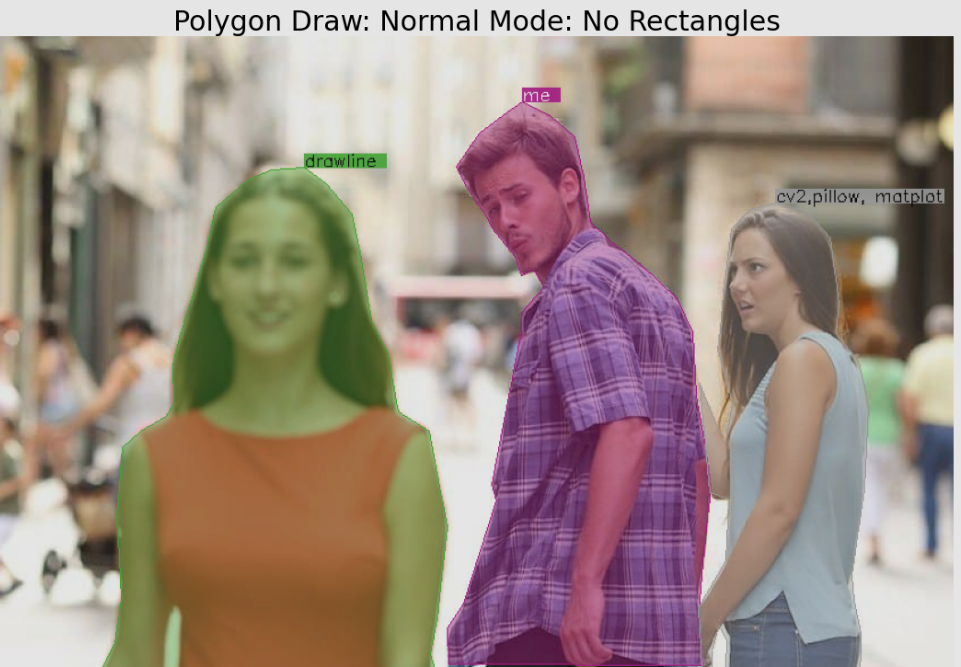
# Go to 'How to Use' section for detail code
result_image = draw_poly(image, {YOUR_CONTOURS}, label={YOUR_LABELS}, graph_mode=False, show_rect=False)
- Polygon draw (Graph mode): Good to use when there are many number of polygons to draw. Overcomes the overlay labels problem.
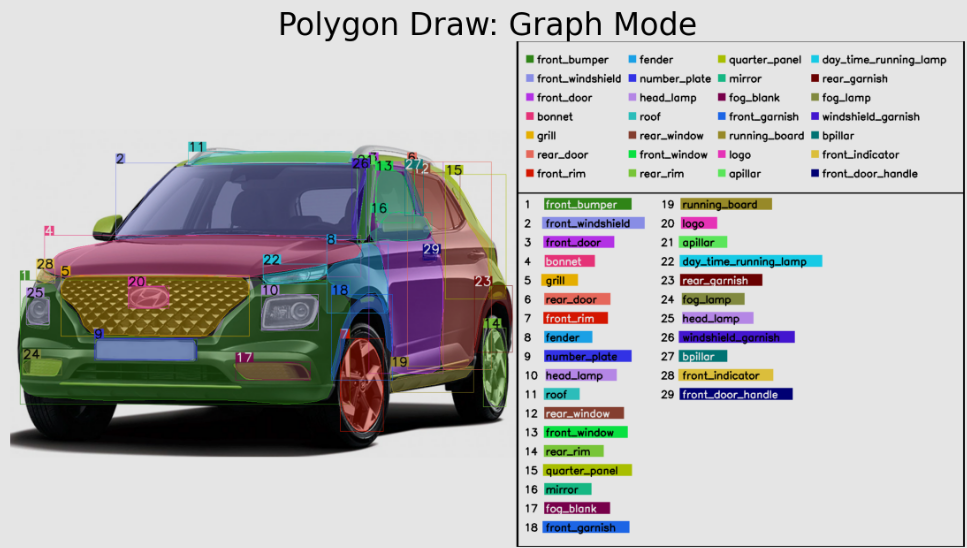
# Go to 'How to Use' section for detail code
result_image = draw_poly(image, {YOUR_CONTOURS}, label={YOUR_LABELS}, graph_mode=True)
- Rectangle draw (normal mode): You can also simlpy draw a rectangle instead of polygon.
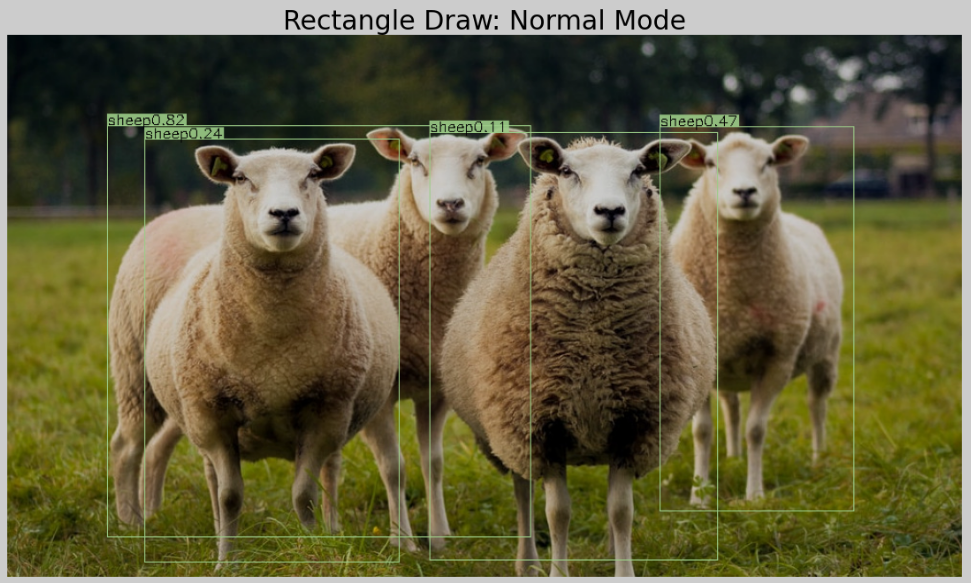
# Go to 'How to Use' section for detail code
result_image = draw_rect(image, {YOUR_RECTANGLE_COORDINATES}, label={YOUR_LABELS})
How to use
Checkout the example: Notebook Example (NB viewer) or Github Viewer
OR
from drawline import draw_poly, draw_rect
import cv2

img_pth = '/PATH/TO/IMAGE.jpg'
image = cv2.imread(img_pth)

# Single  Rectangle example
result_image = draw_rect(image, [XMIN, YMIN, XMAX, YMAX], labels='label_1')

# Multiple Rectangles example
result_image = draw_rect(image,
                         [[XMIN_1, YMIN_1, XMAX_1, YMAX_1],
                          [XMIN_2, YMIN_2, XMAX_2, YMAX_2]],
                         labels=['Label_1', 'Label_2'])


# Single Contours Polygon example
result_image = draw_poly(image, CONTOUR, label='label_1')

# Multiple Contours Polygon points
result_image = draw_poly(image, CONTOURS, label=['label_1', 'label_2', ...])

# Assigning Labels is optional, if not given no label name will be displayed
Default options
def draw_rect(image, points, rgb=None, label_transparency=0.1, thickness=None, labels=None,
              label_rgb=None, label_bg_rgb=None, label_font_size=None,
              random_color=False, graph_mode=False):
    """
    Draws rectangle from given coordinates
    :param image: (Numpy) numpy matrix image
    :param points: (List) List of rectangle coordinates: [[xmin, ymin, xmax, ymax]]
    :param rgb: (Tuple) RGB values: (R, G, B)
    :param label_transparency: (float) transparency for the labels
    :param thickness: (Integer) of line in px: eg: 2
    :param labels: (List) list of strings: []
    :param label_rgb: (Tuple) RGB text color for labels: (R,G,B)
    :param label_bg_rgb: (Tuple) RGB label background color: (R,G,B)
    :param label_font_size: (Integer) Font size of label in px: 2
    :param random_color: (Boolean) pick random colors for lines.
    :param graph_mode: (Boolean) Writes labels to a border instead in the image itself (Good to use when to many boxes
     obstructing the view)

    :return: (numpy) drawn rectangles on image
    """


def draw_poly(image, contours, fill_in=True, label_transparency=0.1, fill_transparency=0.4, rgb=None, thickness=None,
              show_rect=True, labels=None, label_rgb=None, label_bg_rgb=None, label_font_size=None, random_color=False,
              graph_mode=False):
    """
    Draws polygon and fills in color from given contours
    :param image: (Numpy) numpy matrix image
    :param contours: (List) of contours
    :param fill_in: (Boolean) fill color inside the polygon.
    :param label_transparency: (float) transparency for the labels
    :param fill_transparency: (Float) transparency of fill_in color.
    :param rgb: RGB values: (Tuple) rgb color of line and polyfgon (R, G, B)
    :param thickness: (Int) Thickness of line
    :param show_rect: (Boolean) Show rectangle
    :param labels: (List of strings) List of label names
    :param label_rgb: (Tuple) RGB color of labels
    :param label_bg_rgb: (Tuple) RGB color of Label background
    :param label_font_size: (Int) Label font size
    :param random_color: (Boolean) Randomize RGB color
    :param graph_mode: (Boolean) Writes labels to a border instead in the image itself (Good to use when to many boxes
     obstructing the view)

    :return: (Numpy) drawn polygon on image
    """


Download files
Download the file for your platform. If you're not sure which to choose, learn more about installing packages.
Source Distribution
Built Distribution
Filter files by name, interpreter, ABI, and platform.
If you're not sure about the file name format, learn more about wheel file names.
Copy a direct link to the current filters
File details
Details for the file drawline-0.3.4.tar.gz.
File metadata
- Download URL: drawline-0.3.4.tar.gz
- Upload date:
- Size: 12.6 kB
- Tags: Source
- Uploaded using Trusted Publishing? No
- Uploaded via: twine/4.0.2 CPython/3.9.12
File hashes
| Algorithm | Hash digest | |
|---|---|---|
| SHA256 |
eb8d3d0d8208be3889bfeda4f7241b1fd258df34b397f0e3254a40dd7554a98e
|
|
| MD5 |
9716c32f122fcc3c7b67895b1dc15307
|
|
| BLAKE2b-256 |
5a101f1df0aa4487be4a55f464c0b7e8ebcd569455589e9bddb51e9e6b88da16
|
File details
Details for the file drawline-0.3.4-py3-none-any.whl.
File metadata
- Download URL: drawline-0.3.4-py3-none-any.whl
- Upload date:
- Size: 13.2 kB
- Tags: Python 3
- Uploaded using Trusted Publishing? No
- Uploaded via: twine/4.0.2 CPython/3.9.12
File hashes
| Algorithm | Hash digest | |
|---|---|---|
| SHA256 |
55e9814a94dbb1a1ed32fee1844b8570126339bdd2d1787bc65c643d572e8021
|
|
| MD5 |
b74075983e21a03e40ee914d622c7b4b
|
|
| BLAKE2b-256 |
2edec610bfe0cd10fd9e5a9f8155f9a90950dfab17c21b86acfd7dea755498cc
|


