

Turns a huge Android trace into 20 rows of facts an AI agent can actually use.




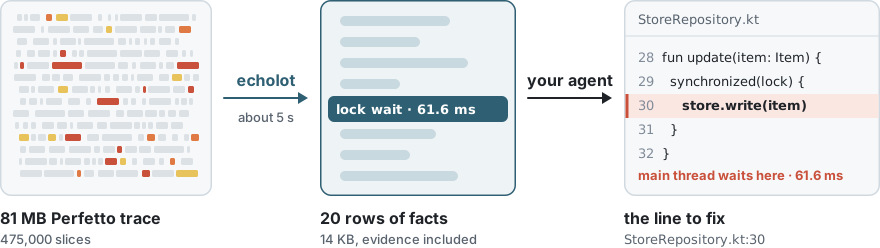
- Finds the line to fix. From a slow screen to a file and line, with the numbers that prove it.
- Same answer, every run. A pinned
trace_processor: the same trace always gives the same report. - No tracing code needed. Works on apps with zero
trace {}calls; it places temporary markers itself. - Works with your agent. A plugin for Claude Code and Codex; Cursor and
others via
echolot guide.
Contents · Quick start · How it works · What it saves · What you get · What changed
Reference · Detectors · Commands · Requirements · Project layout · Documentation · Status
Quick start
You need Python 3.10+, adb, and a phone or emulator with USB debugging on.
The full list is under Requirements.
1. Install the tool
pipx install echolot
echolot --version names what you got. Installed with pip into an
environment whose scripts are not on PATH, python -m echolot is the same
command — except to Codex's sandbox rule, which lets out only a line that
starts with echolot.
2. Add the plugin to your agent
The plugin works in Claude Code and in Codex. It comes from the marketplace in
this repository, and it drives the echolot you installed in step 1:
claude plugin marketplace add grishan0v/echolot && claude plugin install echolot@echolot   # Claude Code
codex plugin marketplace add grishan0v/echolot && codex plugin add echolot@echolot         # Codex
Inside a Claude Code session the same two steps are
/plugin marketplace add grishan0v/echolot and
/plugin install echolot@echolot. Once the marketplace is added, Codex also
installs the plugin from /plugins in the CLI or from the Plugins tab of the
ChatGPT desktop app. The plugin is not in Anthropic's or OpenAI's catalogs
yet.
Without the plugin: the .claude/ layer in Claude Code, and other agents
cd ~/my-app && echolot init
In Claude Code this installs the .claude/ layer into the project: a skill,
the perf-hunter agent and three commands. Other agents get a pointer to the
tool instead, and echolot guide tells them how to work with it. A plain
init points only at agents whose files the project already has: for Codex
without the plugin that is a .codex/ folder or an AGENTS.md, and
elsewhere echolot init --for agents,codex (with claude and any other agent
the project uses) writes the pointer and the rule that lets echolot out of
Codex's sandbox — run it outside the sandbox, as the codex line of
echolot says. The guide hands the loop to a subagent where the host can
start one; where it cannot, the loop runs in your main context, so keep the
passes short.
On a repository that is not yours to change, echolot init --private installs
the same files and keeps every one of them out of git status, for this clone
only. The details are under The agent layer.
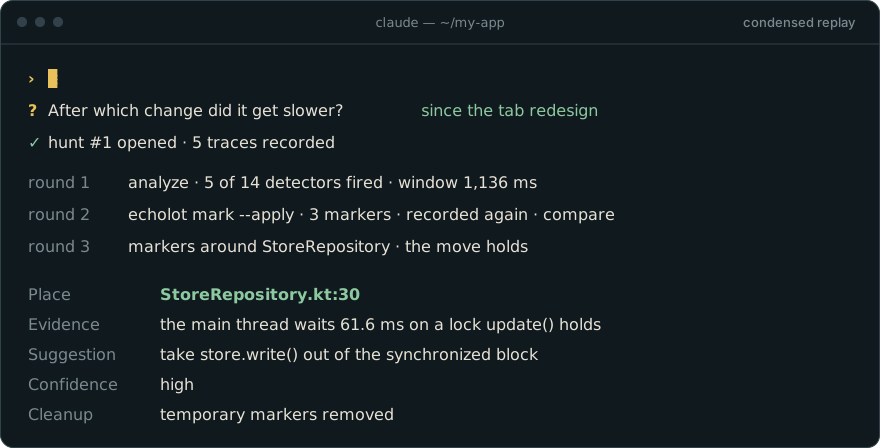
3. Open the agent and type one word
/echolot                          reads the state, does whatever is next
/echolot why is cold start slow   hunt, with that as the question
/echolot init | setup | hunt | reflect | doctor
The word depends on how your agent got echolot: /echolot:echolot with the
plugin in Claude Code, $echolot with the plugin in Codex, and /echolot with
the .claude/ layer. This page writes it as /echolot. In Codex a plain
question about slow startup reaches it as well.
The first run sets the project up, checks that this machine computes traces
correctly, and builds echolot.yml from your repository and a probe trace,
asking you four questions along the way. Every run after that hunts down the
regression you describe.
What to ask
Describe the problem the way you would to a colleague:
| the problem | what to type | what it needs |
|---|---|---|
| Cold start got slower | /echolot why is cold start slow |
— |
| Scrolling stutters | /echolot the feed janks on scroll |
a scroll scenario in echolot.yml, which holds one scenario at a time; frame_jank needs Android 12+ |
| "App isn't responding" | /echolot the app froze, here is anr.txt |
the report: an export from Crashlytics or Play Console, or dumpsys dropbox |
| The nightly benchmark got slower | one step after the benchmark in its workflow: uses: grishan0v/echolot@v0.11.0 |
it analyzes the traces, compares them with the report the last good run kept, and keeps both. The inputs, and why it never fails a build over what moved, are in Comparing |
Coming back later
echolot on its own prints where the project stands and the next step.
To upgrade, run pipx upgrade echolot, then update what your agent uses:
claude plugin marketplace update echolot && claude plugin update echolot@echolot   # Claude Code, applied after a restart
codex plugin marketplace upgrade echolot && codex plugin add echolot@echolot       # Codex
cd ~/my-app && echolot init                                                        # the .claude/ layer
A new plugin comes out with each release of the tool, so the two stay in step.
echolot init brings the .claude/ layer up to date and leaves the files you
edited alone.
Without an agent
The same work, by hand or in CI:
echolot collect -c echolot.yml -n 5                                       # 5 repeats of the scenario
echolot analyze .echolot/traces/coldStart_iter*.perfetto-trace -c echolot.yml  # build the report from them
echolot compare before.json .echolot/out/report.json                      # what changed since
echolot doctor -q                                                         # is this environment sane? exit 0 yes, 1 no or not checked, 2 trace_processor not downloaded
coldStart is the config's scenario.name. .echolot/traces/ keeps the
repeats of every scenario you have recorded, so the report is built from one
scenario's: a glob over the whole directory would take medians across two.
Results land in .echolot/out/ — report.md for you, report.json for the
agent.
How it works
echolot runs thirteen SQL detectors over a Perfetto trace and returns about
twenty rows: where the time went, how much of it, and the evidence behind each
claim. Same trace in, same report out: the trace_processor version is pinned.
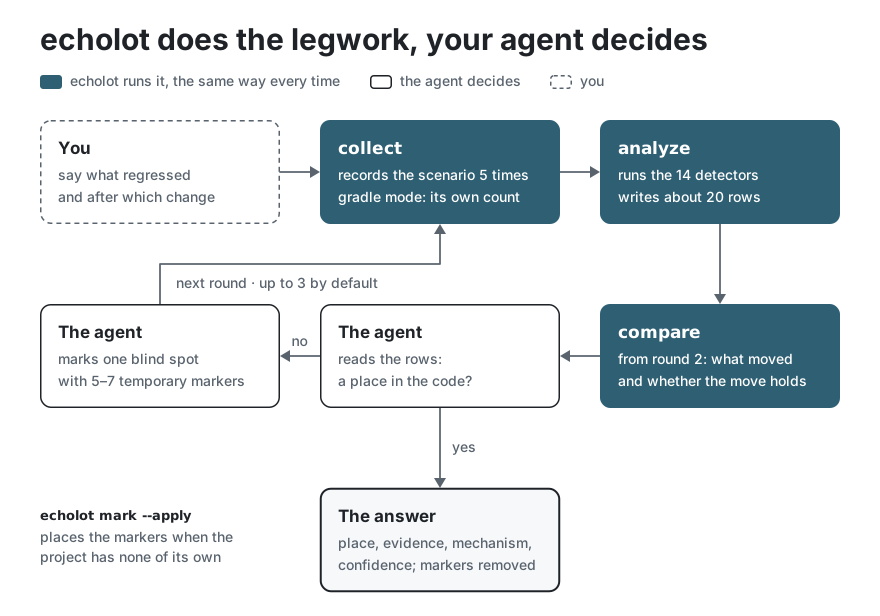
The recording, the detectors and the comparison are scripts that run the same way every time. In each round the agent makes one decision: where to look next. The loop ends when the report names a place in the code, or when the rounds run out.
| where you run it | how |
|---|---|
| Claude Code or Codex, with the plugin | the full loop, in a subagent in both: the agent records, reads the report and walks down to the code. The plugin sets the project up itself; installing it is under Quick start |
Claude Code, with the .claude/ layer |
the same loop: echolot init, then /echolot |
| Cursor, other agents, Codex without the plugin | echolot init points them at the tool, and echolot guide tells them how to work with it. A plain init finds only agents whose files the project already has; echolot init --for agents,codex sets up Codex anywhere else, with the rule that lets echolot out of its sandbox. The guide hands the loop to a subagent where the host can start one; where it cannot, the loop runs in your main context, so keep the passes short |
| a shell or CI | the pipeline commands under Without an agent |
The investigation
Each question you bring gets an investigation. echolot hunt "cold start was 3s, now 7s" --since "the tab redesign" opens one, sets the previous traces of the
config's scenario aside without deleting them, and files every round of traces and every report
under it, so a question asked weeks ago still knows what was measured to
answer it. /echolot opens and closes them for you. The commands, and what
each one keeps, are in The agent layer.
What it saves
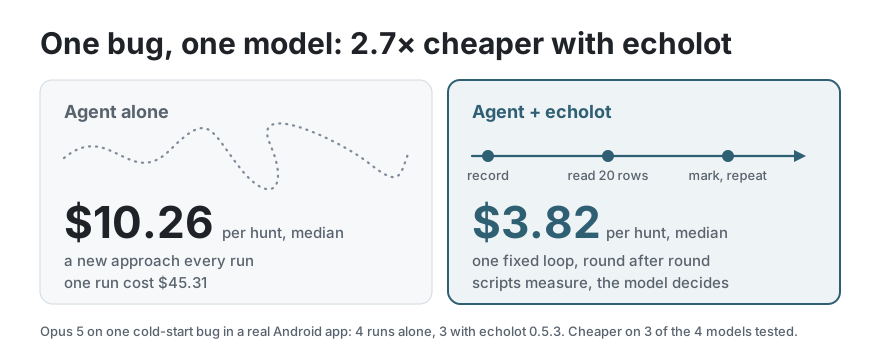
Cost is the measure because it includes the work of the agent's subagent: token counts leave that out, and time went both ways across the four models.
What you get
A Marker Report: what was measured, then one section per detector that fired. The silent ones are named too.
Example report (click to expand)
# Marker Report

Runs: **5**, numbers are medians across them
Traces: `coldStart_iter000`, `coldStart_iter001`, `coldStart_iter002`, `coldStart_iter003`, `coldStart_iter004`
Process: `com.example.app` (pid 12903)
Scenario window: **1136.05 ms** (from 1084.25 to 1214.18)
Main thread: 40% on a CPU · 1% waiting for a CPU · 9% blocked in the kernel · 49% sleeping
Covered by the findings below: **42%** of the main thread's window, each moment counted once
Startup: cold, **1174 ms** from the launch to the first frame: 42% sleeping · 17% `choreographer_do_frame` · 17% `inflate` · 6% blocked in the kernel · 5% `monitor_contention` · 3% `launch_delay` · 2% `bind_application` · 2% `activity_start`
That is the platform's measure rather than the window: the startup began 38 ms before the window opened, and ended with it.
Device: clock **1478 MHz** (from 1325 to 1574 across repeats), peak 54 °C, 1514 MB free at the low point
Detectors fired: **5 of 13**
Config: `/home/you/my-app/echolot.yml` (sha 3d78738defec) · thresholds: built-in defaults

## Markers
_the names `domains` lists and the `AGENTTMP_` ones; medians per run, self time with children subtracted_

| Marker | Runs | N | Self, ms | Total, ms | Max, ms | Threads |
|---|---|---|---|---|---|---|
| collection_load | 5/5 | 1 | 923.8 | 923.8 | 923.8 | (async) |
| collection_mapping | 5/5 | 1 | 96.0 | 118.3 | 118.3 | arch_disk_io_1 |

## Frames that missed their deadline
_the platform classifies every frame itself, and says whose fault it was. The only detector that answers "which frames stuttered" rather than "where did the total go" — and it needs no instrumentation in the app at all._

| Where | Runs | N | Total, ms | Max, ms | Evidence |
|---|---|---|---|---|---|
| App Deadline Missed | 5/5 | 4 | 427.51 | 130.89 | Self Jank · 4 of 19 frames · longest 188.7 ms |

<sub>detector `frame_jank`, params: {'min_frames': 3, 'min_overrun_ms': 4}</sub>

## Where the main thread spent its time
_measured as SELF time, children subtracted — otherwise one event lands in the report several times at different depths and the agent counts it twice_

| Where | Runs | N | Self, ms | Total, ms | Max, ms | Evidence |
|---|---|---|---|---|---|---|
| inflate | 5/5 | 15 | 222.68 | 241.38 | 49.28 | com.example.app |
| draw | 5/5 | 7 | 120.8 | 120.8 | 34.0 | com.example.app |
| TextLayout:initLayout | 5/5 | 51 | 73.95 | 73.95 | 1.45 | com.example.app |
| Lock contention on a monitor lock (owner tid: 12931) | 5/5 | 9 | 61.6 | 61.6 | 22.4 | com.example.app |

<sub>detector `main_thread_block`, params: {'min_slice_ms': 16}</sub>

## Single occurrences far longer than the same work usually takes
_the pair to main_thread_block. That one asks where the main thread's time went in total; this one asks which single occurrence was out of line with its own history. A heavy tail hides from every sum._

| Where | Runs | N | Total, ms | Max, ms | Evidence |
|---|---|---|---|---|---|
| inflate | 2/5 | 1 | 86.2 | 86.2 | median 12.1 ms of 15 · worst 7.1× |

<sub>detector `main_thread_outlier`, params: {'factor': 4, 'min_abs_ms': 40, 'min_occurrences': 5}</sub>

## Monitor contention
_ART writes a "Lock contention on ..." slice with the owner's tid — ready-made evidence_

| Where | Runs | N | Total, ms | Max, ms | In the code | Evidence |
|---|---|---|---|---|---|---|
| com.example.app | 5/5 | 9 | 61.6 | 22.4 | owner at StoreRepository.kt:30 · blocked at StoreRepository.kt:61 | monitor contention with owner DefaultDispatcher-worker-3 (12931) at void com.example.app.data.StoreRepository.update(com.example.app.data.Item)(StoreRepository.kt:30) waiters=0 blocking from com.example.app.data.Item com.example.app.data.StoreRepository.find(long)(StoreRepository.kt:61) |

<sub>detector `monitor_contention`, params: {'min_block_ms': 8, 'max_total_ms': 50, 'name_glob': 'Lock contention on a monitor lock*', 'name_glob_alt': 'monitor contention with owner*'}</sub>

## Blind spots: threads burning CPU with no instrumentation
_names a thread that burns CPU with no slice around it. The agent does not guess — it is handed the fact "thread T ran for 340 ms, zero slices". That is exactly where adding trace{} pays off._

| Where | Runs | N | Total, ms | Instrumented, ms | Evidence |
|---|---|---|---|---|---|
| DefaultDispatch | 5/5 | 0 | 522.09 | 0.0 | 100.0% of CPU outside slices |

<sub>detector `uninstrumented_cpu`, params: {'min_running_ms': 50, 'max_covered_pct': 50}</sub>

**Silent:** anr, anr_risk, app_init, binder_txn, gc_pressure, io_wait, repeated_work, runnable_starvation

<sub>trace_processor v56.1</sub>
The example is what analyze prints, number for number, for the demo that
comes with echolot: five cold starts of an app that does not exist, built by
code.
report.md is for you, report.json for the agent.
An 81 MB trace with 475k slices comes out as a 14 KB report.json in about
five seconds.
What changed
The report says where the time went in one set of traces. The question people arrive with has a second half — it was 3 s, now it is 7 s — and that needs two sets.
echolot compare                       # inside an investigation: previous round vs latest
echolot compare old.json new.json     # or name them
One table, sorted by how far each row moved. The top row is usually the answer.
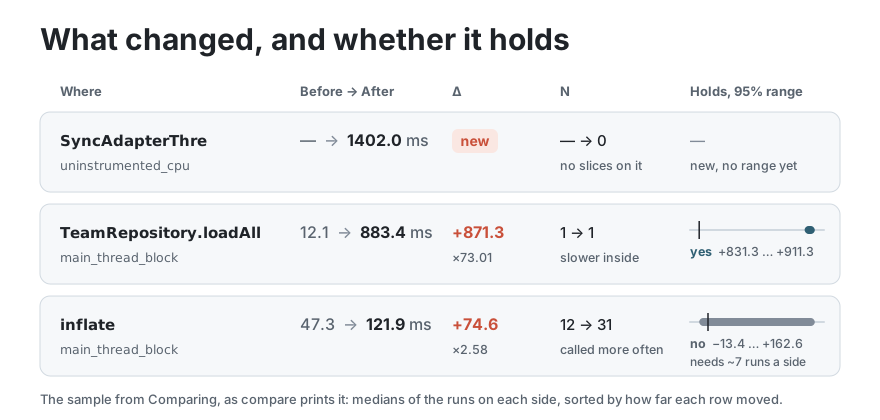
| column | what it says |
|---|---|
Δ |
how far the median moved, and by what factor |
N |
how many times it ran, before and after: called more often is a different bug from slower inside |
Holds |
the range the move lies in, 95% sure. yes when the range stays on one side of zero; no asks for another round of collect, and says about how many runs a side would settle it |
A report built against other thresholds, or on a device whose clock moved or throttled between the rounds, is named above the table. See Comparing.
Detectors
| detector | what it catches |
|---|---|
main_thread_block |
where the main thread spent its time, by self time |
app_init |
what ran after the Application was created, before the first Activity: initializers by name, and the ContentProviders and Application.onCreate nobody traced |
gc_pressure |
frequent or expensive GC, and waits on allocation |
monitor_contention |
lock contention, with the owner's tid as evidence |
binder_txn |
long synchronous IPC, and death by a thousand cuts |
runnable_starvation |
thread ready to run but preempted on CPU |
uninstrumented_cpu |
threads burning CPU with no instrumentation, and what they ran when the recording sampled callstacks |
frame_jank |
frames that missed their deadline, and whose fault it was |
anr_risk |
stretches where the main thread never got back to the message queue |
anr |
ANRs the system recorded during the trace, with its own reason |
main_thread_outlier |
one occurrence far longer than that work usually takes |
repeated_work |
the same work reached from more than one caller, costing about the same both times |
io_wait |
threads the kernel parked waiting for a block device |
uninstrumented_cpu, io_wait and frame_jank find a problem where nobody
wrote a trace{} call, as Analysing
explains. What every detector sees, with its default thresholds, is what
echolot explain prints, and writing your own is in
Detectors.
Commands
echolot --help lists every command in four groups. Every verb after
/echolot is an echolot command of the same name, except setup, which
only the agent has. The pipeline — collect, analyze, compare — is under
Without an agent.
Yours
| command | what it does |
|---|---|
echolot |
where this project stands, and the next step |
echolot init |
install or update the .claude/ layer, add echolot's two lines to .gitignore, and check the environment. With the plugin, its door runs echolot init --for plugin, which leaves .claude/ out. --private keeps everything it writes out of git, for this clone only |
echolot hunt "<what regressed>" |
open an investigation — see The investigation |
echolot doctor |
environment + self-check on a synthetic trace; exit 0 when every check passes, 1 when one fails or the self-check cannot run, 2 when trace_processor cannot be downloaded; -q for three lines (four where Codex is used) |
The agent's, behind /echolot — you do not call these
| command | what it does |
|---|---|
guide |
how to work with this tool, printed by the package — what an agent without the .claude/ layer reads instead of it |
report |
views of the last report without opening the json: what fired, one detector's rows with the evidence kept short, the window, the markers — --json for any of them |
scan |
what the repository says about itself, read as text: the app module and its applicationId, the variants and which one to measure on, the macrobenchmark with its tests and the sections it measures, the gradle task that runs it, the devices attached — and an echolot.yml to start from |
anr |
an ANR report from the field — the lock chain, the few threads that were not idle, and where their frames are in this checkout. Crashlytics and Play Console exports, and the device's own dumpsys dropbox record |
probe |
processes, threads by CPU, scenario anchor candidates — the threads' sections and the process's async ones |
names |
slice name inventory and detector mask coverage |
domains |
slice-to-code map and instrumentation coverage — literals, and names kept in a const val and passed through the project's own wrapper |
mark |
the first temporary markers for a project with none, from the manifest and the SDK, or from an ANR report's own frames with --from-anr — --apply / --remove. --pools lists where a thread or pool is created with the JDK's default name instead |
calibrate |
thresholds derived from known-healthy runs |
explain |
list the detectors and their parameters |
Improving the tool
| command | what it does |
|---|---|
reflect |
the same kind of report, over an agent session — how the tool was used, where it got in the way. Full detail for Claude Code and Codex; from any other client, built from the run log and honest about what it could not see |
Requirements
| Python | 3.10 or newer |
curl |
on PATH — the one download in the next row goes through it |
trace_processor (fetched once) |
downloaded by the first command that needs it, usually echolot init: 10–14 MB, checked against its SHA-256. Behind a proxy or offline, see Determinism |
adb |
on PATH — ships in the Android SDK platform-tools |
| Device | a phone or emulator with USB debugging on |
| Agent (optional) | Claude Code or Codex with the plugin, or Claude Code with the .claude/ layer, for the full workflow; Cursor and others via echolot guide |
git (for the plugin) |
the marketplace fetches the plugin with it. The install failed with git 2.33 and works with 2.50; the versions in between are not checked yet (#205) |
| Android 12+ (for one detector) | frame_jank reads SurfaceFlinger's frame timeline. Older devices do not have it, and the detector is then silent — which reads exactly like "no bad frames" |
Validated on Android 14 (emulator) and Android 13 (Galaxy A51).
Project layout
android-project/
├── echolot.yml       ← the project half, committed
├── local.yml         ← device serials, binary path; in .gitignore
└── .echolot/         ← traces, reports, run log, reflect reports; in .gitignore
echolot init adds the last two to .gitignore at the root of a git checkout,
and otherwise prints the two lines to add: a trace is tens of megabytes.
Documentation
The documentation is a site with search across every page: grishan0v.github.io/echolot. The same pages are on GitHub, starting at the documentation index. Or jump straight in:
| document | about | |
|---|---|---|
| 🎬 | Collecting | collect, the three modes, callstack sampling, merging repeats |
| 🔎 | Analysing | probe, names, domains — from a trace to a place in the code |
| 🔀 | Comparing | compare — what changed between two reports, and when the repeats support saying so |
| 🧊 | ANRs | anr — reading a report from the field, and measuring a freeze |
| 🏷️ | Marking | mark — first markers for a project with no instrumentation |
| ⚙️ | Detectors | writing your own, the context views, self time versus total |
| 📏 | Calibrating | thresholds from healthy runs, why rank beats percentile |
| 🔒 | Determinism | the pinned trace_processor, doctor, the self-check |
| 🤖 | The agent layer | the plugin and the .claude/ layer, and why the loop lives in a subagent |
| 🪞 | Reflect | the report over an agent session, for improving the tool |
Agent-facing reference material ships inside the package under
echolot/claude/skills/echolot/references/ — the report schema, the config
schema, how ART names things, and how to capture a trace by hand.
Status
v0. Everything planned for it is in place. What each detector was checked against, from the synthetic fixture to live traces, is in Determinism.
A failed detector never fails the run: the error goes to stderr and into
report.json. Working on the tool itself starts at CONTRIBUTING.md, which
GitHub shows as a tab beside this README.
License
1 maintainer

Metadata
1 maintainer
Release files for echolot 0.11.0
For a detailed explanation of source distributions (sdists) and built distributions (wheels), please see the package formats documentation.
Source distribution (sdist)
| File | Size | Uploaded | |
|---|---|---|---|
| echolot-0.11.0.tar.gz | 810.2 kB | Details |
Built distribution (wheel)
| File | Interpreter | ABI | Platform | Reset |
|---|---|---|---|---|
| echolot-0.11.0-py3-none-any.whl | Python 3 | none | any | Details |
Total release size: 1.4 MB
Release files / echolot-0.11.0.tar.gz
| Download URL | echolot-0.11.0.tar.gz |
|---|---|
| Size | 810.2 kB |
| Tags | Source |
|
SHA-256 checksum How to use checksums |
e47a137d8fe869cbac1a2acbb12df31a7a4afca22061a3d5fe2871f6fe683c97
|
|
BLAKE2b-256 checksum How to use checksums |
8f0f51c67ef81d60869eb67dbd48775cb6dc9d55bef358733a0be2149d2430cc
|
| Upload date | |
|
Uploaded using Trusted Publishing? What is trusted publishing? |
Yes |
| Uploaded via |
twine/7.0.0 CPython/3.13.14
|
Provenance
Provenance describes where a file came from. On PyPI, provenance is shared via attestations, which provide a verifiable record of the build or publishing details. View details, limitations and caveats.


PyPI Publish Attestation
PyPI verified that this artifact, at this checksum, originated from the publisher listed below.
Signed by GitHub Actions, verified by PyPI on Oct 9, 2026.
Transparency logRelease files / echolot-0.11.0-py3-none-any.whl
| Download URL | echolot-0.11.0-py3-none-any.whl |
|---|---|
| Size | 565.6 kB |
| Tags | Python 3 |
|
SHA-256 checksum How to use checksums |
176b5252ac2c4f51a9f63af3e5175447dfea2574f9319d34823f27161c739084
|
|
BLAKE2b-256 checksum How to use checksums |
fb4a5c5591acb3413d9e308737f21033235ba97502942ca6f4518e6adb9e8638
|
| Upload date | |
|
Uploaded using Trusted Publishing? What is trusted publishing? |
Yes |
| Uploaded via |
twine/7.0.0 CPython/3.13.14
|
Provenance
Provenance describes where a file came from. On PyPI, provenance is shared via attestations, which provide a verifiable record of the build or publishing details. View details, limitations and caveats.
PyPI Publish Attestation
PyPI verified that this artifact, at this checksum, originated from the publisher listed below.
Signed by GitHub Actions, verified by PyPI on Oct 9, 2026.
Transparency log













