

Turns a huge Android trace into 20 rows of facts an AI agent can actually use.







- Finds the line to fix. From a slow screen to a file and line, with the numbers that prove it.
- Same answer, every run. A pinned
trace_processor: the same trace always gives the same report. - No tracing code needed. Works on apps with zero
trace {}calls; it places temporary markers itself. - Works with your agent. A plugin for Claude Code and Codex; Cursor and
others via
echolot guide.
Quick start
pipx install echolot
Then the plugin, for the agent you use:
# Claude Code
claude plugin marketplace add grishan0v/echolot
claude plugin install echolot@echolot

# Codex
codex plugin marketplace add grishan0v/echolot
codex plugin add echolot@echolot
Open the agent in your Android project and say what is wrong:
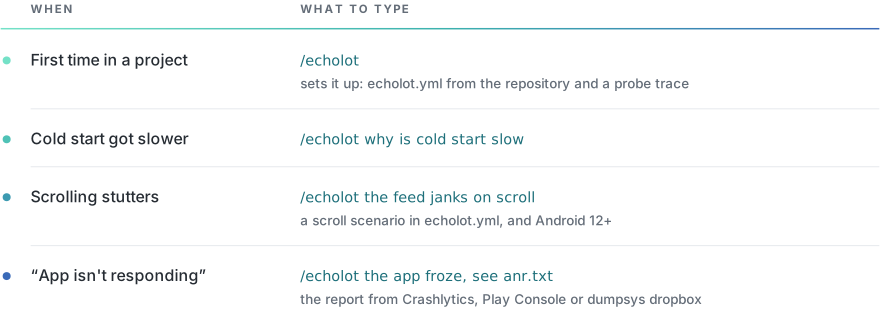
With the plugin, the command is /echolot:echolot in Claude Code and
$echolot in Codex. Without it, echolot init puts /echolot into the
project's .claude/ and points other agents at echolot guide; see
The agent layer.
Without an agent
# record the scenario five times, and build the report from those traces
echolot collect -c echolot.yml -n 5
echolot analyze .echolot/traces/coldStart_iter*.perfetto-trace -c echolot.yml

# what changed since an earlier report
echolot compare before.json .echolot/out/report.json
In CI, one step after the benchmark analyzes its traces and compares them with the report the last good run kept:
- uses: grishan0v/echolot@v0.13.0
  with:
    traces: app/benchmark/build/outputs/**/StartupBenchmark_startup_iter*.perfetto-trace
What it catches
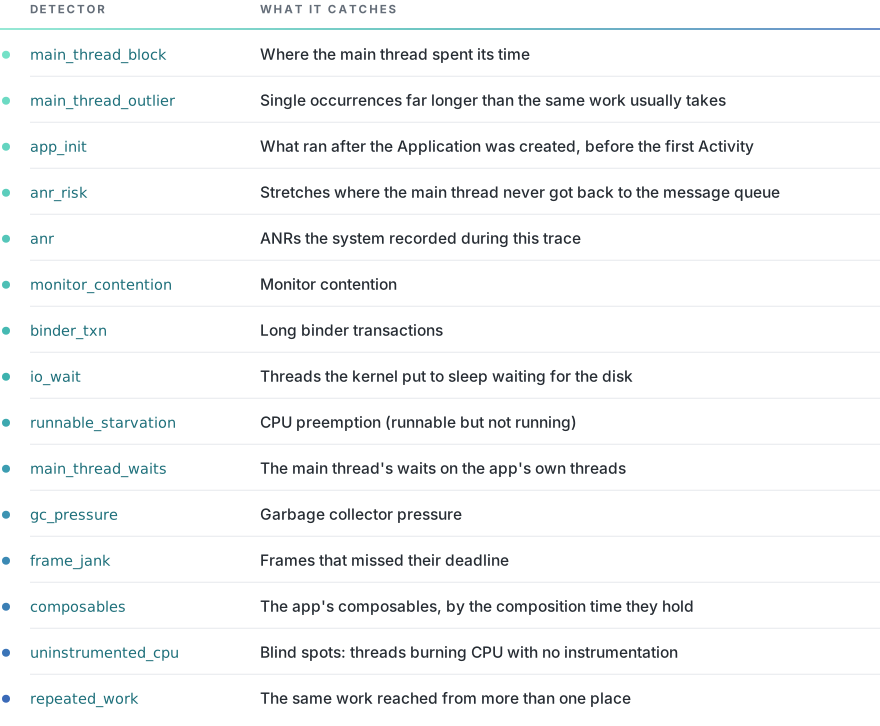
echolot runs fourteen SQL detectors over a Perfetto trace. Each one that finds something becomes a section of the report:
What you get
report.md for you and report.json for the agent, in .echolot/out/.
An 81 MB trace with 475k slices comes out as a 14 KB report.json in about
five seconds.
Example report
# Marker Report

Runs: **5**, numbers are medians across them
Traces: `coldStart_iter000`, `coldStart_iter001`, `coldStart_iter002`, `coldStart_iter003`, `coldStart_iter004`
Scenario: `coldStart`
Process: `com.example.app` (pid 12903)
Scenario window: **1136.05 ms** (from 1084.25 to 1214.18)
Main thread: 40% on a CPU · 1% waiting for a CPU · 9% blocked in the kernel · 49% sleeping
Covered by the findings below: **42%** of the main thread's window, each moment counted once
Startup: cold, **1174 ms** from the launch to the first frame: 42% sleeping · 17% `choreographer_do_frame` · 17% `inflate` · 6% blocked in the kernel · 5% `monitor_contention` · 3% `launch_delay` · 2% `bind_application` · 2% `activity_start`
That is the platform's measure rather than the window: the startup began 38 ms before the window opened, and ended with it.
Device: clock **1478 MHz** (from 1325 to 1574 across repeats), peak 54 °C, 1514 MB free at the low point
Detectors fired: **5 of 14**
Config: `/home/you/my-app/echolot.yml` (sha 3d78738defec) · thresholds: built-in defaults

## Markers
_the names `domains` lists and the `AGENTTMP_` ones; medians per run, self time with children subtracted_

| Marker | Runs | N | Self, ms | Total, ms | Max, ms | Threads |
|---|---|---|---|---|---|---|
| collection_load | 5/5 | 1 | 923.8 | 923.8 | 923.8 | (async) |
| collection_mapping | 5/5 | 1 | 96.0 | 118.3 | 118.3 | arch_disk_io_1 |

## Frames that missed their deadline
_the platform classifies every frame itself, and says whose fault it was. The only detector that answers "which frames stuttered" rather than "where did the total go" — and it needs no instrumentation in the app at all._

| Where | Runs | N | Total, ms | Max, ms | Evidence |
|---|---|---|---|---|---|
| App Deadline Missed | 5/5 | 4 | 427.51 | 130.89 | Self Jank · 4 of 19 frames · longest 188.7 ms |

<sub>detector `frame_jank`, params: {'min_frames': 3, 'min_overrun_ms': 4}</sub>

## Where the main thread spent its time
_measured as SELF time, children subtracted — otherwise one event lands in the report several times at different depths and the agent counts it twice_

| Where | Runs | N | Self, ms | Total, ms | Max, ms | Evidence |
|---|---|---|---|---|---|---|
| inflate | 5/5 | 15 | 222.68 | 241.38 | 49.28 | com.example.app |
| draw | 5/5 | 7 | 120.8 | 120.8 | 34.0 | com.example.app |
| TextLayout:initLayout | 5/5 | 51 | 73.95 | 73.95 | 1.45 | com.example.app |
| Lock contention on a monitor lock (owner tid: 12931) | 5/5 | 9 | 61.6 | 61.6 | 22.4 | com.example.app |

<sub>detector `main_thread_block`, params: {'min_slice_ms': 16}</sub>

## Single occurrences far longer than the same work usually takes
_the pair to main_thread_block. That one asks where the main thread's time went in total; this one asks which single occurrence was out of line with its own history. A heavy tail hides from every sum._

| Where | Runs | N | Total, ms | Max, ms | Evidence |
|---|---|---|---|---|---|
| inflate | 2/5 | 1 | 86.2 | 86.2 | median 12.1 ms of 15 · worst 7.1× |

<sub>detector `main_thread_outlier`, params: {'factor': 4, 'min_abs_ms': 40, 'min_occurrences': 5}</sub>

## Monitor contention
_ART writes a "Lock contention on ..." slice with the owner's tid — ready-made evidence_

| Where | Runs | N | Total, ms | Max, ms | In the code | Evidence |
|---|---|---|---|---|---|---|
| com.example.app | 5/5 | 9 | 61.6 | 22.4 | owner at StoreRepository.kt:30 · blocked at StoreRepository.kt:61 | monitor contention with owner DefaultDispatcher-worker-3 (12931) at void com.example.app.data.StoreRepository.update(com.example.app.data.Item)(StoreRepository.kt:30) waiters=0 blocking from com.example.app.data.Item com.example.app.data.StoreRepository.find(long)(StoreRepository.kt:61) |

<sub>detector `monitor_contention`, params: {'min_block_ms': 8, 'max_total_ms': 50, 'name_glob': 'Lock contention on a monitor lock*', 'name_glob_alt': 'monitor contention with owner*'}</sub>

## Blind spots: threads burning CPU with no instrumentation
_names a thread that burns CPU with no slice around it. The agent does not guess — it is handed the fact "thread T ran for 340 ms, zero slices". That is exactly where adding trace{} pays off._

| Where | Runs | N | Total, ms | Instrumented, ms | Evidence |
|---|---|---|---|---|---|
| DefaultDispatch | 5/5 | 0 | 522.09 | 0.0 | 100.0% of CPU outside slices |

<sub>detector `uninstrumented_cpu`, params: {'min_running_ms': 50, 'max_covered_pct': 50}</sub>

**Silent:** anr, anr_risk, app_init, binder_txn, composables, gc_pressure, io_wait, repeated_work, runnable_starvation

<sub>trace_processor v56.1</sub>
What analyze prints for the demo that comes with echolot: five cold starts
of an app that does not exist, built by code.
Requirements
- Python 3.10 or newer, with
adbandcurlonPATH - a phone or emulator with USB debugging on; Android 12+ for
frame_jank - git 2.36 or newer, for Claude Code to install the plugin
The first command that needs trace_processor downloads it once: 10–14 MB,
checked against its SHA-256. Offline or behind a proxy, see
Determinism.
Documentation
grishan0v.github.io/echolot, or the same pages on GitHub: Collecting · ANRs · Marking · Analysing · Comparing · Calibrating · Determinism · The agent layer · Detectors · Reflect
License
1 maintainer

Metadata
1 maintainer
Release files for echolot 0.13.0
For a detailed explanation of source distributions (sdists) and built distributions (wheels), please see the package formats documentation.
Source distribution (sdist)
| File | Size | Uploaded | |
|---|---|---|---|
| echolot-0.13.0.tar.gz | 873.4 kB | Details |
Built distribution (wheel)
| File | Interpreter | ABI | Platform | Reset |
|---|---|---|---|---|
| echolot-0.13.0-py3-none-any.whl | Python 3 | none | any | Details |
Total release size: 1.5 MB
Release files / echolot-0.13.0.tar.gz
| Download URL | echolot-0.13.0.tar.gz |
|---|---|
| Size | 873.4 kB |
| Tags | Source |
|
SHA-256 checksum How to use checksums |
3975b083af9b915aa538aeb259072ebafb660db4268dcfd48f511f0cea8e8371
|
|
BLAKE2b-256 checksum How to use checksums |
373413ccf6f905b0738b696608a654d9c1dc89a6888b721808598e9a0faffb11
|
| Upload date | |
|
Uploaded using Trusted Publishing? What is trusted publishing? |
Yes |
| Uploaded via |
twine/7.0.0 CPython/3.13.14
|
Provenance
Provenance describes where a file came from. On PyPI, provenance is shared via attestations, which provide a verifiable record of the build or publishing details. View details, limitations and caveats.


PyPI Publish Attestation
PyPI verified that this artifact, at this checksum, originated from the publisher listed below.
Signed by GitHub Actions, verified by PyPI on Oct 14, 2026.
Transparency logRelease files / echolot-0.13.0-py3-none-any.whl
| Download URL | echolot-0.13.0-py3-none-any.whl |
|---|---|
| Size | 605.0 kB |
| Tags | Python 3 |
|
SHA-256 checksum How to use checksums |
b2a144cd2f30d84dbfe0d69fc73cbdec303e0d4fd1b5cc01d22f25939139cc0a
|
|
BLAKE2b-256 checksum How to use checksums |
ca8f5515e7a354ad6847e5ffae6c7c61d5aaf5f1af65de70adeaf816169cab11
|
| Upload date | |
|
Uploaded using Trusted Publishing? What is trusted publishing? |
Yes |
| Uploaded via |
twine/7.0.0 CPython/3.13.14
|
Provenance
Provenance describes where a file came from. On PyPI, provenance is shared via attestations, which provide a verifiable record of the build or publishing details. View details, limitations and caveats.
PyPI Publish Attestation
PyPI verified that this artifact, at this checksum, originated from the publisher listed below.
Signed by GitHub Actions, verified by PyPI on Oct 14, 2026.
Transparency log













