
EnvGeo-Seawater 🌊
EnvGeo-Seawater is an interactive platform for exploring seawater isotope and hydrographic data.



Current release-candidate version: 1.3.4 (2026-09-28)
An interactive platform for exploring seawater isotope and hydrographic data.
Overview
EnvGeo-Seawater has been used for exploratory analysis of seawater isotope datasets in marine geochemistry research.
EnvGeo-Seawater is a web-based interactive visualization platform for marine geochemical and hydrographic datasets, including stable water isotopes (δ¹⁸O, δD), salinity, temperature, and depth.
It integrates curated regional datasets (e.g., around Japan) and major global datasets (~50,000 records), enabling consistent cross-comparison under unified analytical conditions.
The platform is designed to support both exploratory data analysis and reproducible research workflows in marine geochemistry and oceanography.
Key Features
- 🌍 Interactive map visualization with adaptive zoom
- 📊 Depth profiles with gap-aware plotting
- 📈 Temperature–Salinity (T–S) diagrams with approximate σ0 reference contours
- 📉 Regression analysis (e.g., salinity–δ¹⁸O relationships)
- 🧭 3D / 4D visualization of spatial–temporal structures
- 📂 Session-only browser uploads and optional persistent local
User Excel datafor comparison with reference datasets - 🧾 Transparent data handling (filtered / excluded samples clearly reported)
- 🖼️ Export of publication-quality figures
Main Pages
The Streamlit app uses home.py for the about, data-source, manual,
update-log, and Japanese information tabs. The pages/ directory contains the
supported stable visualization tools listed below. Development-only and local
diagnostic pages are excluded from this repository and release; see
docs/stable_release_publication_notes.md for the public scope.
-
pages/03_[Interactive]_2Dplus_Visualizer.pyInteractive 2D/2.5D plots for isotope-hydrographic relationships and selected sample locations. -
pages/04_[Interactive]_3D_4D_Visualizer.pyInteractive 3D/4D seawater visualizer for longitude, latitude, depth, and selected variables. -
pages/05_User_Data_Check_Quick_Visualizer.pyUser Data Check & Quick Visualizer for reference and CSV/XLSX upload data. It combines shared filtering, missing-value and quality review, 2D Map, Salinity-d18O, Temperature-Salinity, arbitrary 2D/3D/4D, geographic 3D, and filtered CSV export. -
pages/31_Salinity-d18O_Relationship.py
Salinity-δ18O relationship plots with optional regression lines. -
pages/32_Isotope_Hydrographic_Mapping.py
Isotope and hydrographic maps for d18O, dD, d-excess, salinity, and temperature distributions. -
pages/34_T-S_diagram.py
Temperature-salinity diagrams with density contours. -
pages/37_Depth_Profile.pyDepth profiles for δ18O, δD, d-excess, temperature, and salinity. -
pages/35_Custom_Parameter_Plot.pyFlexible custom 2D parameter plots with selectable X axis, Y axis, color, and marker size. -
pages/53_Vertical_Section_Visualizer.pyVertical Section Visualizer beta. This experimental page is used to refine section-line selection, interpolation, bathymetry handling, and vertical-section plotting. -
pages/80_Correlation_Overview.pyArchive display of the original hand-written exploratory workflow used during development. It is retained as a development record; no new features are planned.
The former standalone about page was merged into home.py.
Local Diagnostic Tool
The installed package includes a local Streamlit-based environment checker. It is intended for local use when confirming Python paths and installed dependency versions. The diagnostic results can be exported as CSV or PDF reports:
envgeo-seawater-check
In a source checkout, the equivalent command is
streamlit run tools/env_check_streamlit.py. The development-only
pages/99_Environment_Check.py wrapper is not included in the installed
package or public deployment, so the normal application navigation contains
only public visualization pages.
User Data Integration
Use the browser upload controls in the visualization pages to load CSV or XLSX
measurements for the current Streamlit session. The Data Check & Quick Visualizer is the upload-first entry point for quality review and simple
2D--4D exploration; supported specialist pages also expose Uploaded data in
their shared Data filtering controls.
The repository bundles local_data/user_data.xlsx as a zero-value public
sample for the always-loaded User Excel data workflow. It is assigned the
dataset name User Excel data and combined with each selected reference source,
so it appears in Data filtering from app startup without a browser upload. For
researcher-owned measurements, either edit local_data/user_data.xlsx for
local use or set ENVGEO_LOCAL_USER_DATA_PATH to a CSV, XLSX, or XLS file.
Before committing or synchronizing a public copy, restore the zero-value sample
and never commit research data. Restart Streamlit or clear its data cache after
changing either table.
The always-loaded User Excel data and browser Uploaded data are independent.
A browser upload does not overwrite the local workbook; when both categories
are selected, both are combined with the selected reference data.
Browser-uploaded files are handled in memory during the current Streamlit session only. The app does not save uploads or merged user/reference datasets.
Spreadsheet numbers copied from web pages, PDFs, or other workbooks may contain invisible Unicode spaces. EnvGeo removes common regular, non-breaking, narrow non-breaking, and full-width spaces before numeric conversion and normalizes a Unicode minus sign. Values that still cannot be interpreted as numbers remain missing rather than being guessed. The same normalization is used for the always-loaded local table and browser uploads.
Why this tool?
EnvGeo-Seawater enables integrated exploration of isotope and hydrographic data, which are typically analyzed separately.
Unlike conventional tools that treat datasets and visualization separately, EnvGeo-Seawater provides an integrated, interactive framework for exploring isotope–hydrographic relationships and enables direct comparison with user-provided data.
- Integrated multi-parameter visualization
- Consistent filtering across datasets
- Direct comparison between user data and curated datasets
- A unified analytical framework across regional and global datasets
Data Characteristics
The platform includes internally consistent datasets (e.g., around Japan) analyzed under unified criteria, enabling rigorous cross-comparison.
A key strength is that a substantial portion of the regional datasets (around Japan) has been analyzed by the author using consistent analytical protocols, ensuring high comparability across sampling campaigns.
In particular, regional datasets curated by the author provide:
- Consistent analytical methods
- Harmonized data structure
- High comparability across sampling campaigns
This ensures that observed patterns reflect environmental signals rather than methodological differences.
Data Availability
The bundled datasets are public source records or project-derived workbooks
included under the project's documented scholarly-use distribution decision.
This does not make third-party records project-owned or assert a general
redistribution licence beyond the source-specific records. See
docs/dataset_redistribution_audit.md,
docs/provenance_inventory.md, and
docs/THIRD_PARTY_NOTICES.md.
- Provided in a standardized format for immediate use
Unpublished or restricted datasets are not included.
Installation & Requirements
Compatibility checks currently cover Python 3.10.15 / Streamlit 1.42 and
Python 3.12.14 / Streamlit 1.63, with Plotly 5.24 retained as the release
baseline. See docs/streamlit_migration.md for the tested environment matrix
and remaining interactive checks.
Install the published package
Once v1.3.4 has been published to PyPI, install and launch the application without cloning the source repository:
python -m pip install envgeo-seawater
envgeo-seawater
💡 Special Note for macOS (Apple Silicon) Users:
To avoid build errors with geospatial libraries, create a Conda environment and install the compiled geospatial prerequisites from conda-forge before installing the published package with pip:
# 1. Create and activate environment
conda create -n envgeo python=3.12
conda activate envgeo

# 2. Install pre-built geospatial binaries
conda install -c conda-forge proj pyproj=3.6.1 cartopy=0.25.0 -y

# 3. Install and launch EnvGeo-Seawater
python -m pip install envgeo-seawater
envgeo-seawater
Source checkout (development)
git clone https://github.com/envgeo/seawater_map.git
cd seawater_map
python -m pip install -r requirements.txt
streamlit run home.py
Use this route only when developing, inspecting, or testing the source. Then open the local URL shown in the terminal (typically http://localhost:8501).
Offline and Shipboard Use
Offline operation is an important design goal for EnvGeo-Seawater. A key use case is checking newly collected seawater data aboard a research vessel, where satellite connectivity may be limited, unstable, or unavailable. Local analysis can help researchers identify outliers, coordinate errors, missing values, and unexpected depth profiles while there is still time to repeat measurements, collect additional samples, or adjust the cruise plan.
The bundled datasets and most non-map analysis workflows can be run locally after the Python environment has been installed. Plotly map pages include a local coastline layer: selecting Coastline (offline) uses a tile-free white background, and an unavailable online tile service automatically falls back to that local map with an explicit warning. The online manual video remains supplementary and may be unavailable at sea without affecting the core workflow. Folium's map-drawing A–B selector still needs online browser assets; Vertical Section remains usable offline through manual A/B coordinate entry.
The static Cartopy maps (page 32 – Isotope Hydrographic Mapping) draw their
land mask from a Natural Earth 50m land shapefile that is bundled in the
repository under coastline/natural_earth_50m_land/. No external Natural
Earth download is required to render those maps.
Pages 03 (2D+ Visualizer), 04 (3D/4D Visualizer), and 05 (Quick Visualizer) provide a "Download interactive HTML" button below each main figure. The downloaded file embeds Plotly.js inline, so its Plotly interaction works without a network connection. If a saved map uses an online background style, its basemap tiles are not embedded; select Coastline (offline) before exporting a map intended for offline geographic use.
API Usage
Core functionality can be accessed programmatically:
import envgeo_utils

df = envgeo_utils.load_isotope_data("with [Global data sets]")

df_filtered = envgeo_utils.sidebar_filter_and_display(
    df,
    ref_data="with [Global data sets]",
    data_source_JAPAN_SEA="Kodama et al. (2024) [ECS - Japan Sea]",
    data_source_AROUND_JAPAN="with [Around Japan]"
)
Testing
Basic functionality can be verified using pytest:
pytest
The current test suite and its limitations are described in docs/testing.md.
Additional Documentation
Project checklists and longer development notes are kept under docs/.
-
Figure-supported online user guide: public English and Japanese, page-by-page operating guidance for the stable release.
-
docs/THIRD_PARTY_NOTICES.md: concise source, attribution, and scope notice for bundled third-party data and geospatial assets. -
docs/release_checklist.md
Release and deployment checklist for local testing, Streamlit deployment, GitHub release preparation, and Zenodo archiving. -
docs/testing.md
Overview of the pytest suite, current coverage, limitations, and planned test expansion. -
docs/manual/
Source Markdown for the page-by-page manual published through the online user guide.
Directory Structure
-
home.pyMain Streamlit entry point for EnvGeo-Seawater. -
envgeo_utils.pyShared utilities for dataset loading, data cleaning, filtering, common Plotly layout, map styles, coastline loading, and table display. -
envgeo_assets.pyResolves paths to read-only resources bundled with the application, without depending on the launch directory. -
envgeo_user_data.pyProvides session-only browser-upload controls, column normalisation, and display helpers for user-supplied data. Browser uploads are not written to disk by this module. -
envgeo_launcher.pyStarts the installed application through theenvgeo-seawatercommand. -
envgeo_diagnostic_launcher.pyStarts the local diagnostic tool through theenvgeo-seawater-checkcommand; it is separate from the public app navigation. -
pages/
Stable visualization page files shown in the app sidebar. -
tools/
Local support tools that are included in the package but not shown in the public Streamlit app sidebar. -
dataset/
Curated seawater isotope and hydrographic datasets used by the application. -
data/
Sample files and media used by the app, including template data, GIF/MP4 examples, and temporary coastline sample files. -
data_text/
Markdown resources for about text, references, manuals, Japanese notes, and English/Japanese update logs. -
images/
Figures and example outputs used in README and documentation. -
coastline/
Local 50m and 110m coastline coordinate CSV files for map and 3D reference overlays, plus a bundled Natural Earth 50m land shapefile (natural_earth_50m_land/) used as the land mask on static Cartopy maps. Made with Natural Earth (https://www.naturalearthdata.com/). Public domain. -
test/
Basic pytest tests for imports, dataset loading, numeric conversion, gap-row insertion, colorscales, and coastline loading.
Core functionality is implemented as reusable Python functions in envgeo_utils.py, allowing programmatic access outside the Streamlit interface.
Usage
- Select a dataset (Japan Sea / Around Japan / Global)
- Apply filters (location, depth, time, parameters)
- Explore:
- Maps
- T–S diagrams
- Depth profiles
- Regression plots
- Upload your own data for comparison (optional)
- Export figures
Reproducibility
This repository contains:
- The full source code of the visualization platform
- All required public datasets (lightweight, <30 MB total)
- A template for user-defined data integration
Therefore, the core visualizations can be reproduced in a local environment using the provided code, datasets, and documented settings.
Figures can be reproduced by running the application locally using the provided datasets and following the Quick Start instructions above, with the caveat that experimental beta workflows may change between development versions.
Due to the interactive nature of the application, functionality is validated through manual testing and visual inspection.
Experimental features are included for development purposes and may change in future versions. These features are clearly separated from the core functionalities.
Limitations
- Interactive 3D/4D visualizations can be slow with large global selections.
- Plotly 3D interaction is best on a PC; 2D plots are more suitable for smartphones and tablets.
- User data upload is currently Excel-centered and depends on the expected column structure.
- Dataset interpretation depends on the original data sources, analytical methods, and metadata. Users should cite and evaluate the underlying data providers when using outputs in publications.
Data Sources and Attribution
The platform integrates major seawater isotope datasets:
- CoralHydro2k: a global seawater oxygen isotope database (Atwood et al., 2026, ESSD)
- NASA GISS Global Seawater Oxygen-18 Database (Schmidt et al., 1999)
- Kodama et al. (2024), Geochemical Journal
- Additional regional datasets
For publication, teaching material, or redistributed outputs, cite both
EnvGeo-Seawater and the original dataset providers used in the selected
visualization. Source details are shown in the app and in the Markdown files
under data_text/.
Software and geospatial acknowledgements
EnvGeo-Seawater uses Streamlit for the application interface and Plotly for
interactive figures. Selected scientific colour palettes are provided by
cmocean. The T–S diagram draws explicitly approximate σ0 reference contours
with the Gibbs SeaWater (GSW) implementation of TEOS-10; it does not perform a
per-observation conversion to Absolute Salinity and Conservative Temperature.
The Vertical Section Visualizer can use a project-derived, downsampled GEBCO
2025 Grid for seafloor context only; it is not a navigation product. Natural
Earth supports the bundled land assets; its attribution appears above. Full
bibliographic and provenance records are maintained in paper.bib and docs/.
AI-assisted development and human oversight
From version 1.3 onward, development of EnvGeo-Seawater has made substantial use of AI coding assistants — OpenAI Codex and Anthropic Claude Code — for code review, implementation drafting, refactoring, test design and authoring, bug investigation, and documentation.
AI tools are used as assistants, not as authors or co-developers. Every
adopted change is reviewed, edited, and verified by the human author before
being merged. The author is solely responsible for all scientific and
technical judgment, the accuracy of the software and its documentation,
licensing, and the content published under this project. See
docs/development_notes.md for more detail on this policy.
Live Demo
Primary stable demo: https://envgeo-seawater-map.streamlit.app
Stable demo with experimental updates: https://envgeo-seawater-pre.streamlit.app
Prior workflow use
Before EnvGeo-Seawater had an archival software DOI, it was used in the author's and collaborators' workflows to select, explore, and visualize subsets of the Kodama et al. (2024) regional seawater isotope dataset. The resulting publications cited the underlying dataset paper rather than this software. They are therefore examples of workflow use, not direct software citations.
Future development
The data model can accommodate additional datasets after their sources, provenance, and redistribution status have been recorded. Reusable visualization, asset-resolution, and distribution components may support future related EnvGeo applications. These are future directions, not functions or datasets included in the v1.3.4 release candidate.
Citation
Ishimura, T. (2026).
EnvGeo-Seawater: An Interactive Platform for Exploring Seawater Isotope and Hydrographic Data.
Archival citation details will be added after release.
Examples
EnvGeo-Seawater enables multi-scale exploration of seawater isotope and hydrographic data, from global distributions to detailed interactive analysis.
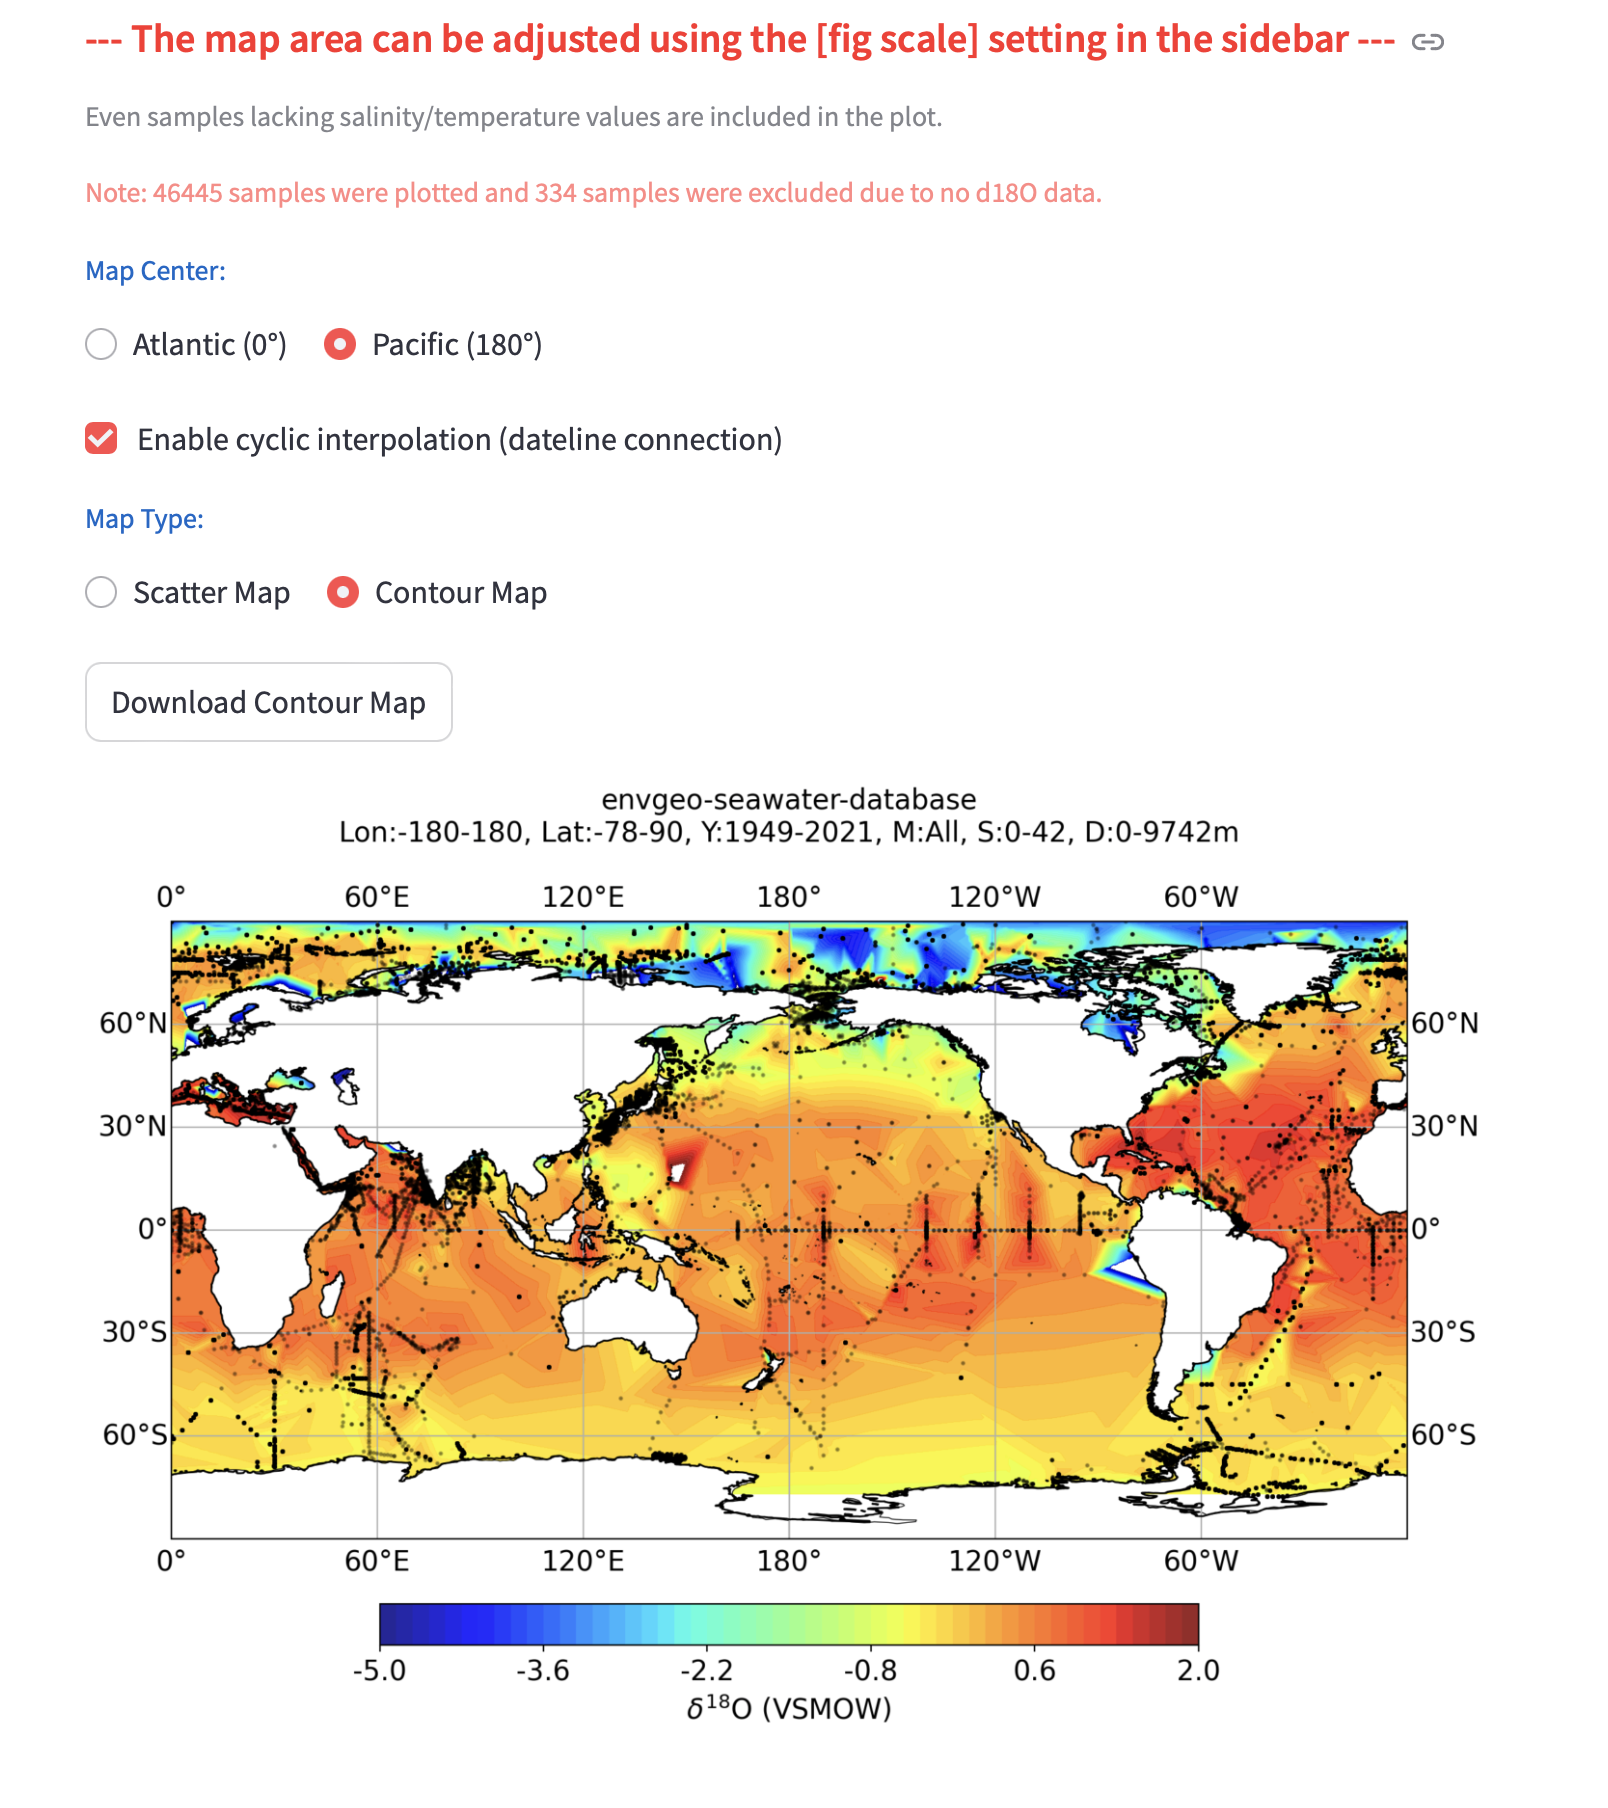
Global Isotope Distribution (Contour Map)
Spatial distribution of seawater δ18O at the global scale, based on integrated datasets (approximately 50,000 records).
Contour interpolation highlights large-scale oceanographic patterns and basin-scale variability.
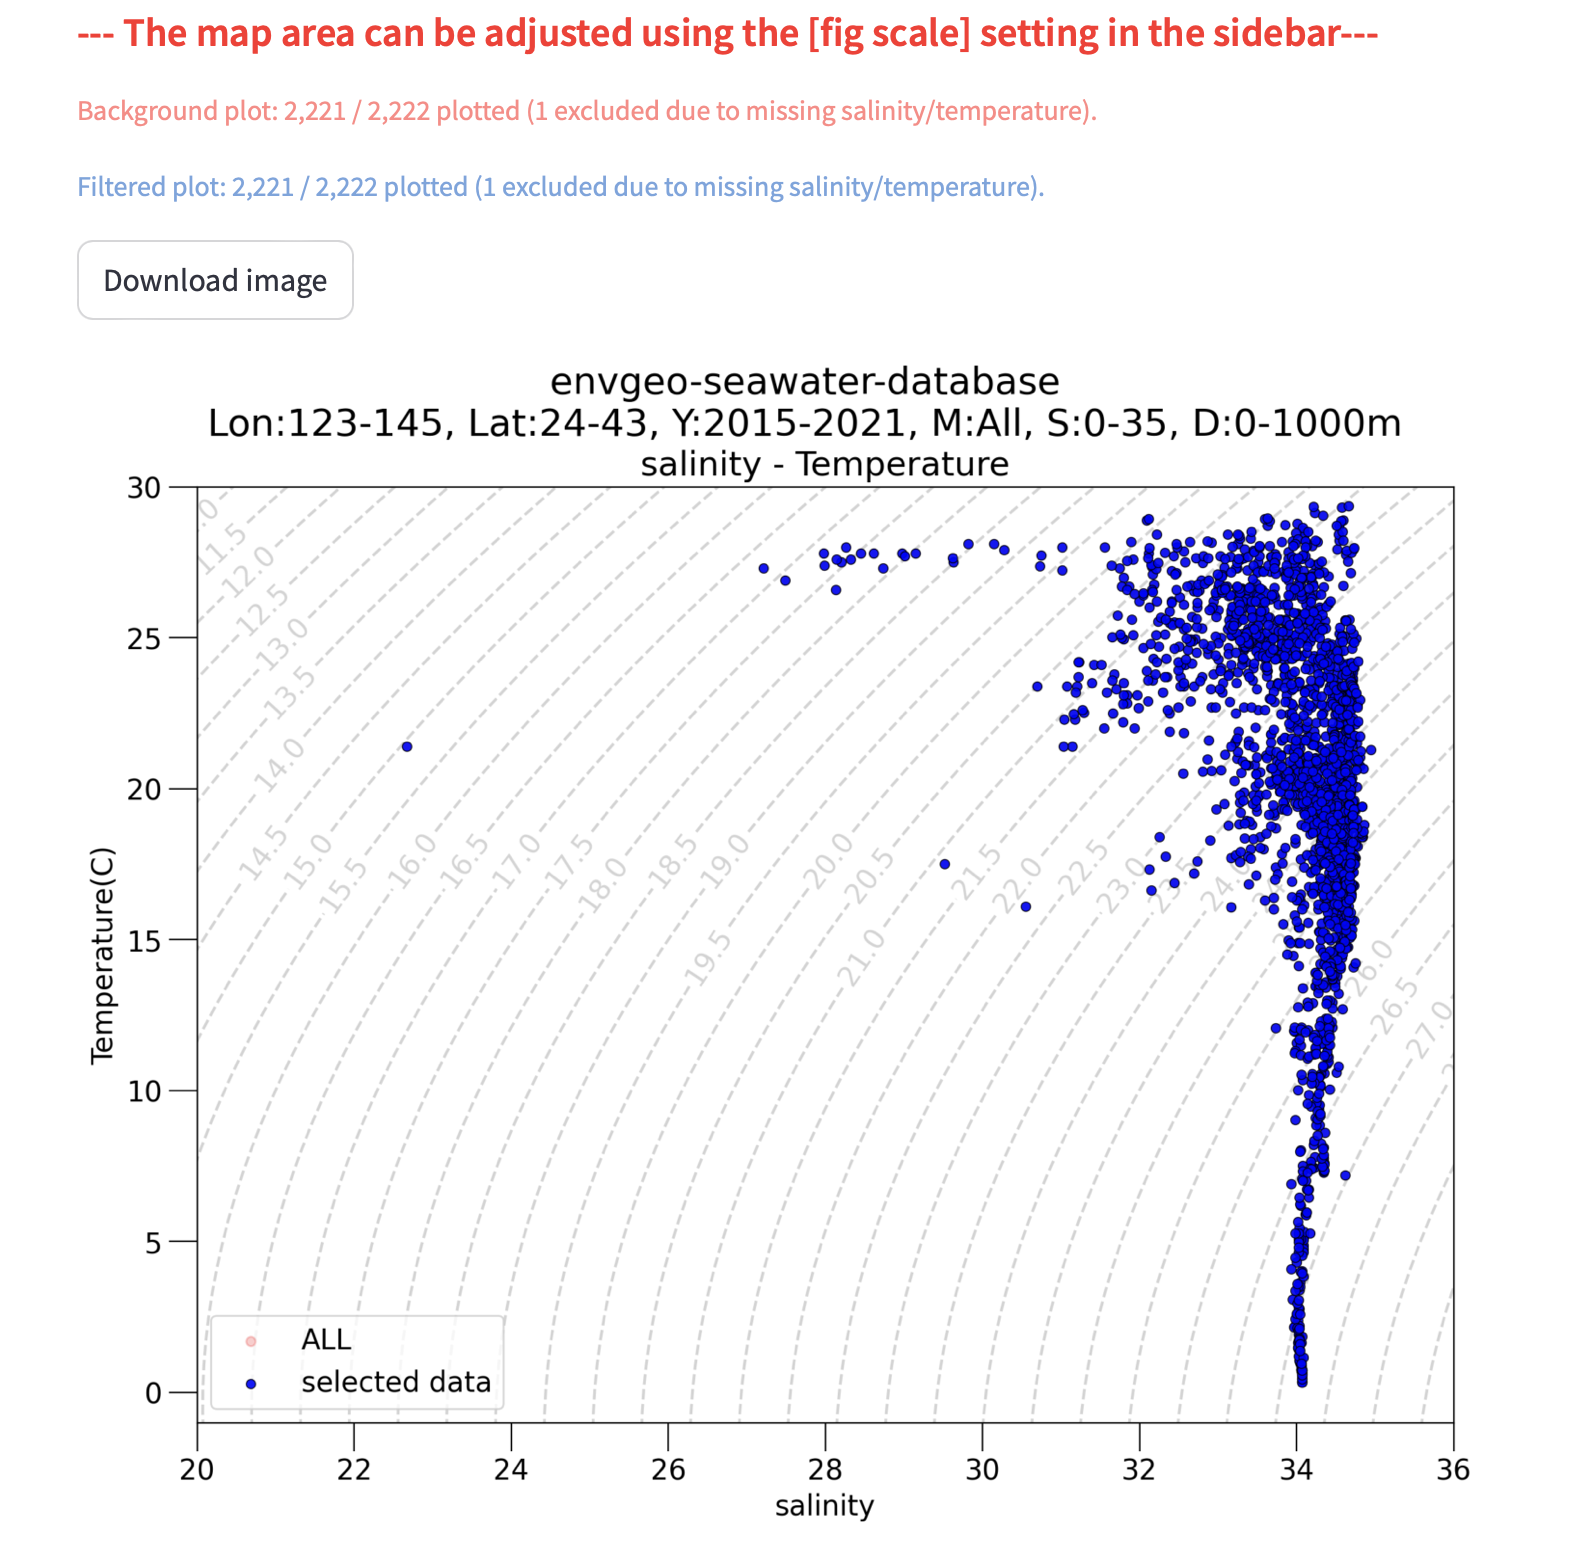
Temperature–Salinity Diagram
Temperature–salinity (T–S) relationships with overlaid approximate σ0 reference contours (Practical Salinity ≈ Absolute Salinity; in-situ temperature ≈ Conservative Temperature). This visualization supports identification of water masses and examination of isotope–hydrography relationships.
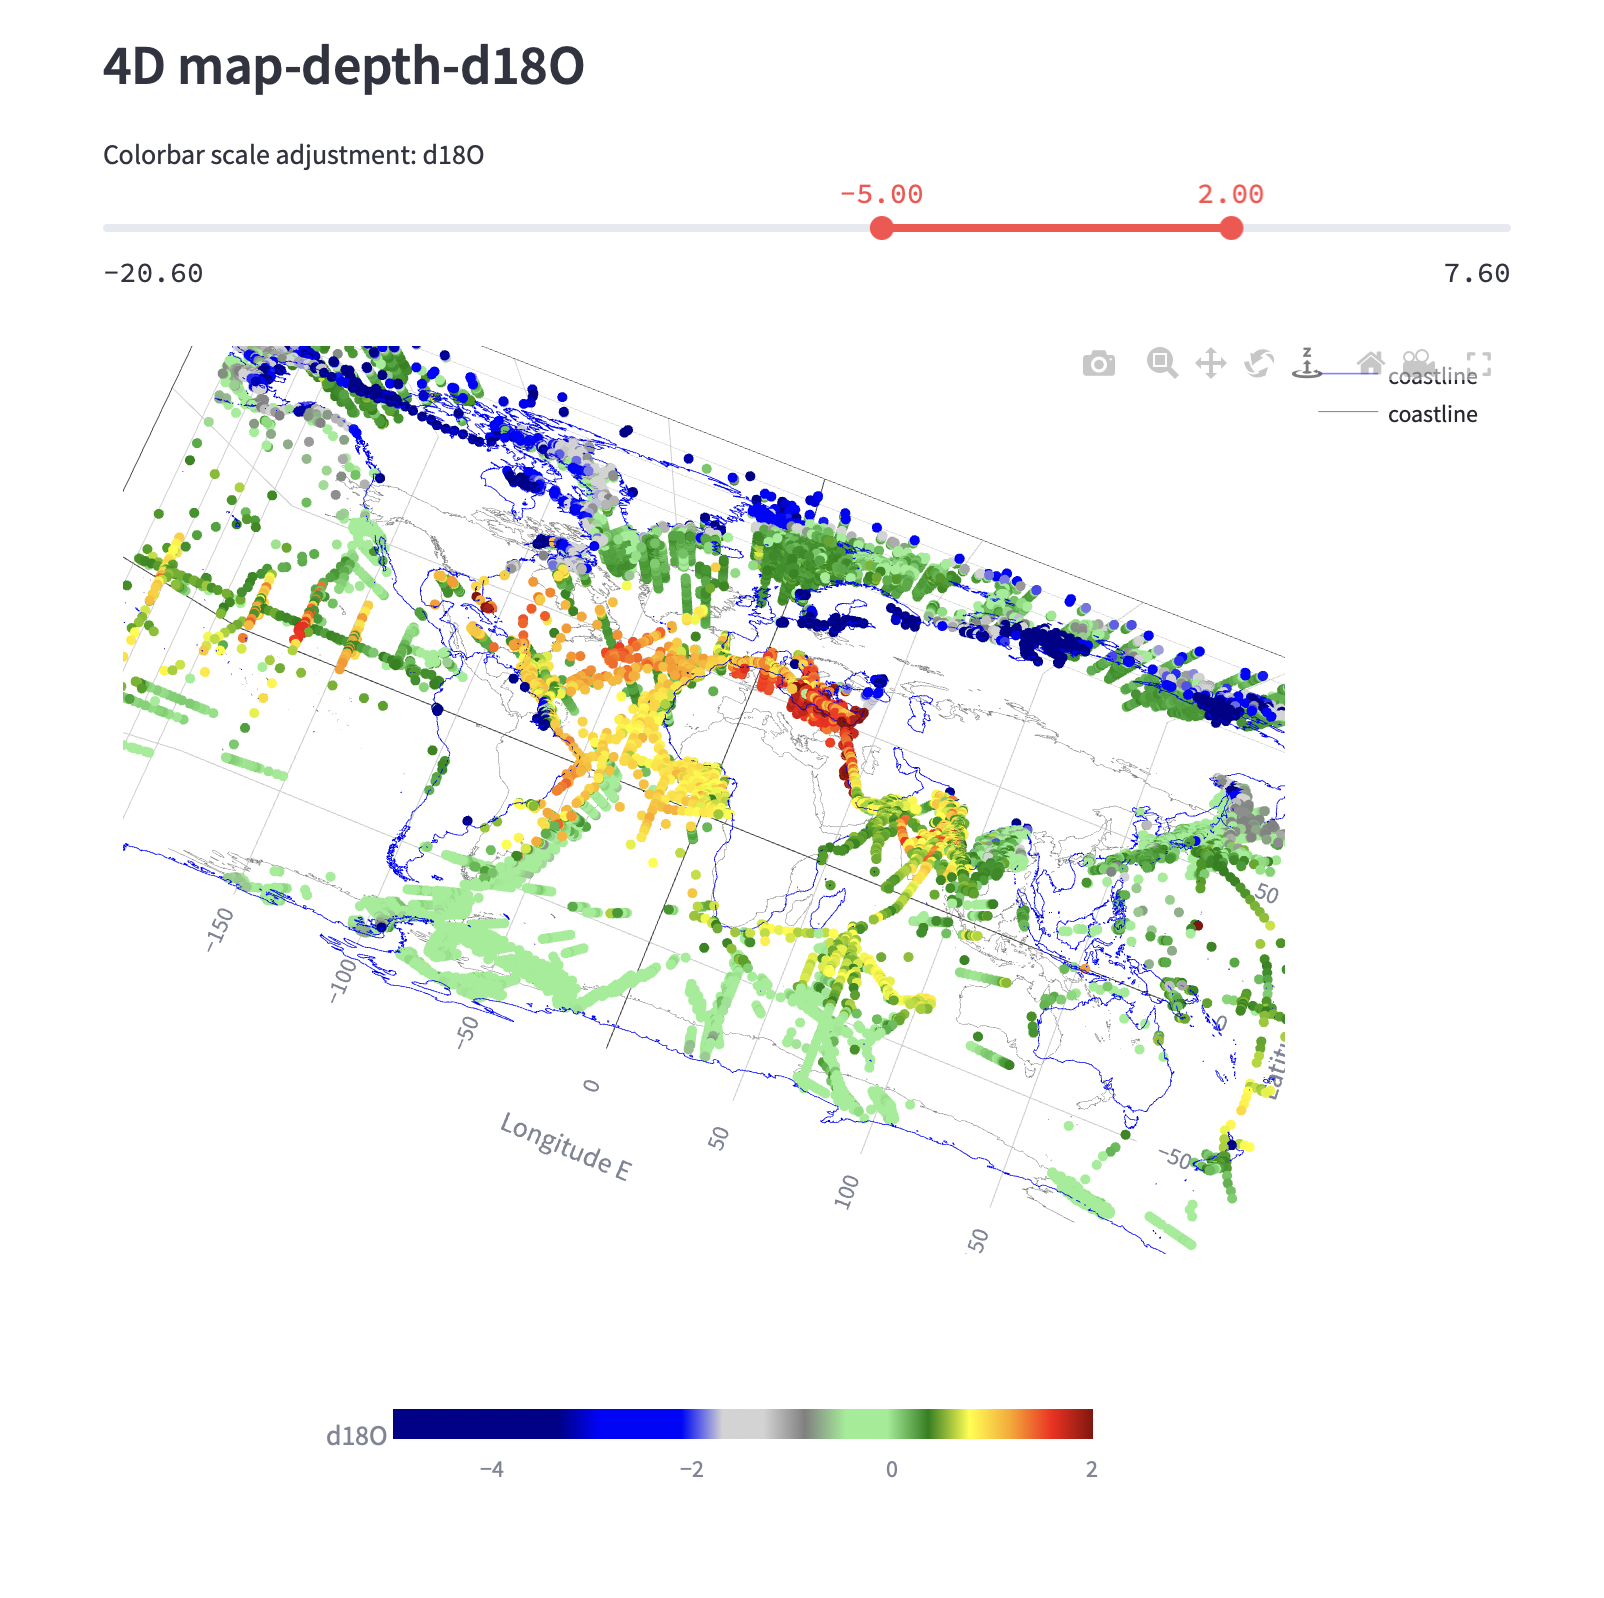
4D Visualization (Longitude–Latitude–Depth–δ18O)
Multi-dimensional visualization of seawater isotope data, incorporating spatial coordinates and depth.
This allows exploration of vertical structure and spatial gradients simultaneously.
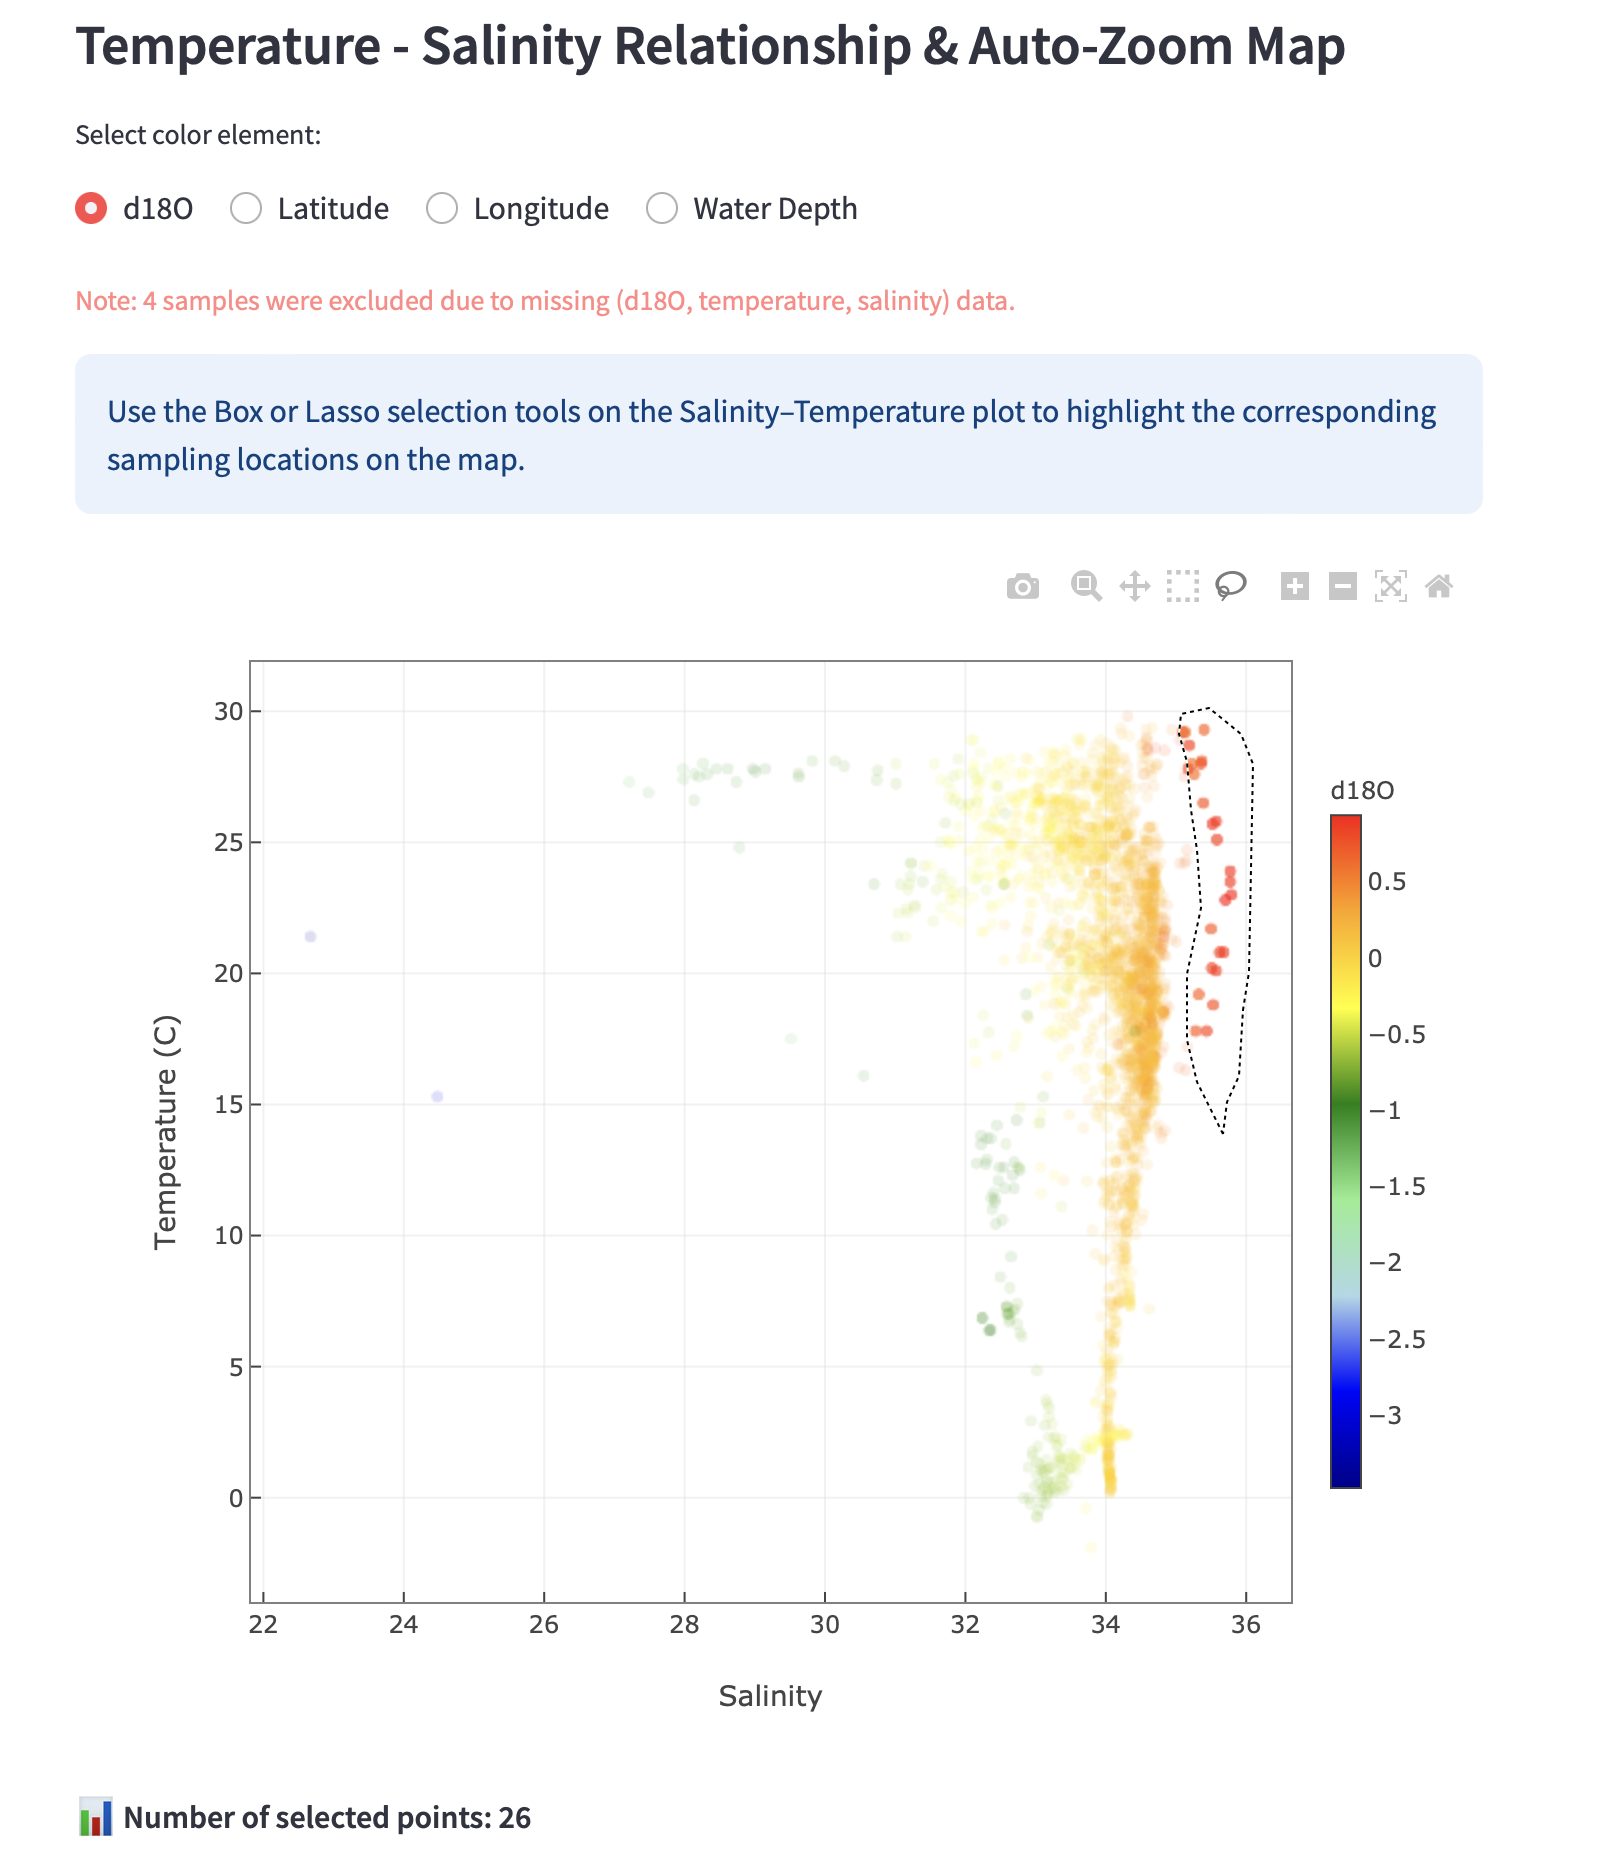
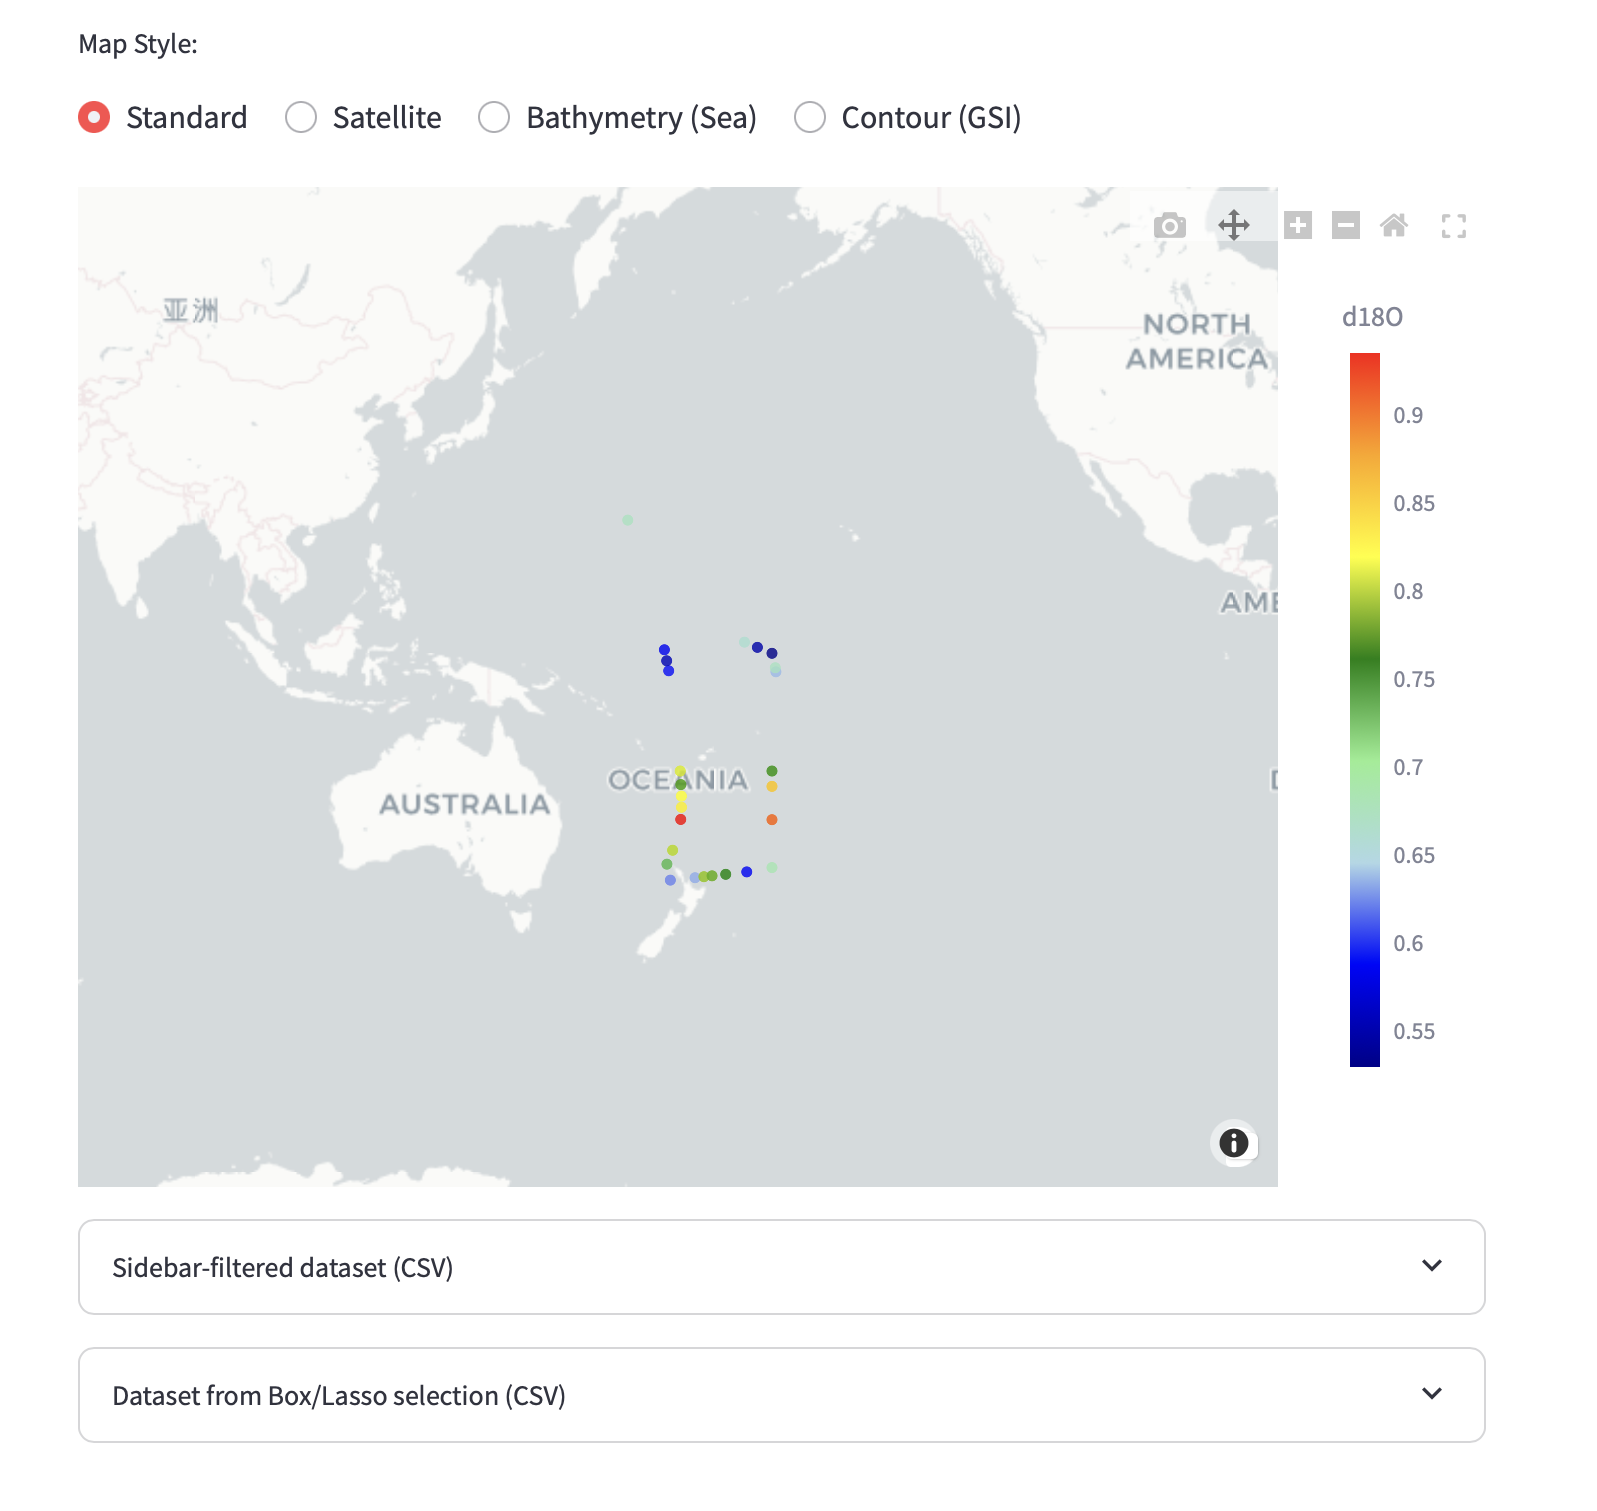
Interactive Selection (Map–T–S Linkage)
Linked visualization between T–S space and geographic location.
Selected subsets in the T–S diagram are dynamically highlighted on the map, enabling intuitive interpretation of water mass origins.
License
MIT License
1 maintainer

Metadata
1 maintainer
Release files for envgeo-seawater 1.3.4
For a detailed explanation of source distributions (sdists) and built distributions (wheels), please see the package formats documentation.
Source distribution (sdist)
| File | Size | Uploaded | |
|---|---|---|---|
| envgeo_seawater-1.3.4.tar.gz | 26.0 MB | Details |
Built distribution (wheel)
| File | Interpreter | ABI | Platform | Reset |
|---|---|---|---|---|
| envgeo_seawater-1.3.4-py3-none-any.whl | Python 3 | none | any | Details |
Total release size: 52.0 MB
Release files / envgeo_seawater-1.3.4.tar.gz
| Download URL | envgeo_seawater-1.3.4.tar.gz |
|---|---|
| Size | 26.0 MB |
| Tags | Source |
|
SHA-256 checksum How to use checksums |
8b319ac4b3176c7280be402b858fa2e2da17e3deac476ce064b7cb9baf29e61c
|
|
BLAKE2b-256 checksum How to use checksums |
bdb6d615fb0c873d7d08c11143219281fa196a71127efc03dd0e5775d5d16654
|
| Upload date | |
|
Uploaded using Trusted Publishing? What is trusted publishing? |
No |
| Uploaded via |
twine/7.0.0 CPython/3.12.8
|
Release files / envgeo_seawater-1.3.4-py3-none-any.whl
| Download URL | envgeo_seawater-1.3.4-py3-none-any.whl |
|---|---|
| Size | 26.0 MB |
| Tags | Python 3 |
|
SHA-256 checksum How to use checksums |
ae3cf31365758b639e08d41497ac15452a8738db07f422b973b969c5eb3258f7
|
|
BLAKE2b-256 checksum How to use checksums |
8cde92d05a7448fca23d0cfdd1dbf3666148906e7b01ab3f5226a69371b7cd9e
|
| Upload date | |
|
Uploaded using Trusted Publishing? What is trusted publishing? |
No |
| Uploaded via |
twine/7.0.0 CPython/3.12.8
|













